
Abstract
To what extent does the public prefer local government officials to be selected via nonpartisan, as opposed to partisan, elections? Do preferences vary across different types of local offices? Do Democrats and Republicans systematically differ in their preference for nonpartisan versus partisan local elections? Using a novel dataset based on the 2018 and 2020 CES, I find that while nonpartisan elections are the modal preference for local offices, the proportion of voters favoring this model varies with office-type, party ID, and whether respondents live in counties with a majority of their co-partisans. Specifically, Democrats are more likely to prefer nonpartisan elections for local offices than are Republicans, but there is only evidence for these inter-party differences in Republican-leaning counties. County partisanship also has a significant effect on intra-party variation in preference for nonpartisan elections to certain local offices.
Introduction
Guilford County, NC held its first partisan election for school board in 2016. After a second cycle of partisan elections in 2018, a bipartisan group of state legislators filed bills to reverse course—making school board elections nonpartisan once again. While the Guilford case may be an outlier example of legislative whiplash, it is part of a larger trend of state legislatures specifying the time, place, and manner that local jurisdictions must conduct their elections. 1 Several high-profile examples of this legislative activity came in the wake of local government response to the COVID-19 pandemic, such as a 2021 Tennessee law that gives all counties the option to switch to partisan school board elections (“HB9072,” 2021), or a proposal from Florida legislators (“Partisan Elections for Members of District School Boards,” 2021) that will ask voters to amend the state constitution to require all county school boards to be elected via partisan ballot. These proposals are not just responses to salient partisan debates, however. Legislators had been busy proposing bills well-prior to 2019. 2 According to two legislative databases maintained by the National Council for State Legislatures, between 2001 and 2010, only five pieces of legislation were proposed that specifically changed some local elections from partisan to nonpartisan or vice-versa. Between 2010 and 2019, that number jumped to fifty-six.
The public-facing arguments for these changes often conflict with prior research that gives good cause for skepticism. There is evidence that support for particular election systems is partially based on perceived advantages. Abolishing the Electoral College had bipartisan support in the 1960s. After two elections where a Democratic candidate won the popular vote but lost the Electoral College (2000 and 2016) a sharp partisan divide emerged, with 81% of Democrats but just 19% of Republicans agreeing the national popular vote should determine the presidency (Skelley, 2019). At the local level, nonpartisan elections have been shown to benefit the Republican Party (Hawley, 1973; Lee, 1960; Williams and Adrian, 1959). In the first systematic examinations of nonpartisan elections, Adrian (1952) shows that incumbent success increases with nonpartisan elections, a finding supported by later research on the value of incumbency and name recognition in nonpartisan elections (Ansolabehere et al., 2006; Schaffner et al., 2001).
Some states mandate partisan elections for local offices and others leave those decisions to local jurisdictions. In 42 states, the county Sheriff and District Attorney are elected by partisan ballot, but in 44 states all local school boards are elected by nonpartisan ballot. 3 The vast majority of municipalities use nonpartisan ballots for mayoral and city council elections (National League of Cities, 2018). All told, most local officials are still selected by the nonpartisan ballot. But is that actually the way the public prefers to choose its local leaders?
To provide insight on these questions, I use new data from the 2018 and 2020 Cooperative Election Study (CES), revealing the public’s preferences as they relate to selection methods for various local offices. I find that while nonpartisan elections are the modal preference for local offices, the proportion of voters favoring this model varies with office-type, party ID, and whether respondents live in counties with a majority of their co-partisans. Specifically, Democrats are more likely to prefer nonpartisan elections for local offices than are Republicans, but these inter-party differences only manifest in Republican-leaning counties. County partisanship also has a significant effect on intra-party variation in preference for nonpartisan elections to certain local offices. For example, Democrats living in solid Republican counties are more likely to support nonpartisan elections for sheriff and school board compared to Democrats living in solid Democratic counties. Lastly, I provide evidence that the effects of county partisanship on inter and intra-party variation are robust to various controls, specifically—educational attainment, interest in politics and government, and perceptions of out-party extremity.
Background and expectations
Normative arguments in favor of nonpartisan local elections are rooted in Progressive-era reforms when activists were concerned about the corrosive effects of party machines on city administration. These progressive reformers maintained that local government is best served when political parties are absent from the process. A necessary but perhaps not sufficient reform to achieve that goal was to remove parties from the electoral equation (Keller, 2002; McGrath, 2011).
In contrast, proponents of partisan elections argue that party labels help voters translate their values and preferred sets of policies into electoral outcomes. Where reformers see partisan elections as adding party politics to apolitical administration of local governments, partisan proponents see governing bodies that make political decisions and thus argue that parties are useful in organizing the electorate. 4 Where reformers see party labels as providing a crutch to uninformed voters, partisan proponents see a meaningful cue that lowers the cost of voting and reduces the possibility of voters using other cues, such as ethnicity or incumbency (National League of Cities, 2018). Despite a growing trend of Americans declining to identify with either of the two major parties, the majority of self-identified independents consistently vote for candidates of one party over another, lending credence to the argument that party labels provide useful information to voters (Pew Research Center, 2019).
These normative arguments—either critiquing or supporting nonpartisan elections—make good talking points for state legislators who sponsor bills to change local elections from nonpartisan to partisan (or vice-versa). These proposals range from broad, sweeping reforms such as North Carolina’s 2015 HB 324, which attempted to make all county school boards in the state hold partisan elections, to hyper-specific legislation such as a 2014 Georgia bill (H 800) that mandated one type of office (judge probate) in a single county (Lanier) be elected in partisan fashion. All the state legislation (2010–2019) that proposed switching local elections to partisan ballots were sponsored by Republican legislators, while the vast majority of bills written to change local elections to nonpartisan were sponsored by Democratic legislators. 5
There is some research that provides a sense of why political elites would want to switch from nonpartisan to partisan elections (or vice-versa). Schaffner et al. (2007) showed that in local elections, political minorities benefit from nonpartisan ballots. Simply put, majority-party candidates benefit from having their affiliation listed on the ballot, allowing for their co-partisan voters, who constitute an electoral majority, to identify them (particularly advantageous in low-salient elections).
To date there has been relatively little empirical data that reveals what the public thinks about these questions, a notable exception being Alvarez et al. (2005), who show that a nonpartisan elected board is the most-preferred local election authority in a nationwide survey of citizens.
There is evidence that local partisan context affects opinions on both public policy and preferences for types of government. County-level partisanship is related to inter-party and intra-party variation in public opinion about the Green New Deal and Black Lives Matter (Li et al., 2020). And while not completely analogous to the partisan-nonpartisan distinction in the context of local U.S. politics, Ferrin and Hernandez (2021) used survey data from 24 European countries to show that preferences for consensus-style government were related to political minority status, with those in the minority more likely to prefer consensus-style government.
Specifically, these results lend support for a hypothesis that individuals who perceive themselves to be in the political minority will be more supportive of electoral systems that limit the ability of the majority to gain power, or wield it once they do. These findings establish my expectations for a relatively conservative test of the effect of political minority status on election mode preferences: I expect respondents to be less supportive of nonpartisan elections when they live in counties where they are the partisan majority. Conversely, I expect respondents to be more supportive of nonpartisan elections when they live in counties where they are the partisan minority.
Data and methods
The foundation for my data comes from the 2018 and 2020 CES (Ansolabehere and Schaffner, 2019, 2021). For the dependent variable, I use an item that was part of a battery of questions presented to two separate N=1000-person modules within the CES, resulting in 2000 respondents from the pooled 2018 and 2020 surveys. This battery was designed to measure public attitudes about election administration and included, for the first time in a nationally-representative survey, a question that asked respondents about the types of selection methods they preferred for multiple local offices. Respondents were asked whether they preferred nonpartisan elections, partisan elections, or an appointment system for each of the following: school boards, local election officials, sheriffs, district attorneys, city council, state legislature, and the U.S. House of Representatives.
In this paper, I focus on four of these local offices—school board, local election official, sheriff, and district attorney—as well as the U.S. House of Representatives. 6 An important caveat is that respondents were not asked to select between only “partisan,” “nonpartisan,” and “appointed”—they were also given the options of “I’m not sure” and “I don’t think it matters.” Therefore, the probability of respondents choosing “nonpartisan” is not necessarily the inverse of the probability of choosing “partisan.” The analysis I present here treats the dependent variable as a binary indicator where choosing “nonpartisan election” = 1 and any other response = 0. Descriptive data that includes “appointed” responses and additional analyses where choosing “partisan election” (or not) is treated as the dependent variable are available in the online appendix (Supplemental Figures A1–A3). Those results do not change, but rather largely support the inferences drawn from the main analysis.
The central hypothesis I test is that individual party ID interacts with county partisanship and correlates with preferences for nonpartisan local elections. I coded counties based on the two-party vote share from the 2016 presidential election. A county that saw 65% or greater for the Democratic (Republican) candidate was coded as a “solid Democrat” (“solid Republican) county. Counties where the two-party vote share fell between 50 and 65% were coded as “lean.” The cell sizes ranged from a minimum of 83 Republicans living in “solid Democrat” counties to a maximum of 328 Democrats living in “lean Democrat” counties. To facilitate an initial test of whether individual party ID interacts with county partisanship, I create an indicator of individual “political minority” status, where each respondent is coded “1” if they are a Democrat (Republican) living in a county where the majority voted for the Republican (Democrat) presidential candidate in 2016. A full table showing the number of respondents by party ID and county partisanship is available in the online appendix (Supplemental Table A2).
Control variables
A benefit of the CES is that in addition to the specific battery of questions asked in the two modules, respondents also answered a set of common content questions. Several of these items are helpful in ruling out alternative explanations for differential election preferences. It is possible that those who believe they are sufficiently informed about politics and government—either because of their own educational attainment or their interest in government and politics—do not see a benefit to making elections partisan. In other words, election-mode preference may have less to do with party ID or partisan geography and more to do with a true preference for nonpartisan elections, bolstered by an interest in current affairs. To account for this possibility, I include an ordinal measure of news interest in politics and government as well as educational attainment. 7
A primary critique of nonpartisan elections is they deny valuable information to voters—specifically the party label—that is particularly helpful in the often low-information environment of local races. Respondents who view candidates from the out-party as especially extreme might be more supportive of partisan elections so they may avoid the “mistake” of voting for a candidate from the opposite party. An ideal control for this alternative explanation would be a measure of affective polarization, or the extent to which respondents have negative views about the out-party. Unfortunately, there is no suitable measure for this in the 2018 or 2020 common content. As an alternative, I constructed a dichotomous measure of “perceived extremity,” where a Democratic (Republican) respondent is coded 1 if they perceive the Republican (Democrat) party as “extremely” conservative (liberal) on a 7-point scale of ideology and 0 otherwise. While limited, this measure provides some purchase on the extent to which a self-identified partisan perceives the other party as being extreme in their ideology, possibly increasing the cost associated with mistakenly voting for the “wrong” candidate in a nonpartisan setting.
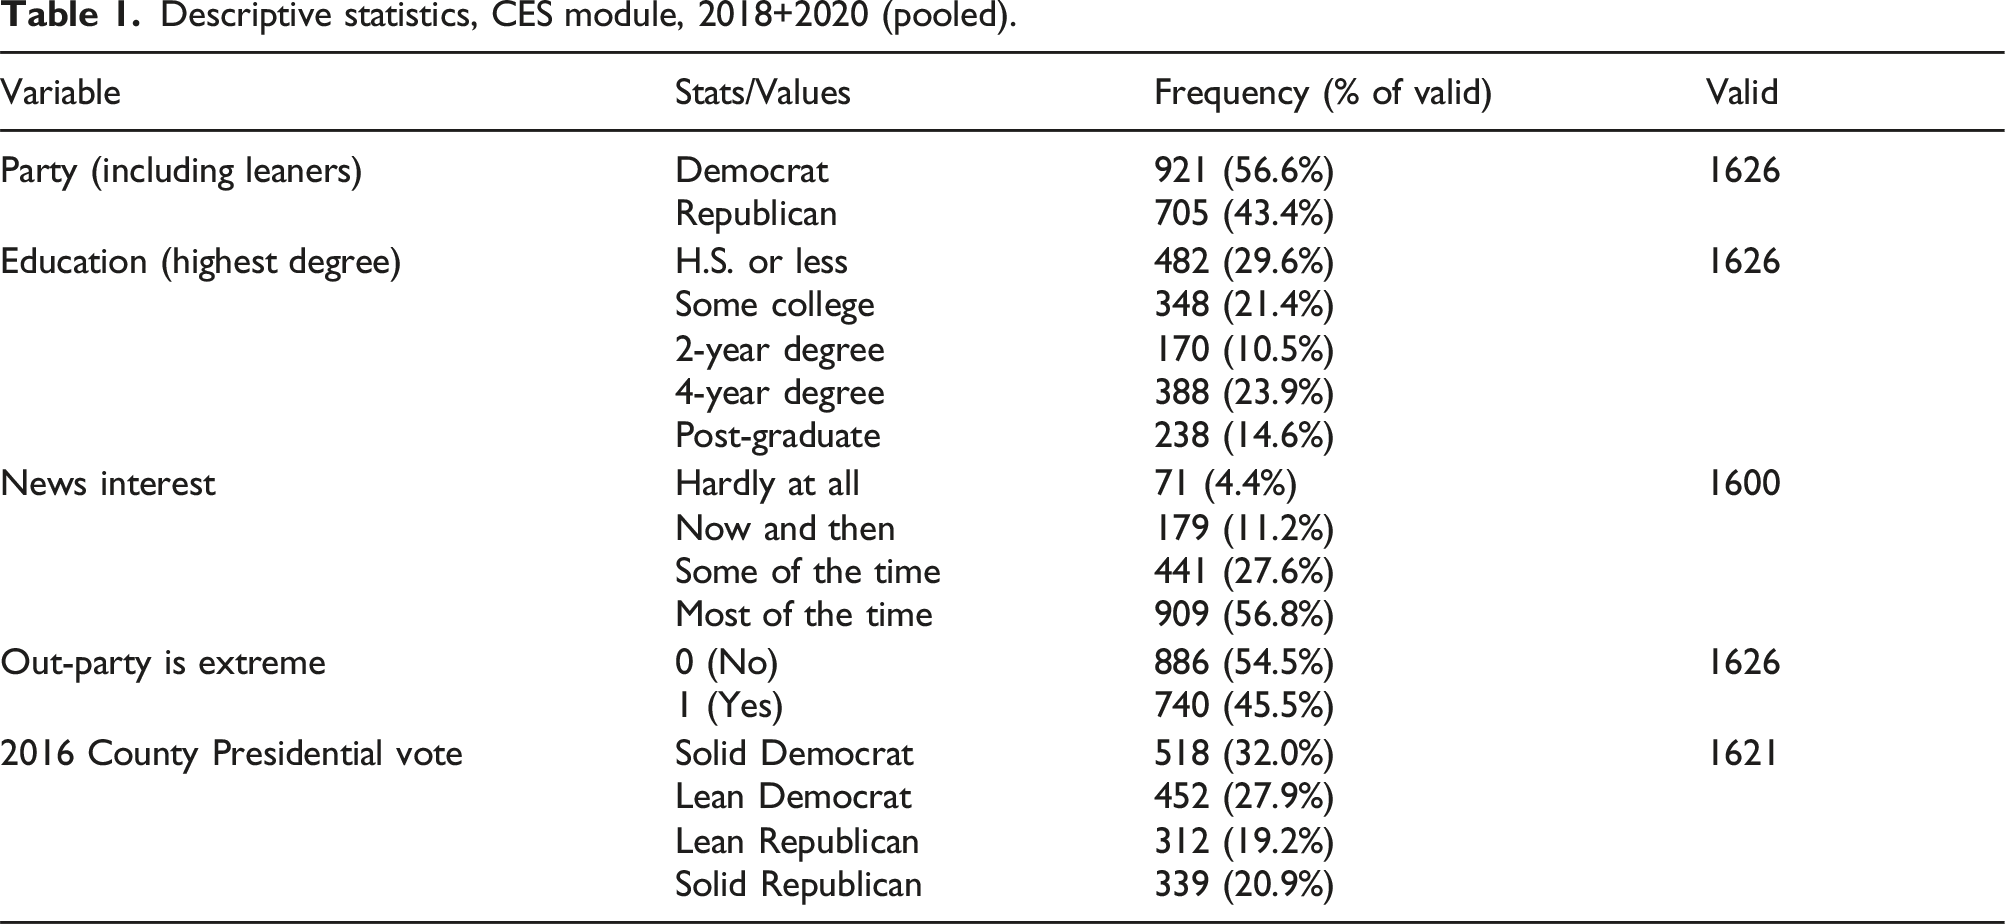
Descriptive statistics, CES module, 2018+2020 (pooled).
Results
The modal choice for each local office was “nonpartisan election,” while “partisan elections” was the modal choice for U.S. House of Representatives. School boards received the greatest support for nonpartisan elections (57%), and local election official was the local office that received the least support for nonpartisan elections (46%). Democrats were more likely to prefer nonpartisan elections than Republicans for each office (Figure 1). Looking at “partisan elections” as the dependent variable, Republicans were more likely to prefer them for each office (Figure 2). Proportion of Democrats and Republicans choosing “nonpartisan election”. Proportion of Democrats and Republicans choosing “partisan election”.

When comparing levels of support for nonpartisan elections, there is initial evidence of an interaction between party ID and county partisanship (Figure 3). Chi-square tests of models where choosing nonpartisan elections is a function of party ID, county partisanship, and their interaction show that the interaction term is significant in models for school board ( Inter-party differences in choosing “nonpartisan election,” by county partisanship.
Effect of political minority status on preference for nonpartisan local elections (pooled model for all local offices).

* p<0.05 ** p<0.01 *** p<0.001.
Effect of political minority status on preference for nonpartisan elections, stratified by office.
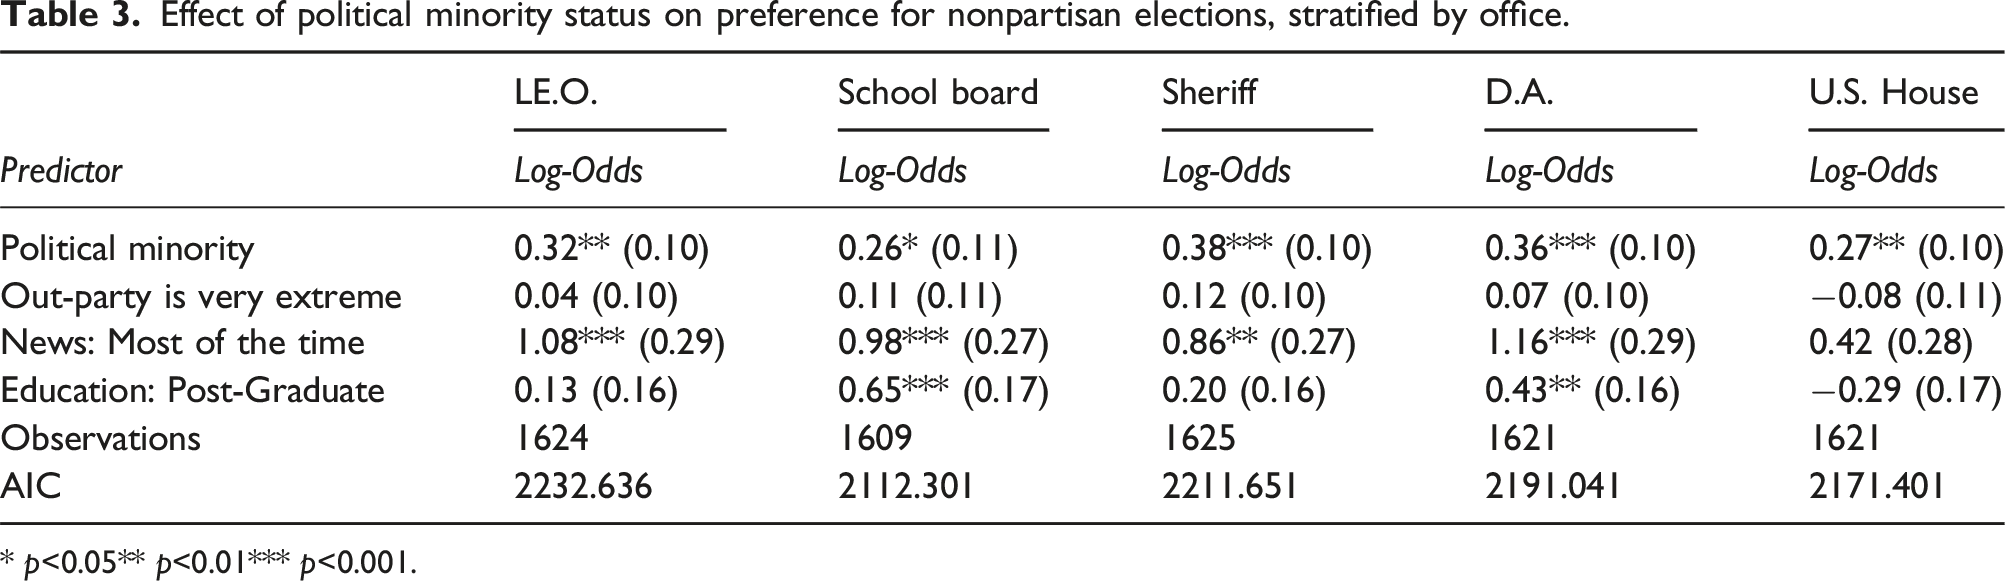
* p<0.05** p<0.01*** p<0.001.
To explore whether the effect of political minority status is consistent across jurisdictions, I generated predicted probabilities of choosing nonpartisan elections, grouping respondents by party ID and the partisanship of the county they reside. Figure 4 shows the effect of party ID on the predicted probability of choosing nonpartisan elections, conditional on county partisanship. In Democratic counties, Republicans are significantly less likely to choose nonpartisan elections only for local election official (in “solid Democrat” counties) and school board (in “lean Democrat” counties). In contrast, in Republican counties—both “lean” and “solid”—Republicans are significantly less likely to choose nonpartisan elections for every office. Inter-party differences in predicted probability of choosing nonpartisan elections. Note: Point estimates reflect change in predicted probability when party ID shifts from Democrat to Republican. Negative values indicate that Republicans are less likely than Democrats to choose nonpartisan elections. Full results of the logistic regression models, with controls, that generate these marginal effects are available in the online appendix (Supplemental Table A7).
While it is curious that a partisan gap only emerges in Republican-majority counties, there is a reason to believe that there is a true null result here. First, if whatever partisan gaps exist is being driven by intra-party differences from only one party, then it is not unexpected that we would only see a significant partisan gap emerge in one set of party-majority counties and not the other. Second, when the dependent variable is switched to choosing partisan elections, the effects of party ID remain—there is no significant difference between Democrats and Republicans in Democratic-majority counties, but there is evidence of a significant partisan gap in Republican-majority counties (see, Supplemental Figure A3, for “partisan election” as the dependent variable).
Intra-party differences
Is the political minority explanation applicable to both Democrats and Republicans or are these results asymmetrical? I take a step toward answering this question by testing whether county partisanship is also a factor in intra-party differences. Are Democrats who live in Republican-leaning counties, and thus a political minority, significantly different than Democrats living in Democratic-leaning counties? I replicated the full models from Table 3, this time stratifying the sample by party ID and including county partisanship as the key explanatory variable. Democrats in “solid Republican” counties are significantly more likely to want nonpartisan elections for both sheriff (p < 0.001) and school boards (p < 0.05) compared to Democrats living in “solid Democratic” counties. Conversely, Republicans living in “solid Republican” counties are significantly less likely to choose nonpartisan elections for school boards (p < 0.01) compared to Republicans living in “solid Democratic” counties. For illustrative purposes, I plot the average marginal effect of moving from the lowest (reference) to highest level of county partisanship and each of the control variables on support for nonpartisan elections (Figure 5). Intra-party differences in predicted probability of choosing nonpartisan elections. Note: Point estimates show the average marginal effect on predicted probability of choosing nonpartisan elections, moving from the reference-level to the highest-level category for each ordinal variable. Reference levels are County: Solid Democrat; News: Hardly at all; Education: H.S. or less; Out-party is extreme=0.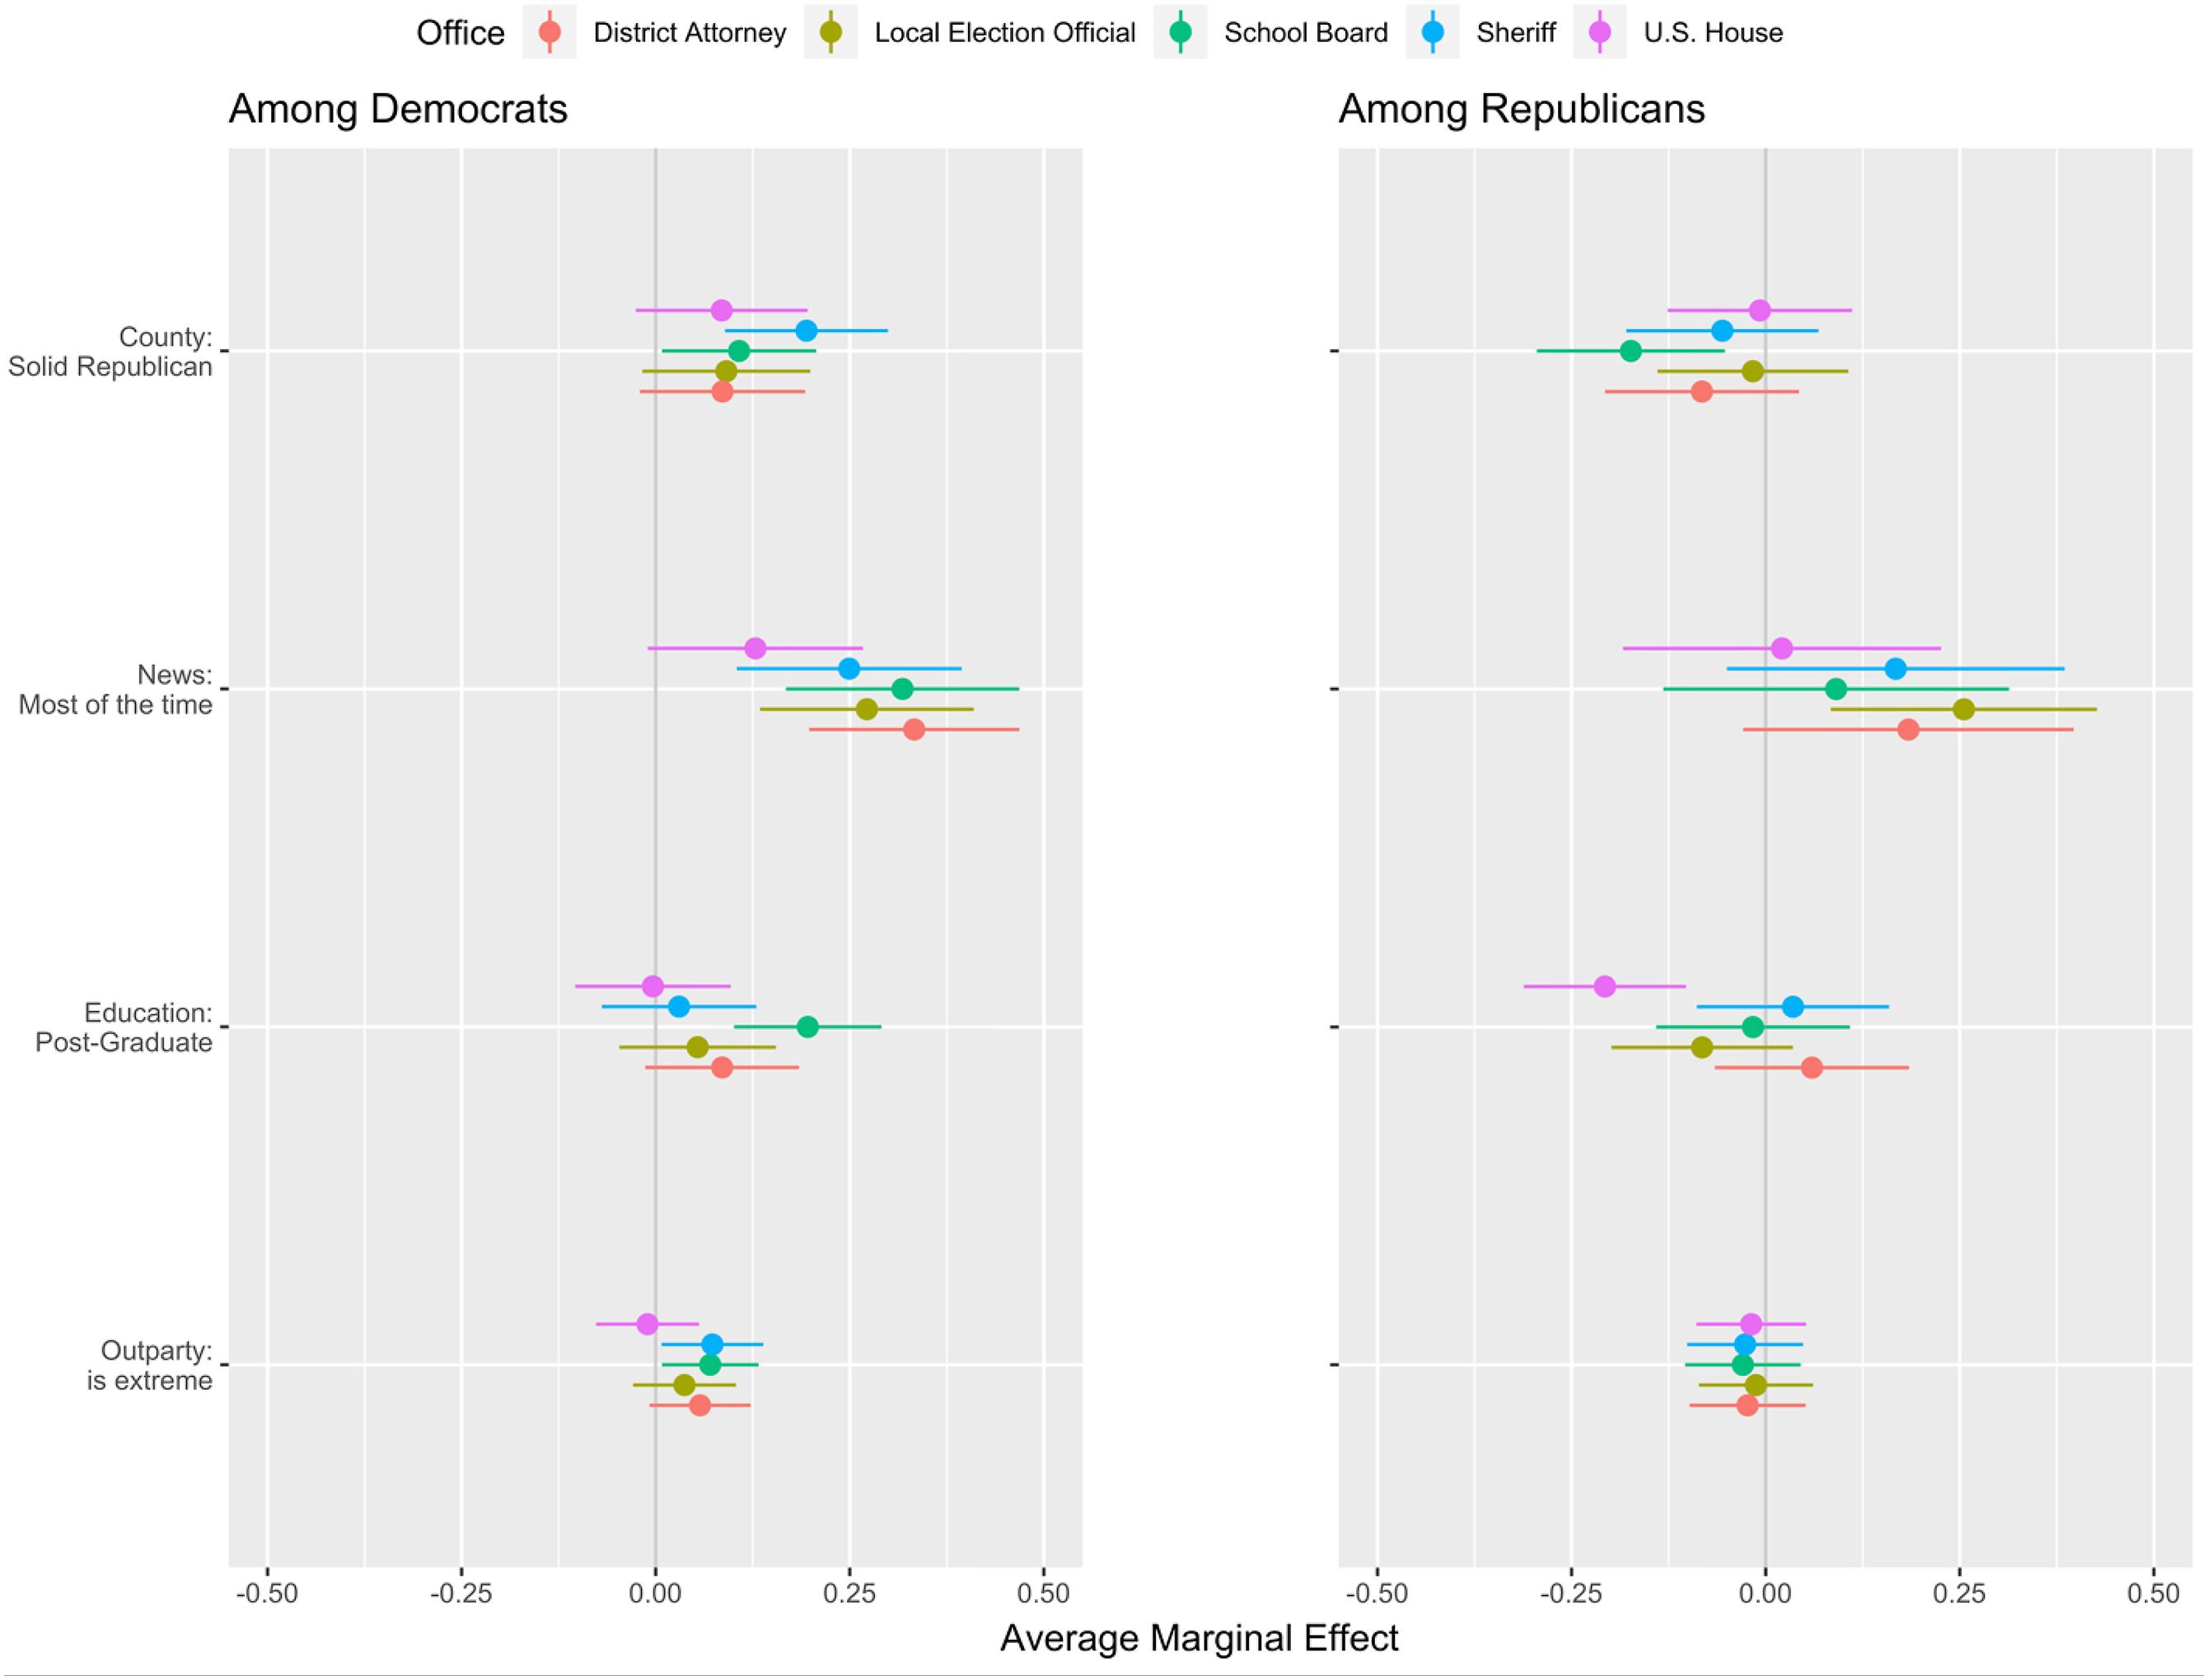
Generally speaking, level of support for nonpartisan elections among Republicans is relatively unaffected by each of the control variables. Intra-party variation was more prevalent among Democrats. Interest in news about politics and government was significantly and positively related to support for nonpartisan elections for each office. Democrats who view Republicans as “extremely conservative” were more likely to prefer nonpartisan elections for school board and sheriff, and education was significantly and positively related to support for nonpartisan elections for school board. 9
Alternative explanations
Two of the offices—sheriff and district attorney—are selected by partisan ballot in 42 states. School boards are elected by nonpartisan ballot in 44 states, partisan ballots in four states, and vary within the state in two others. The fourth local office examined—local election official—also varies in this regard, although the exact breakdown is not as clear. 10 To test for familiarity bias, I grouped respondents by the selection methods for school board, sheriff, and district attorney in their state of residence. There is no significant difference in the proportion who favor nonpartisan elections whether they live in states with nonpartisan elections or not. 11
To rule out the possibility that respondents giving uniform answers for each office might drive results, I calculated the proportion of respondents who selected partisan elections for each office, nonpartisan elections for each office, and nonpartisan elections for each local office (Supplemental Table A4). Looking just at preference for local offices, 31% of respondents chose nonpartisan for each while 12.7% chose partisan for each. Combined, this indicates that 43.7% of the sample chose either partisan or nonpartisan for each local office, while 56.3% did not provide uniform answers for each local office. This suggests that respondents do make distinctions across local-office type, and at the same time does not discount the possibility that respondents who chose partisan or nonpartisan for each office are sincere in those views.
An additional check on the viability of county partisanship as a factor in support for nonpartisan elections, as opposed to merely an artifact of partisan differences about local government, can be seen by looking at the results for U.S. House of Representatives—a partisan contest no matter what state or county a respondent resides. As a reminder, a plurality of respondents preferred partisan elections for U.S. House (45%), while only 38% supported nonpartisan elections. That the public expresses differential support for election-type conditional on whether they are asked about local or federal elections may not be surprising, but this is the first nationally representative sample to provide such a finding. 12
I examined respondent answers to the question about the U.S. House in two ways, the first being the results displayed in Table 3, where local partisanship was measured using county-level presidential vote-share. The benefit to this method is that all respondents are matched to a county. The cost is that congressional districts and counties do not neatly overlap. For example, a respondent might live in a very Democratic congressional district that is subset of a very Republican county, making it difficult to draw inferences. To account for this, I performed a second analysis (Supplemental Table A6) where I match respondents’ congressional district of residence in the 116th Congress to the 2016 presidential vote-share in that congressional district. I find that whether county or congressional district measures of partisanship are used the results remain the same. Party ID does not have a significant effect on support for nonpartisan elections in Democratic locales, while it remains a significant negative predictor of support in Republican-majority jurisdictions.
Conclusion
Local elections are being increasingly nationalized, with respect to both issue-orientation and fundraising (Warshaw, 2019; Reckhow et al., 2017). At the same time, the vast majority of local officials are elected unlike those who run for state and federal office. Part of the aim of this paper is to set the stage for future research about the extent to which the public differentiates between local government offices, and in this case, how they should be elected.
Using a novel dataset based on modules in the 2018 and 2020 CES, I show that the public generally prefers nonpartisan elections for local office, but this preference is by no means overwhelming. Of the four local offices queried, nonpartisan elections earned majority support only for school boards. Inter-party differences were significant for all offices among respondents living in Republican-majority counties. Just why Democrats are overall more supportive of nonpartisan elections than Republicans and that this difference is driven by respondents in Republican-majority counties is a puzzle beyond the scope of this paper. Perhaps the relatively favorable view of nonpartisan elections is a legacy that has carried over from progressive reformers to contemporary Democrats and is exasperated when those Democrats find themselves to be a political minority, whereas the same dynamic does not apply to Republican voters regardless of where they live.
Significant intra-party differences were detected among Democrats with respect to school boards and sheriffs, and among Republicans for school boards. School boards were therefore the only office for which county partisanship had a significant effect on both Democrats and Republicans.
Evidence that school boards may be particularly polarizing may not be all that surprising. Research questions about school boards as partisan actors are increasingly being asked by political scientists (Kogan et al., 2018; Crawford 2018). In addition, the politicization of sheriffs’ offices has also started to garner attention (Farris and Holman, 2018; Thompson 2020). The 2018 and 2020 CES were conducted prior to the 2020 presidential election, and it is possible that public opinion about how local election officials are chosen will take a sharp turn in the wake of state legislation allowing states to exert greater control over local election authorities and the rhetoric surrounding false claims of voter fraud (Izaguirre, 2021).
If party labels are viewed as important and valuable cues to make the “correct” voting decision, then there is little reason to expect that value to change based on what office is being elected. While the analysis in this paper provides evidence that voters differentiate their election preferences between local offices, there are limitations to this study. The data do not enable any inferences as to why voters prefer nonpartisan or partisan elections. In addition, it is entirely possible that public opinion about election administration in the near future will depart from these findings if state legislatures continue to take action and local election processes gain even greater salience. A second possible limitation of this study is that its generalizability may be restricted to the U.S. context, as nonpartisan elections mostly an artifact of local elections in the United States. However, if local political minority/majority status matters for how voters want to select their local officials, and that motivation is partially a result of expected electoral success, then these findings fit firmly within scholarship on how being a political minority correlates with public opinion and governmental systems writ large, including in the international context (see: Ferrin and Hernandez, 2021).
Lastly, it also cannot be assumed what comes to mind when respondents are asked about nonpartisan elections. For example, perhaps when voters are asked whether elections for school board should be nonpartisan, their focus shifts to the job of being a school board member, and a belief that the job should be nonpartisan inherently means the selection method should also be that way. In other words, it remains unknown to what extent the public views the actual job of different local offices as inherently partisan, and whether this belief is related to preferences about nonpartisan elections.
Supplemental Material
sj-pdf-1-rap-10.1177_20531680221083802 – Supplemental Material for Who prefers nonpartisan elections? The role of individual party ID and county partisanship
Supplemental Material, sj-pdf-1-rap-10.1177_20531680221083802 for Who prefers nonpartisan elections? The role of individual party ID and county partisanship by Evan Crawford in Research & Politics
Footnotes
Acknowledgments
Thanks to Reed College the Early Voting Information Center (EVIC) for access to their CES module. Thanks to Paul Gronke, Lisa Bryant, Lonna Atkeson, David Kimball, and Charles Stewart for helpful comments on early versions of this paper.
Declaration of conflicting interests
The author(s) declared no potential conflicts of interest with respect to the research, authorship, and/or publication of this article.
Funding
The author(s) received no financial support for the research, authorship, and/or publication of this article.
Correction (April 2025):
Supplemental material
Notes
References
Supplementary Material
Please find the following supplemental material available below.
For Open Access articles published under a Creative Commons License, all supplemental material carries the same license as the article it is associated with.
For non-Open Access articles published, all supplemental material carries a non-exclusive license, and permission requests for re-use of supplemental material or any part of supplemental material shall be sent directly to the copyright owner as specified in the copyright notice associated with the article.