
Abstract
Research in political science and other social sciences often relies on survey data to study a range of questions about politics in the developing world. This study identifies systematic measurement error in some of the most frequently used datasets with respect to one commonly employed variable: respondent’s age. It shows evidence of substantial measurement error that is correlated with observable characteristics, and discusses and illustrates the implications for empirical analysis with an example from a recently published study. In doing so, it demonstrates tools for identifying and diagnosing systematic measurement error in survey data, as well as for investigating the robustness of one’s findings when the problem arises.
Introduction
Research in political science often relies on survey data to study a wide range of questions about politics and development in the developing world. Many important insights have been drawn from efforts to collect comparable cross-national data on health, education, demographics, economics, and public opinion such as the Demographic and Health Surveys (DHS) and the regional “Barometer” surveys (Afrobarometer, Asian Barometer, and Latinobarómetro). 1 While research in several disciplines has analyzed the problem of measurement error in survey measures of variables such as earnings, assets, and expenditures (Bound et al., 2001), less attention has been paid to error in the measurement of seemingly more trivial variables that nonetheless play an important role in many studies, or to the conditions that make collecting such data particularly challenging in less developed states. One example is respondents’ age, which is often included as a covariate in analysts’ models and sometimes plays a central role in their research design, such as in cohort studies that rely on age as an indicator of exposure to a given treatment (e.g. Croke et al., 2016; De Kadt, 2017; Franck and Rainer, 2012; Grossman et al., 2017; Harding and Stasavage, 2013). In both cases, systematic measurement error with respect to age can cause serious bias in the estimation of quantities of interest, leading researchers to fail to uncover a true effect, to find effects where none exist, or to estimate effects that are opposite in sign from the true relationship (Bound et al., 2001: 3709).
I show that respondent age is measured with systematic error on some of the most widely used surveys of developing country populations. Specifically, I demonstrate consistent evidence of clustering on ages with final digits of zero and five that is too extreme to be attributed to random error, a phenomenon known as “heaping” that results from digit preference when one’s true age is unknown (Lee and Zhang, 2017; Nagi et al., 1973). Furthermore, this clustering is correlated with a number of individual-level characteristics that we might expect to be associated with respondents’ ability or incentive to provide accurate information about their age.
With these insights in mind, I examine and reanalyze the data in De Kadt (2017), which provides an instructive example of how to identify whether this problem exists in one’s data, as well as the consequences of it when it does. This analysis shows that measurement error with respect to age is not always present in developing country surveys, but that when present can affect the estimation results.
In short, this study highlights an important example of systematic measurement error in surveys widely used in political science research, and demonstrates its consequences for the inferences we make. More constructively, it illustrates tools that scholars may use to determine whether this problem afflicts their own data, and to evaluate the robustness of their results when it does.
Age is measured with systematic error in developing country surveys
Some portion of citizens in developing countries, particularly in places with the weakest state capacity, are likely not to know their exact age. This may be due to a lack of documentation—such as birth certificates and national identification cards—that allows individuals to recall and track their ages as they grow older, and/or a lack of incentives to learn and retain the information, which may only be relevant when seeking to access certain government services or the formal labor market (A’Hearn et al., 2009; Lee and Zhang, 2017). As a result, countries where a significant portion of the population has limited interaction with formal institutions—a more common situation in poorer countries, where such institutions tend to be weaker—may maintain a sizable population of citizens who lack age awareness and are therefore unable to provide their precise age to enumerators if asked. In such contexts, survey measures of age will be subject to error.
Unlike other indicators that may be measured with error, however, there exists an effective, straightforward way of validating survey measures of age, one that relies on the tendency of humans to favor certain digits over others. Specifically, demographers have identified the phenomenon of age “heaping,” whereby individuals who do not know their precise age are more likely to provide numbers that end in certain digits, most often zero (most preferred) and five (Nagi et al., 1973). 2 This tendency is useful because if age data is accurate, then the distribution of final digits should be uniform, after accounting for greater mortality as individuals grow older (Myers, 1940). Significant deviations from this uniformity—particularly those consistent with digit preference—are thus reliable evidence of measurement error with respect to age.
Age measures cluster on final digits of zero and five
I diagnose the extent of measurement error in two of the most widely used cross-national surveys in political science—the DHS and Afrobarometer—by analyzing the distribution of final digits in reported age data. 3 For the DHS, I analyze data from 11,088,142 individuals on 108 surveys in 26 countries across in Africa and South Asia. For Afrobarometer, I focus on the most recent Round 6, which was conducted with 53,935 individuals in 36 countries in Africa. 4 As a benchmark, I conduct the same analysis on data from the 2016 American National Elections Studies (ANES) survey and the 2018 General Social Survey (GSS), two prominent surveys of the American mass public.
Figure 1 shows the results graphically; while the distributions of final digits in ANES and GSS age data are approximately uniform, there is massive heaping on zero and five in the DHS data, with significant heaping in the Afrobarometer data as well. 5 The Myers Index—a summary measure of age heaping ranging from 0 to 90 that takes into account the effect of mortality (Myers, 1940)—yields a score of 8.3 for the Afrobarometer and 14.2 for the DHS data, as opposed to 6.1 and 4.3 for the ANES and GSS data, respectively. These results are consistent with what we would expect to find if sizable numbers of respondents on the DHS and Afrobarometer surveys were not providing accurate age data, but rather estimates that conform to well-known preferences over digits. They are also consistent with previous analyses of DHS data, specifically (Johnson et al., 2009; Lyons-Amos and Stones, 2017; Pullum, 2006).

Distribution of final digits in reported age: Demographic and Health Surveys (DHS), Afrobarometer, American National Elections Studies (ANES), and General Social Survey (GSS).
Age measurement error is correlated with observable characteristics
While there is clear evidence of measurement error with respect to age in these surveys, we should be most concerned if the error is systematic, rather than randomly distributed across the sampled populations. A lack of age awareness is unlikely to be random, however, so there is good a priori reason to believe that this error is systematic. I explore this possibility using DHS data by analyzing whether the prevalence of zero and five as final digits in reported age—our proxy for measurement error—is associated with a number of observable characteristics that we might expect to be related to individuals’ ability or incentive to know their precise age. These include respondents’ age, wealth, gender, urban/rural status, years of education, and whether or not they possess a birth certificate. 6
Consistent with the idea that age heaping resulting from a lack of age awareness is associated with limited interaction with the state (and perhaps other formal institutions) (A’Hearn et al., 2009; Lee and Zhang, 2017; Nagi et al., 1973), I find correlations of the expected sign with each characteristic analyzed. 7 Table 1—which shows mean values and differences on each characteristic for those with reported ages ending in zero and five versus other digits—demonstrates that an individual is more likely to report an age ending in zero or five if they are rural, male, poorer, older, less educated, and do not possess a birth certificate. 8 While the difference in means is significant for all variables—at least in part due to the large sample size—the differences in age, the possession of a birth certificate, and to some extent level of education are particularly meaningful in magnitude. While 34% of individuals reporting an age not ending in zero or five possessed a birth certificate, only 25.1% of those reporting an age ending in zero or five did, more than a third less. Those reporting an age ending in zero or five are seven years older, on average, than those reporting an age ending in other digits, representing a move from the 66th to 55th percentile in overall age; they also have about half a year less education. These results demonstrate a clear logic to the measurement error in these surveys, indicating that it is indeed systematic. It is therefore likely to pose problems for empirical analysis that relies on these measures for estimation.
Means, difference in means, and percent difference between respondents with reported age ending in zero or five and those ending in other digits, Demographic and Health Surveys (DHS).
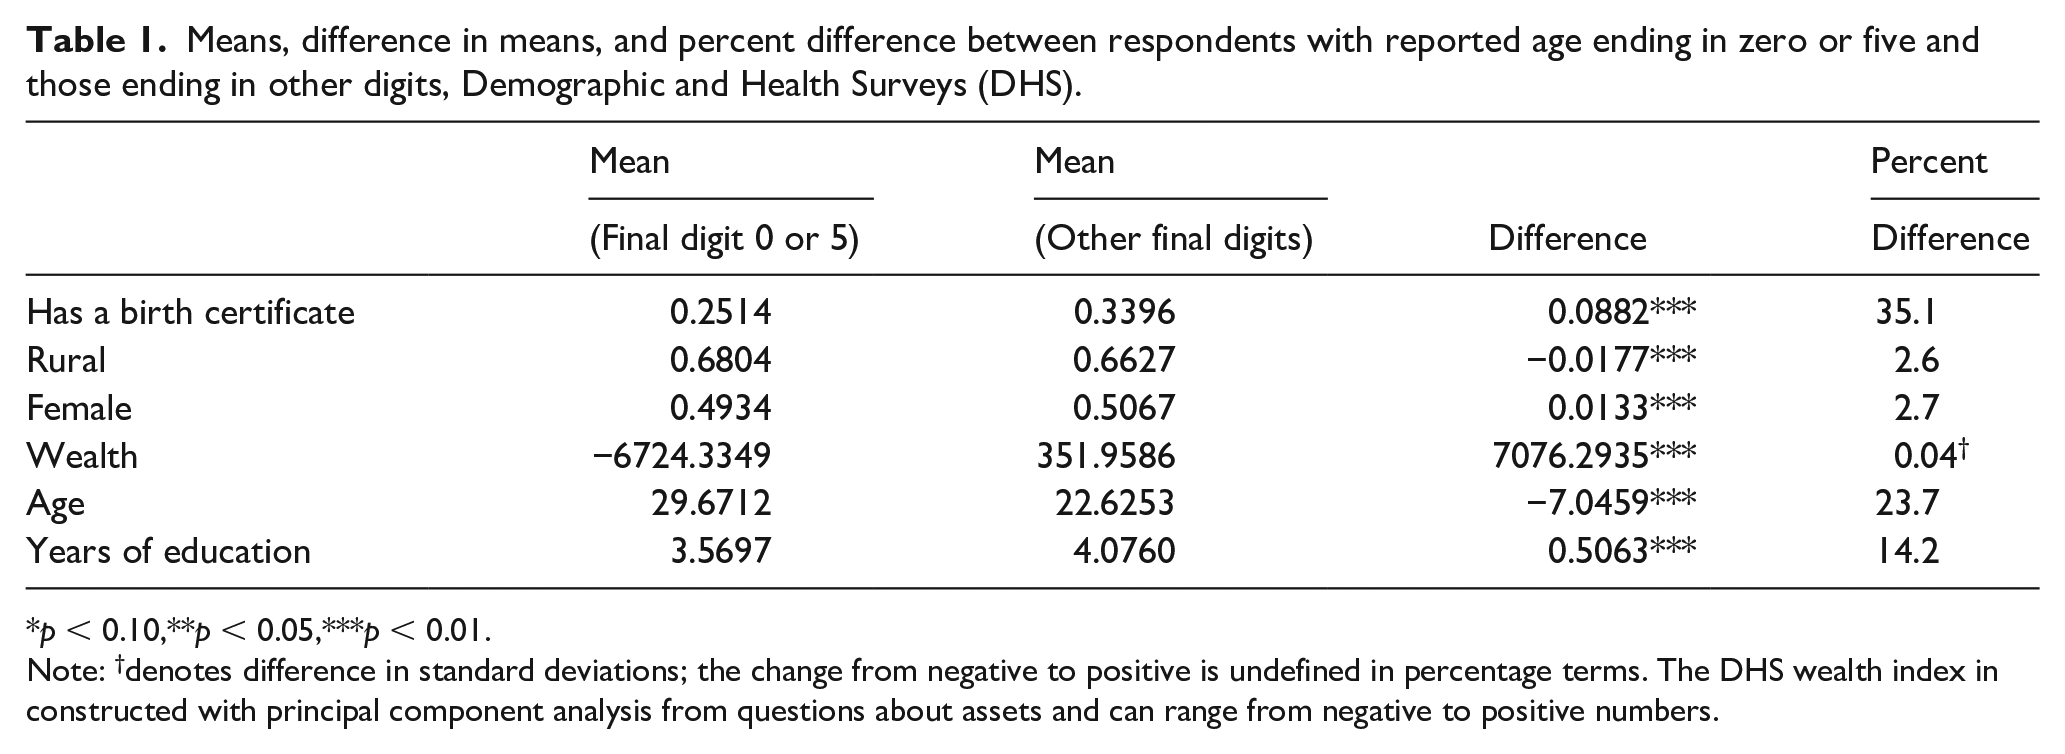
p < 0.10,**p < 0.05,***p < 0.01.
Note: †denotes difference in standard deviations; the change from negative to positive is undefined in percentage terms. The DHS wealth index in constructed with principal component analysis from questions about assets and can range from negative to positive numbers.
In addition to analyzing the individual-level correlates of age measurement error, it may be useful to understand the factors associated with it at the country level; in particular, such information may help analysts identify survey data they may be interested in using for their research that are likely to suffer from this problem. Table 2, which summarizes the results of an analysis at the country-survey year level, shows that countries with an older and less educated population have significantly more respondents reporting an age ending in zero or five; the percentage of the population with a birth certificate or living in a rural area and a country’s wealth are not significantly associated with this outcome. 9 The estimates imply that moving from a country average age of 21.4 (at the 25th percentile) to an average age of 23 (at the 75th percentile) is associated with a sizeable two percentage point (0.5 standard deviations) increase in the proportion of reported ages ending in zero or five. Similarly, for years of education, moving from the 25th to 75th percentile in average education level (2.2 to 3.9 years) is associated with a 3.5 percentage point (0.87 standard deviations) decrease in the proportion of reported ages ending in zero or five. Average age and level of education thus seem particularly predictive of age measurement error at the country level.
Country-level correlates of age measurement error, Demographic and Health Surveys (DHS).

Standard errors in parentheses.
p < 0.10,**p < 0.05,***p < 0.01.
Application and implications
Systematic measurement error in age data creates significant problems for research that relies on it. In this section, I summarize the general implications, then turn to a specific example of the consequences for empirical analysis.
General implications
Age is rarely analyzed as an explanatory variable of interest in and of itself, yet it is often included as a covariate in multiple regression models, as well as used to construct treatment indicators in cohort studies in which treatment status (e.g. exposure to a policy or event) is determined by age. In both cases, measurement error can wreak havoc on estimates of the quantities of interest.
Attenuation bias is a well-known and oft-discussed consequence of measurement error, and there are methods that have been developed to deal with it when certain assumptions are met. But certainty about the direction of the bias (downward) and the fixes that have been developed to deal with it (e.g. instrumental variables estimation) only apply when the error is classical, not systematic. Outside of this special case—which does not describe the error identified here—measurement error may bias estimates in any direction, and it is not possible to know in advance which direction it will be (Bound et al., 2001). Furthermore, including a mismeasured variable in a multiple regression model can bias estimates of coefficients on even the accurately measured variables in the model (Bound et al., 2001: 3713); thus, analyses that include age as a covariate risk bias in their estimates of the explanatory variable(s) of interest.
Cohort studies that code treatment status according to age may be particularly vulnerable, as the systematic mismeasurement of age is transmitted to the measurement of the treatment. 10 In such cases, the most pernicious effects of measurement error are likely to play out.
An application: reanalysis of De Kadt (2017)
I illustrate the consequences of systematic measurement error with respect to survey measures of age by diagnosing and reanalyzing the data in De Kadt (2017). This study estimates the causal effect of voting in a country’s first multiparty elections on the likelihood of voting in future elections with a regression discontinuity design, comparing voting rates in subsequent elections for individuals who—according to survey data—were just old enough or just too young to be eligible to vote in the first elections. 11 The study argues—and the empirics show—that voting in first elections makes voting more likely in future elections, but only among voters for whom voting was a positive affective experience. The main analysis focuses on the South African case, with additional tests of the theory in Ghana, Kenya, and Tanzania. De Kadt finds, in light of the theory, that Black but not White South Africans are more likely to vote in later elections if they voted in the first multiparty elections. He also finds that Ghanaians who voted in their first multiparty elections were more likely to vote subsequently; that Tanzanians were less likely to; and that voting in Kenya’s first elections had no effect, all consistent with theoretical expectations because the quality of the first elections was best in Ghana, mixed in Kenya, and poorest in Tanzania. I diagnose whether the problem of systematic measurement error manifests in De Kadt’s data and conduct a randomized reclassification exercise to gauge the effect of mismeasurement on the study’s results.
Figure 2 displays the results from an analysis of final digits in reported age as applied to De Kadt’s data from the four countries, demonstrating both the prevalence of the problem and the significant variation in its scale. While the Ghana, Kenya, and Tanzania data all show evidence of sizeable measurement error with respect to age (with the Ghana data being most severe), the South Africa data largely does not; South Africa, Tanzania, Kenya, and Ghana come in at 4.2, 11.4, 10.5, and 14.2 on the Myers Index of heaping, respectively. This variation across countries is important because it demonstrates the value of diagnosing one’s data in this way, since it may or may not reveal a problem. Notably, in this case, the primary dataset (from South Africa) upon which the study’s main results are based is largely unaffected by the type of measurement error discussed here, bolstering their validity; it is in the supplementary analyses of additional cases that the problem arises.

Distribution of final digits in reported age, from De Kadt (2017).
To understand the impact of the identified measurement error in the three problematic countries’ data on the empirical analysis, I conduct a randomized reclassification exercise that assesses the robustness of the empirical results to reclassifying a portion of reported ages ending in zero or five such that the sample contains a more appropriately uniform distribution of digits. The logic of this is that—in the samples with age heaping—some segment of respondents who report an age ending in zero or five are actually somewhat older or younger than reported. Since we don’t know which individuals are misreporting, a reasonable strategy to check the robustness of the results to the observed measurement error is to reclassify a random segment of respondents reporting ages ending in zero and five to the closest adjacent ages not ending in preferred digits in order to approximate a more appropriately uniform age distribution. In other words, if about 16% of Kenyans report an age ending in zero—rather than the 10% that would be expected given valid reporting—then the exercise will randomly reclassify about a third of 20-year olds as 17, 19, 21, or 23, a third of 30-year olds as 27, 29, 31, or 33, etc. 12 To reduce the influence of random noise, I implement a Monte Carlo simulation, repeating the randomized reclassification exercise 1000 times. I then replicate the analysis in De Kadt (2017) across the 1000 datasets of reclassified data and compare the resulting distribution of estimates to the published results. 13
The results of the exercise are shown in Figure 3. They show similar results to those reported in De Kadt (2017) for Tanzania and Kenya (negative effect for the former, no effect for the latter), with a somewhat smaller but still positive effect estimated for Ghana. In fact, the negative effect for Tanzania and the positive effect for Ghana are both significant at the 5% level according to the empirical distributions generated by this exercise, whereas neither reached this level of significance in the original study. Overall, these results (as well as the lack of heaping in the South African data) are consistent with the substantive conclusions in De Kadt (2017), and are actually stronger with respect to statistical significance. Still, they reveal some important differences—whether with respect to the size or significance of the estimates—that demonstrate how systematic measurement error may affect the inferences we make from studies that rely on age as measured in survey data from the developing world. In particular, the results for the Ghana sample move more as a result of the exercise than those for Tanzania and Kenya, which makes sense given that extent of heaping is greater in that data, and serves as a useful validation of the reclassification approach.

Distribution of estimates of the effect of voting in founding elections on turnout in subsequent elections.
Even better than the approach implemented here would be to generate a propensity score for the likelihood that a given individual is misreporting, given the correlates of measurement error discussed above, and weight the likelihood of reclassification by this score. Unfortunately, De Kadt does not employ these variables in his analysis, so the necessary covariates are not included in the study’s replication data. For scholars working with their own datasets, however, the propensity-score approach could be easily implemented, and it would provide an even more convincing test of the robustness of their results to the measurement error described here. 14
Conclusion
This study has identified an important instance of systematic measurement error in widely used surveys in research on the politics of the developing world and demonstrated the consequences for the inferences we make. To guide future work, it illustrates the techniques that scholars may use to determine whether this problem exists in their own data. These diagnostics should be applied whenever researchers employ age measures from developing country surveys so as to avoid the pitfalls of estimates that rely on systematically mismeasured variables. Doing so will allow scholars to avoid problematic research designs, as well as to validate those where the problem is shown not to exist. Where systematic measurement error is identified, researchers may also choose to investigate the robustness of their findings to the reclassification of some proportion of ages ending in preferred digits, a technique demonstrated here. Where data on the individual-level correlates of age heaping is available, the likelihood of reclassification may be weighted by a propensity score derived from these covariates, improving the exercise by ensuring that reclassification is focused on those observations that are most likely to be mismeasured.
The findings also indicate that researchers should be generally cautious when analyzing survey measures meant to capture information that respondents may not know with precision, especially when such knowledge is unlikely to be randomly distributed among the surveyed population. If a measure as seemingly innocuous as age is characterized by systematic error, then we should be especially cautious when employing survey data on variables such as assets, expenditures, or the timing of life events, information that is even more difficult to recall and where the accuracy of responses is likely to be associated with respondent characteristics.
Supplemental Material
sj-pdf-1-rap-10.1177_20531680211044068 – Supplemental material for Age is measured with systematic measurement error in developing country surveys: A diagnosis and analysis of consequences
Supplemental material, sj-pdf-1-rap-10.1177_20531680211044068 for Age is measured with systematic measurement error in developing country surveys: A diagnosis and analysis of consequences by Steven C. Rosenzweig in Research & Politics
Footnotes
Acknowledgements
Many thanks to Dan de Kadt for his feedback on an earlier draft, and to the reviewers and editors for their helpful input. The usual disclaimers apply.
Correction (June 2025):
Declaration of conflicting interests
The author declared no potential conflicts of interest with respect to the research, authorship, and/or publication of this article.
Funding
The author received no financial support for the research, authorship, and/or publication of this article.
Supplementary material
The supplementary files are available at http://journals.sagepub.com/doi/suppl/10.1177/20531680211044068. The replication files are available at: ![]() .
.
Notes
Carnegie Corporation of New York Grant
This publication was made possible (in part) by a grant from the Carnegie Corporation of New York. The statements made and views expressed are solely the responsibility of the author.
References
Supplementary Material
Please find the following supplemental material available below.
For Open Access articles published under a Creative Commons License, all supplemental material carries the same license as the article it is associated with.
For non-Open Access articles published, all supplemental material carries a non-exclusive license, and permission requests for re-use of supplemental material or any part of supplemental material shall be sent directly to the copyright owner as specified in the copyright notice associated with the article.