
Abstract
List experiments are widely used in the social sciences to elicit truthful responses to sensitive questions. Yet, the research design commonly suffers from the problem of measurement error in the form of non-strategic respondent error, where some inattentive participants might provide random responses. This type of error can result in severely biased estimates. A recently proposed solution is the use of a necessarily false placebo item to equalize the length of the treatment and control lists in order to alleviate concerns about respondent error. In this paper we show theoretically that placebo items do not in general eliminate bias caused by non-strategic respondent error. We introduce a new option, the mixed control list, and show how researchers can choose between different control list designs to minimize the problems caused by inattentive respondents. We provide researchers with practical guidance to think carefully about the bias that inattentive respondents might cause in a given application of the list experiment. We also report results from a large novel list experiment fielded to over 4900 respondents, specifically designed to illustrate our theoretical argument and recommendations.
Keywords
Introduction
While list experiments remain popular in the social sciences, several studies have highlighted the problem of measurement error in the form of non-strategic respondent error, where some inattentive subjects might provide random responses to the list (Ahlquist, 2018; Alvarez et al., 2019; Blair et al., 2019; Kramon and Weghorst, 2019). Given that the length of the treatment and control list differs, this type of error can result in heavily biased estimates. To address this issue, a recent study recommends the use of a necessarily false placebo item 1 in order to equalize the length of the treatment and control lists and, in turn, alleviate concerns about respondent error (Riambau and Ostwald, 2020) (see also Ahlquist et al. (2014) and De Jonge and Nickerson (2014)).
In this paper we show that placebo items are not a straightforward universal solution to the problem of non-strategic respondent error in list experiments and that their inclusion can even increase bias in many cases. In general, modifying the length of the control list will not eliminate bias caused by inattentive respondents. However, we show that researchers, by carefully considering the expected bias associated with a specific control list design, can choose a design that minimizes the problems caused by non-strategic respondent error. In addition to the conventional and placebo control list, we introduce a novel third alternative, the mixed control list, that combines the two former designs. We calculate the expected bias associated with each control list design and provide concrete recommendations for researchers for choosing between them in different situations. Using data from a recent meta analysis (Blair et al., 2020), we show that a clear majority of existing studies using list experiments might have benefited from a non-conventional control list design. We also report results from from a large list experiment fielded in China to over 4900 respondents, designed to test our theoretical predictions. The study includes a novel approach to designing placebo items that we recommend researchers to use whenever the inclusion of such an item is warranted. We conclude by discussing the general implications of our results and summarize our overall recommendations for researchers using the list experiment.
Setup
The list experiment works by aggregating a sensitive item of interest with a list of control items to protect respondents’ integrity (Glynn, 2013). We adopt the notation in Blair and Imai (2012) and consider a list experiment with J binary control items and one binary sensitive item denoted
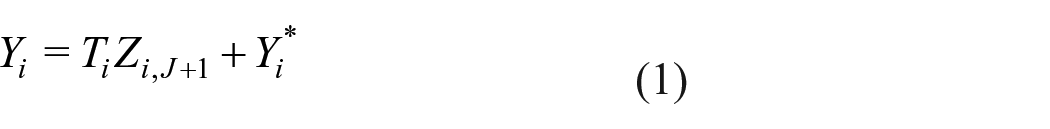
Blair and Imai (2012) show that if we assume that the responses to the sensitive item are truthful (“no liars”) and that the addition of the sensitive item does not alter responses to the control items (“no design effects”), the proportion of affirmative answers to the sensitive item, denoted τ, can be estimated by taking the difference between the average response among the treatment group and the average response among the control group, that is, a difference-in-means (DiM) estimator. The DiM estimator can be written as:

where
Non-strategic respondent error and bias
Modeling inattentive respondents
Strategic respondent error in list experiments, where the respondent for instance might avoid selecting the maximum or minimum number of items, can generally be minimized by choosing control items (non-sensitive items) in a well-thought-out manner (Glynn, 2013). Non-strategic respondent error, on the other hand, arises when respondents provide a random response to the list experiment. This type of respondent error is likely to be prevalent when respondents do not pay enough attention to the survey (Berinsky et al., 2014) or when respondents resort to satisficing (Krosnick, 1991). Given that the list lengths differ between the treatment and control group, this type of error will often be correlated with treatment assignment and can hence dramatically increase both bias and variance in the estimate of interest (Ahlquist, 2018; Blair et al., 2019).
We refer to respondents providing random responses as inattentive
2
and let

The consequences of this error process in terms of bias in the estimate of τ (see below) are identical to several other plausible error processes. We discuss this further in Appendix A.
Let s denote the share of inattentive respondents. As shown by Blair et al. (2019) [appendix A], under the uniform error model, the bias of the difference-in-means estimator (

This follows from the fact that the expected value of a (discrete) uniform distribution is
The amount of bias will hence be larger when τ is further away from
Introducing a placebo item
How is the amount of bias affected by the introduction of a placebo item? When adding a placebo item (with expected value equal to 0) to the control list, the bias under this error model 3 instead becomes:

Hence, without a placebo item the bias will be 0 only when
When does the addition of a placebo item decrease the absolute amount of bias? This happens when
The mixed control list
We also consider a third option for constructing a control list: allocating respondents in the control group to either the placebo or conventional control list. We focus on a design where respondents are allocated to the two groups with

With
Which control list design should you choose?
In summary, adding a placebo item might decrease bias but should not in general be considered a silver bullet solution to the problem of non-strategic respondent error; in many cases it might even increase bias if not implemented carefully. It is clear that this type of bias varies considerably between different designs and that it has the potential to strongly influence the resulting estimate. Unfortunately, the bias caused by inattentive respondents can not be easily eliminated by modifying the control list. However, by making an informed choice regarding the control list design, the problem can be mitigated.
As the sections above show, the bias under the different control list designs – conventional, placebo, and mixed – will depend on τ (when
Which control list design to choose in a specific study depends mainly on two considerations:
If the goal of the study is to estimate the amount of sensitivity bias, we advocate an approach that likely will lead to a conservative estimate. Typically, researchers do not reflect upon how non-strategic respondent error may influence their list experiment estimate. In many cases this bias works in favor of the tested hypothesis: when τ is below 0.5 and the researcher wants to test if the quantity is underreported (when measured with a direct question), a list experiment with a conventional control list will pull the estimate toward 0.5 due to non-strategic respondent error. This may thus inflate the type 1 error rate – e.g., concluding that underreporting is prevalent when it is in fact negligible. Instead, we advocate choosing a control list design where potential bias due to respondent error works against the tested hypothesis. This approach is described in Table 1.
Control lists yielding (mostly) conservative estimates when testing for sensitivity bias.

To illustrate, when
To what extent are our design recommendations relevant for researchers using list experiments? To take the 264 list experiments included in Blair et al.’s (2020) meta analysis as an indication: only 36 percent of the studies have an estimated prevalence and hypothesized sensitivity bias for which the conventional control list is expected to yield the smallest bias granted a preference for a conservative estimate. 5 For 37 percent, the placebo control list would have been recommended. The remaining 27 percent of the list experiments would have benefited from our proposed mixed control list design (see Figure 1). In summary, assuming a non-negligible share of inattentive respondents, the vast majority of existing studies using list experiments have used a sub-optimal control list design, among which we are more likely to find type 1 errors.

Distribution of estimated prevalence by hypothesized sensitivity bias from list experiments included in Blair et al.’s (2020) meta analysis. Recommendations are based on a preference for a conservative estimate (see Table 1).
This concerns some sub-fields more than others. For example, studies of relatively low prevalence behaviors, with a hypothesized underreporting, such as vote buying (Gonzalez-Ocantos et al., 2012), clientelism (Corstange, 2018), and corruption (Agerberg, 2020; Tang, 2016) would often be recommended to choose the placebo or mixed control list in order to guard against type 1 errors. In contrast, studies of voter turnout (Holbrook and Krosnick, 2010) and support in authoritarian regimes (Frye et al., 2017; Robinson and Tannenberg, 2019), where the hypothesized sensitivity bias concerns overreporting, are more often in the predicted prevalence range where the conventional control list is the best choice. It should be noted that several of the latter studies are in a range, (
An empirical illustration
To empirically demonstrate the consequences of the different control list designs we designed a list experiment that was fielded online in China to 4973 respondents, in collaboration with the survey research company Lucid. In the experiment, one-third of respondents were assigned to a conventional control list with four items, another third to a placebo list with the same four control items plus a placebo item, and the remaining third were assigned to a treatment list with the four control items plus an additional “item of interest” (corresponding to the “sensitive item” in regular designs). By sampling from the conventional and the placebo control list with
The four items on the control list were presented in random order and two of the items were chosen to be negatively correlated, following best practice (Glynn, 2013) (see Appendix B, Table 2). The placebo list added a fifth item to match the length of the treatment list. The order of the items was randomized. The placebo item was designed to have a true expected prevalence for each respondent of 0 (see section How to choose good placebo items below for further details).
The treatment group was given the control list plus an additional item of interest. We designed the experiment so that the item of interest had the following three specific properties: (1) the true quantity of the item was known, (2) the item was independent of all items on the control list, (3) the item was independent of all (observed and unobserved) respondent characteristics. Given the focus of our study, we also wanted an item that was not sensitive, to avoid mixing strategic and non-strategic respondent error. We constructed an item of interest that met these criteria by randomly selecting one item from a separate set of items for each individual respondent in the treatment group. This set contained items regarding one’s zodiac animal, for example, “I was born in the year of the Dog or in the year of the Pig.” In China, respondents’ knowledge of their zodiac animal is safe to assume. Each given year is associated with one animal of which there are 12 in total. The specific animal combination presented to each respondent was randomly drawn with uniform probability from a set of 6 different combinations (including all 12 animals) and piped into the treatment list (see Appendix B Table 2 for the 6 zodiac statements). Hence, agreement with the proposed item (τ) was exactly
The design allows us to estimate a known quantity (
How to choose good placebo items: the piped-in approach
Designing a good placebo item is not as easy as it may first appear. Ideally, a placebo item should be plausible for all respondents, yet by design necessarily false for any one given respondent. We propose a novel design for assigning a placebo item that can be implemented in any programmed survey, such as web-administrated or tablet-administrated surveys, where it is possible to pipe in an item utilizing information gained earlier in the survey or collected beforehand. This can be done in a number of different ways. In our application we gave survey respondents who indicated earlier in the survey that they were below 30 years of age the statement “I was born in the 70s,” and respondents who indicated that they were 30 or above the placebo statement “I was born in the 2000s.” Depending on the other items on the list, it may for example fit better to construct a contextually adjusted placebo item such as, “I was born after the September 11 attacks” for the US, or another well-known national event, by using prior data on respondents’ date of birth. Theoretically the pipe-in approach has one clear benefit vis-á-vis existing approaches. For example, in the Singaporean setting Riambau and Ostwald (2020) use “I have been invited to have dinner with PM Lee at Sri Temasek [the Prime Minister of Singapore’s residence] next week,” which they suggest is “plausible but false” for all respondents. The authors caution against using ridiculous items (such as having the ability to teleport oneself) so as not to risk compromising the perceived seriousness of the survey. We take this one step further and suggest that there is a benefit to having a placebo item that is truly plausible to signal seriousness. Using an item that is necessary true or necessary false due to implausibility, even if not impossible, risks signaling to the respondent that their responses are not important or valuable to the researchers, which could result in lower attentiveness.
Results
Figure 2 shows the estimated prevalence of the item of interest using the DiM estimator with the conventional control group (point with solid line); the placebo control group (triangle with short dotted line); and the mixed control group (square with long dotted line). The vertical dotted line notes the true prevalence of the item being estimated (

DiM estimates of the item of interest using conventional, placebo, and mixed control groups. The dotted line at
Conclusions
Respondents’ lack of attention is a core threat to ob-taining unbiased estimates through list experiments. Unfortunately, this threat is not easily averted by modifying the length of the control list. The inclusion of placebo items in list experiments should hence not in general be regarded as costless and is not a universal solution to the problem of non-strategic respond errors. Rather, by modeling the error process, we show that different control list designs are associated with different kinds of bias. We focus on two control list designs from previous research, the conventional and the placebo design, and introduce a third, the mixed design.
Our first recommendation for researchers is therefore to focus on eliminating s – the share of inattentive respondents. This is the only reliable way of minimizing non-strategic respond error. Reducing the share of inattentive respondents is arguably more important in list experiments than in many other designs: The resulting measurement error not only results in noisier estimates, but is also associated with specific forms of bias, as shown in this paper. The share of inattentives in the sample can be minimized by excluding respondents who fail instructional manipulation checks or similar control questions (Berinsky et al., 2014), or by trying to increase the effort and attention among respondents in the study (see Clifford and Jerit (2015)). However, all these methods involve trade-offs. Excluding some respondents might, for instance, decrease the representativeness of the sample if attentiveness is correlated with certain respondent characteristics (Alvarez et al., 2019; Berinsky et al., 2014). How to best reduce s in the context of the list experiment is clearly an important area for future research.
Our second recommendation is to encourage researchers to think carefully about the specific bias that inattentive respondents might cause in a given study and adjust their control list design based on this. The share of inattentive respondents is often large (Alvarez et al., 2019; Berinsky et al., 2014) and it is unlikely that researchers will be able to eliminate s entirely (s is of course in general not known). We argue that a major problem in previous studies is that the expected bias often works in favor of the researcher’s hypothesis. When estimating the prevalence of phenomena that are relatively uncommon (for instance vote buying), the list experiment might provide evidence of “underreporting” when compared with a direct question simply because the list estimate is pulled toward 0.5 by inattentive respondents under the conventional design.
We advocate the following approach for choosing and designing control lists. First, the researcher should provide a best guess regarding the true prevalence rate of the item of interest (
Our third recommendation is for researchers to always (when possible) use our proposed piped-in approach to construct plausible placebo items, utilizing information collected previously. We view this as a distinct improvement over previous methods that is flexible and avoids undermining the credibility of the experiment by including implausible items.
We provide an empirical illustration in which we fielded a list experiment with known prevalence rate, and where one-third of respondents received the treatment list, another a conventional control list, and the remaining third a placebo list. We also constructed a mixed list from the two other control lists. The empirical study confirms many of our theoretical results: We find that the prevalence is overestimated when we use the conventional control list, but underestimated when using the placebo list. In line with our recommendations applied to the specific case, we find that the mixed list yields the estimate with lowest bias.
As our paper shows, there is no simple solution to the issue of non-strategic respondent error in list experiments without decreasing the share of inattentive respondents in the sample. However, by thinking more carefully about the expected bias in a specific application, researchers can substantially mitigate the problem.
Supplemental Material
sj-pdf-1-rap-10.1177_20531680211013154 – Supplemental material for Dealing with measurement error in list experiments: Choosing the right control list design
Supplemental material, sj-pdf-1-rap-10.1177_20531680211013154 for Dealing with measurement error in list experiments: Choosing the right control list design by Mattias Agerberg and Marcus Tannenberg in Research & Politics
Footnotes
Acknowledgements
We thank Adam Glynn, Jacob Sohlberg, and Kyle Marquardt for their helpful comments at the early stage of this project. We would also like to thank Eddie Yang and Shane Xuan for generous help with fine-tuning the Chinese question wording. Finally, we thank the editor at R&P and the anonymous reviewers whose comments and insightful input helped us in making the paper stronger.
Correction (June 2025):
Declaration of conflicting interests
The author(s) declared no potential conflicts of interest with respect to the research, authorship, and/or publication of this article.
Funding
The author(s) disclosed the following financial support for the research, authorship, and/or publication of this article: We are grateful to Helge Ax:son Johnssons Stiftelse and Lundgrens Vetenskapsfond for financial support for data collection.
Supplementary materials
The supplementary files are available at http://journals.sagepub.com/doi/suppl/10.1177/20531680211013154. The replication files can be found at https://dataverse.harvard.edu/dataset.xhtml?persistentId=doi:10.7910/DVN/DNHS7F&version=DRAFT
Notes
Carnegie Corporation of New York Grant
This publication was made possible (in part) by a grant from the Carnegie Corporation of New York. The statements made and views expressed are solely the responsibility of the author
References
Supplementary Material
Please find the following supplemental material available below.
For Open Access articles published under a Creative Commons License, all supplemental material carries the same license as the article it is associated with.
For non-Open Access articles published, all supplemental material carries a non-exclusive license, and permission requests for re-use of supplemental material or any part of supplemental material shall be sent directly to the copyright owner as specified in the copyright notice associated with the article.