



Abstract
This paper assesses the comparative opportunities and limitations of ‘new’ and ‘old’ data sources for early warning, crisis response and violence research by comparing reports of political violence, and both violent and peaceful demonstrations, produced through social media and traditional media during the Kenyan elections in August and October 2017. We leverage data from a sample of social media reports of violence through public posts to Twitter and compare these with events coded from media and published sources by the Armed Conflict Location & Event Data Project (ACLED) along two dimensions: 1) geography of violence; and 2) temporality of reporting. We find that the profile of violence recorded varies significantly by source. Records from Twitter are more geographically concentrated, particularly in the capital city and wealthier areas. They are timelier in the immediate period surrounding elections. Records from ACLED have a wider geographic reach, and are relatively more numerous than Twitter in rural and less wealthy areas. They are timelier and more consistent in the run-up to and following elections. While neither source can reveal the ‘true’ violence that occurred, the findings point to the value of drawing on a constellation of various source types given their complementary advantages.
Introduction
Social media and digital technologies (SMDTs) are transforming how both political violence and demonstrations are monitored, analysed and understood. SMDTs have generated new platforms for information-sharing and new actors as digital witnesses (Chouliaraki, 2016). Initiatives such as Ushahidi in Kenya have used digital platforms to crowdsource reports and direct crisis response (Ushahidi, 2013); while international donors have funded social media monitoring for violence early warning globally (see Slutzker, 2015). Equally, a growing body of research relies on robust event data to understand conflict dynamics (Verwimp et al., 2019).
Reports of violence coded from open access sources usually originate from ‘old’ media, such as newspapers, or ‘new’ (social) media. Both seek to produce relevant, actionable data, but both have limitations that could potentially reduce effectiveness. Systematic biases in traditional media have been extensively documented (Baum and Zhukov, 2015; Bocquier and Maupeau, 2005) and indicate that media may underrepresent certain demographics or geographies (Weidmann, 2016).
Initial digital technology optimism suggested a new ‘data revolution’ might address these concerns. Recent evidence, however, indicates SMDTs may also underrepresent particular groups (Lerman, 2013). This research is still emerging and, to date, there is relatively little on precise biases and how they differ from or replicate those of traditional sources (Dafoe and Lyall, 2015: 409).
This paper addresses this gap by determining comparative opportunities and limitations of ‘new’ and ‘old’ sources for violence monitoring. We analyse data from 1) ‘new’ media reports through public posts to Twitter, and 2) ‘old’ media reports coded by the Armed Conflict Location & Event Data Project (ACLED) during the Kenyan elections of August and October 2017. We compare these along two dimensions: 1) geography; and 2) temporality. While a true picture of underlying political violence and demonstrations (hereafter referred to as violence collectively, as shorthand) cannot be known, we can compare the profile produced by different sources, and identify implications.
The analysis highlights two key results. First, we find that source types differ in the physical and socioeconomic geography of violence recorded. ‘New’ media reports more violence in densely populated, economically developed areas, with greater concentration in the capital. By contrast, ‘old’ media reports more violence in less densely populated, less economically developed areas, with wider geographic coverage. Second, source types differ in their temporal profiles. ‘New’ media reports are highest in the immediate period surrounding elections, while reports from ‘old’ media are relatively more numerous before and after elections. Together, the findings suggest the value of a constellation of various source types given their complementary advantages.
‘New’ and ‘old’ media for violence monitoring
Violence data generated through ‘new’ media can facilitate crisis tracking and response efforts. SMDTs have been employed for monitoring election-related violence on Twitter in Guyana (Slutzker 2015), Nigeria (Bartlett et al., 2015) and Ghana (Moreno et al., 2017). In Kenya, Sambuli et al. (2013) compared Twitter and the Uchaguzi reports in the 2013 election. They found Twitter produced significantly more incident reports, but required greater resources to filter out ‘background noise’.
However, despite numerous initiatives and significant investment in SMDTs for monitoring violence, knowledge gaps remain. Notably, there is still relatively little comparative analysis of sources. Two dimensions are particularly important to researchers and policymakers. First, geography – where violence is reported to occur. Location is often key in studies seeking to explain why violence happens; and directing peacebuilding or crisis response resources depends on an accurate picture of hotspots and potential flashpoints. Second, temporality – when violence is reported, and how long it takes to be reported. The profile of violence over time gives researchers an overview of crisis escalation and de-escalation dynamics, while policymakers and responders may be particularly concerned with receiving real-time reports.
Geography of violence
Different sources may produce divergent spatial profiles of violence. Geographical imbalances in ‘old’ media coverage have been found to reflect the economic and political power of urban elites (Chan, 2017). Media coverage may disproportionately report events close to urban areas (Davenport and Ball, 2002). Consequently, awareness of crises and targeting of response may be shaped by these biases.
SMDTs often promise to counter biases in traditional media, by providing a platform for otherwise underreported information. Examples include crowdseeding in insecure contexts where journalist access is limited (Van der Windt and Humphreys, 2016), or reporting by ‘citizen journalists’ where established media are banned (Fowler, 2017).
Yet, SMDTs do not necessarily eliminate bias. Digital technology relies on infrastructure unevenly distributed across territory (Roberts and Marchais, 2017). Technology gaps mean social media usage is typically associated with high levels of human capital. Due to overlapping inequalities, reports from a digitally literate, networked population may be less likely to capture violence against marginalised groups (Lerman, 2013; Perera, 2015). While existing research recognises this (Roberts, 2017), the precise extent and resulting biases remain under-specified.
Temporality of reporting
Timeliness in reporting depends on several factors. For ‘old’ media, violence in remote areas may not be reported immediately (or at all) due to delays in accessing and transmitting information (Chataing, 2015). Unconstrained by publishing deadlines, ‘new’ media can potentially transmit real-time information (Andrews et al., 2016). To date, however, there is no consensus on comparative timeliness. Price et al. (2013) found a high correlation on timing of crowdsourced and non-social media-generated reports of violence in Syria. However, De Juan and Bank (2015) and Masad (2013) report significant temporal discrepancies between violence reported on the digital platform, Syria Tracker, and the Global Data on Events, Location and Tone dataset (GDELT Project), based on international news reports.
Beyond speed alone, the patterns of reporting over time are also important. For electoral violence, data on pre- and post-election violence is valuable for understanding escalation and de-escalation patterns. As above, traditional media biases driven by the ‘issue-attention cycle’ (Downs, 1972) and ‘the CNN effect’ (Jakobson, 2000) have been well documented. We know relatively less about how user-generated reports via ‘new’ media evolve. Crowdsourcing relies on active participation by volunteers, who may be adversely affected by insecurity or subsequent recall bias (De Juan and Bank, 2015). Political control over digital communications may also hinder reporting. Governments across Africa have repeatedly blocked or limited social media during unrest, including in Kenya (CIPESA, 2016; Mutahi and Kimari, 2017).
Elections, violence and crisis monitoring in Kenya
Kenya has repeatedly experienced electoral violence. In the run-up to August 2017, there were signs of potential unrest. When results were tallied, presidential candidate and opposition leader, Raila Odinga, alleged the counting system had been hacked and preliminary results fabricated to secure victory for incumbent president Uhuru Kenyatta. The dispute plunged Kenya into political crisis: rioting broke out in several areas, police clashed with demonstrators, and there were allegations of covert paramilitary violence (Cherono, 2017).
On 1 September, Kenya’s Supreme Court invalidated the results and announced a re-run. The opposition boycotted the second election on 26 October, resulting in Kenyatta’s victory. Though contested, the Supreme Court upheld the outcome, bringing an end to the process. Although more limited, October also witnessed disorder (Daily Nation, 2017).
In addition to this unprecedented political situation providing a unique case for monitoring, Kenya has one of the highest levels of telecommunications and internet infrastructure in Africa. In 2017, there were an estimated 39.1 million registered mobile phone users and 40.5 million internet users, among a population of 45.4 million (CAK, 2017: 8). Social media use is also high, with an estimated 2.2 million monthly active Twitter users (BAKE, 2016: 3). This is accompanied by a culture of social media activism and SMDT violence monitoring (Ushahidi, 2013). There is also a community of ‘Kenyans on Twitter’ (#KOT) engaged in campaigns for political accountability (Mutahi and Kimari, 2017). The hashtags #ElectionsKE and #ElectionsKE2017 were widely used in election content on social media in 2017 (N’gang’a, 2017).
Kenya also has an active press: it hosts five daily newspapers, and international news media actively covered the elections. Despite recent efforts by the government to restrict press freedom, national media continues to regularly report violence (Freedom House, 2017). This combination of characteristics allows us to study the comparative benefits of different monitoring systems.
Data collection
‘Old’ media
‘Old’ media sources refer to traditional media such as newspapers, newswires and published reports. They are drawn in this paper from ACLED (Raleigh et al., 2010), a crisis monitoring data project that publishes data weekly. At the time of data collection, ACLED relied largely on published media in the Kenyan context. 1 Reports are analysed by researchers and coded according to disaggregated criteria. For this study, ACLED researchers also included the date of reporting to facilitate comparative analysis. ACLED data have been used in several studies of conflict, including electoral violence in Kenya (Linke, 2013) and Africa more widely (Goldsmith, 2015).
‘New’ media
‘New’ media sources refer to SMDTs such as Twitter, Facebook and custom digital platforms. They are drawn in this paper from public posts on Twitter. These were collected using Method52, 2 which automatically crawled tweets containing certain keywords. Table IA in Online Appendix I lists the 113 search terms used. The resulting tweets were analysed by researchers and coded according to disaggregated criteria. Data collection ran from March to November 2017. Method52 has been used for monitoring social media during specific periods, such as the 2013 Eurozone crisis (Wibberley et al., 2014), and the 2015 Nigerian elections (Bartlett et al., 2015).
Inclusion criteria
Reports from both sources were coded if they contained both relevant and sufficient information. To be relevant, reports must include information about political violence or protests in Kenya between March and November 2017. To have sufficient information, reports must contain details of ‘what happened’ (e.g. a violent event, a peaceful demonstration), where (at minimum, in which county), and who was involved (at minimum, whether armed or peaceful actors). Our analysis does not compare the overall number of tweets or news reports, but rather, the number of discrete events coded from these. We acknowledge that the short format of tweets presents a constraint for including sufficient information. However, this is mitigated in part because some tweets contained links to external sources (e.g. a webpage with further details). Where this occurred, details were included from the linked resource. In addition, we maintain that this constitutes a valid comparison, as the constraints on length are equally applicable when SMDTs are used for monitoring by crisis responders.
Results
Between 13 March and 30 November 2017, a total of 852 discrete events were recorded. 283 events were recorded in both datasets (matched events). Some 440 were recorded only in ACLED, bringing ACLED’s total to 723. And 129 were recorded only by Twitter, bringing Twitter’s total to 412 (see Figure 1).

Events by source type.
To identify matched events, the narrative description of each event was read and on the basis of common features of the event described, paired with a corresponding event in the other dataset. The following analysis therefore draws on three datasets: 1) ‘matched’ events captured by both datasets; 2) ‘old’ media events only recorded in ACLED; and 3) ‘new’ media events only recorded on Twitter.
Geography
The spatial distribution of reports varies by source type (see Figure 2). The map on the left visualises the location of events reported by ACLED, while those on right are reported by Twitter.
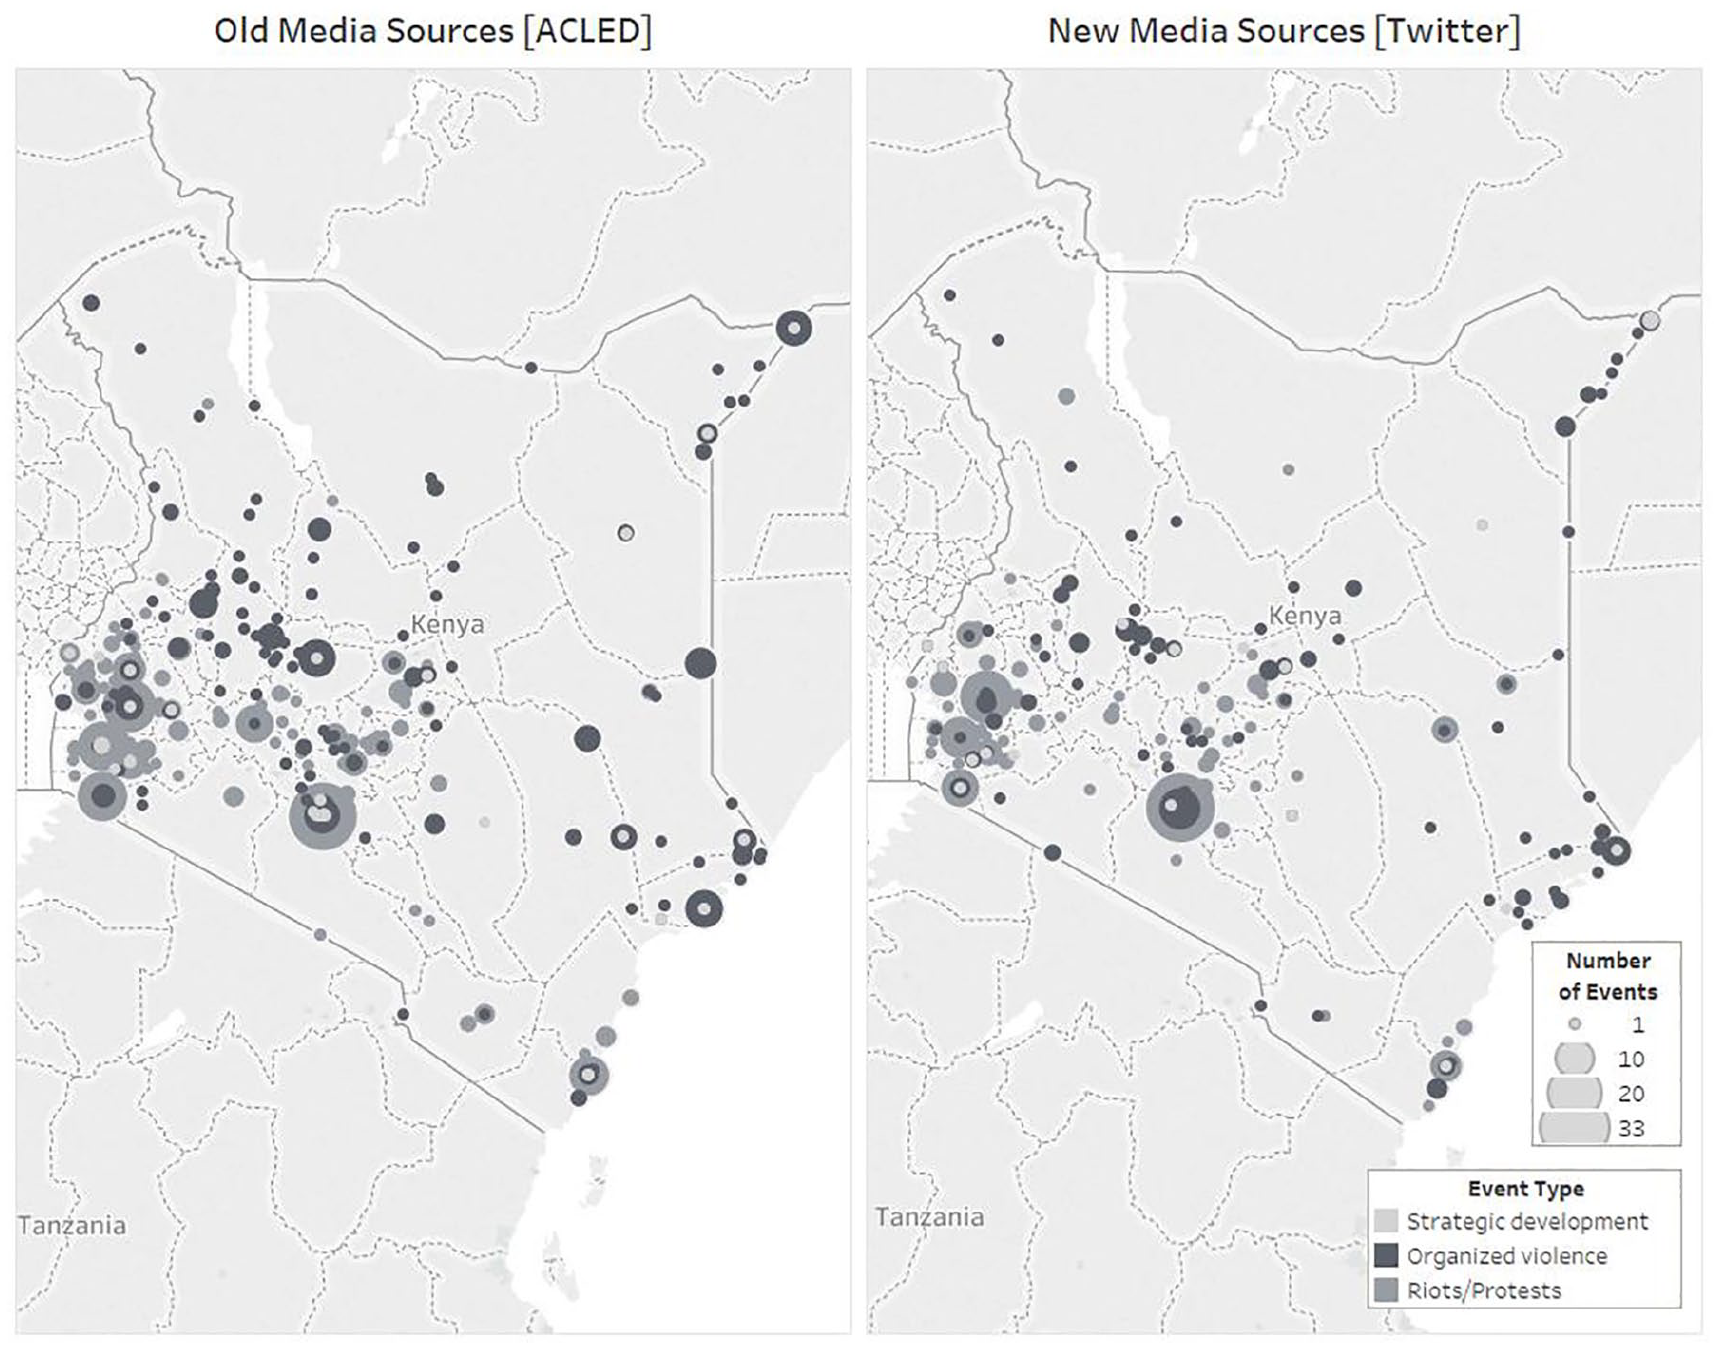
Conflict events by location and source type, 13 March–30 November 2017.
Twitter events are more concentrated in densely populated areas; ACLED has wider geographic coverage, per the wider breadth of locations on the map. Table 1 confirms this pattern: on average, the population density of areas where events reported only by ACLED took place is 743.4 people per km2; 851.6 for those reported only by Twitter; and 770.4 for matched events. This pattern holds when we analyse the concentration of events in the capital: 17% of events in ACLED took place in Nairobi county, compared with 22% in Twitter and 19% of matched events. This suggests that events reported by ‘new’ media are more concentrated in urban areas.
Geographic distribution of events by source type.

Source: 2000 population density data from the WorldPop Project, www.worldpop.org.uk/.
Beyond rural–urban differences, we also find differences in geographic coverage. ACLED reports events in 249 uniquely named locations, while Twitter reports events in 187. In other words, ‘old’ media reports violence in more uniquely-named locations – meaning reports are more granular and precise, rather than using the aggregate name of a larger area, for example. In case this simply reflects a greater level of detail in ‘old’ media reports, rather than geographic coverage, we also compare the number of counties in which events were reported, and the pattern holds. ACLED reports events in all 47 counties; Twitter reports events in 44.
We also compare socioeconomic geography. We find Twitter tends to report more in areas with higher GDP per capita and economic development (proxied by a nightlights index). In real terms, on average, residents in areas where ‘new’ media reported events earn over USD 100 more annually than those in areas where events were reported by ‘old’ media (Table 2). Together, this suggests ‘new’ media may be more effective in capturing violence in wealthier, urban areas; while ‘old’ media may be more effective capturing violence in rural, less economically developed areas.
Characteristics of locations of events by source type.

Source: GDP data from Nordhaus (2006): http://sedac.ciesin.columbia.edu/data/set/spatialecon-gecon-v4; and 2013 Average Visible Stable light nightlight data from the Earth Observatory Group: https://ngdc.noaa.gov/eog/dmsp/downloadV4composites.html.
Temporality
We also find significant differences when we compare two dimensions of temporality – timeliness and reporting over time.
For timeliness, we analyse the ‘reporting lag’, defined as the number of days between the date an event is reported to have occurred, and when the report of that event surfaces. For example, a report that violence occurred earlier that same day has a reporting lag of 0, while a report citing violence the day before has a lag of 1. Some reports do not specifically state the date of an event (e.g. ‘an attack occurred last week’). These are coded with lower time precision, but as this means we are unable to accurately test their timeliness, we limit this analysis to reports with a high level of time precision. Because there may be systematic differences in the characteristics of events reported only by ‘old’ or ‘new’ media that subsequently affect timeliness, we also limit analysis to matched events only.
Figure 3 depicts the reporting lag of events from ACLED (top) and Twitter (bottom). The shorter the bar, the shorter the lag. On average, the reporting lag for ACLED is approximately 1.83 days, compared with 2.21 days for Twitter – a statistically significant difference per an independent t-test (p=0.0804). However, this varies over time. In the weeks immediately surrounding the elections, ACLED has an average reporting lag of 4.37. This is likely a result of drawing on in-depth coverage such as reports from human rights organisations, which are often only released after detailed investigations are complete, thus increasing the average lag. By contrast, the average reporting lag for Twitter events during this period is 1.15 days. Outside the immediate election period, this pattern is reversed: the average reporting lag for ACLED is 1.79 days, while the lag for Twitter increases to 2.87 days.

Reporting lag of events by source type, 13 March–30 November 2017.
Analysis reveals that Twitter’s timeliness is affected by a relatively small number of very high reporting lags outside the immediate election period. Further research is required, but one possible explanation is that Twitter users are less likely to use social media for real-time reporting outside of critical junctures, which may be accompanied by a sense of social mobilisation and urgency. Instead, users may use social media to comment or reflect on incidents in the longer-term outside these periods. In other words, Twitter reporting lags may be more sensitive to changes in user engagement and wider social mobilisation than traditional media, an explanation that is consistent with patterns observed in reporting over time, discussed below.
We also find sources differ over time. Figure 4 shows events coded from ACLED (top) are more numerous over time than those on Twitter (middle). Although both capture similar general patterns, Twitter reports are markedly lower outside the immediate election window. The greatest divergence emerges in the run-up to elections. While over the entire period, ACLED captured 1.75 times as many events as Twitter (723 to 412), in the period up to two weeks before elections, this increases to over twice as many (355 to 173).

Number of events by source and event type, 13 March–30 November 2017.
Although further research into social media user behaviour over time would be valuable, our findings suggest ‘new’ media may be more comprehensive in the period immediately surrounding elections, whereas ‘old’ media may be more consistent over time. This suggests that the relative value of crisis monitoring platforms depends on both the monitoring timeframe and the extent to which real-time data are required for immediate response.
Discussion and conclusion
Neither dataset can claim to present a full picture of underlying violence. We cannot know the true population of events, nor can we know all underlying biases. This paper outlines a number of advantages and disadvantages of traditional and new media for reporting purposes. However, a discussion of the veracity and vetting of reports (see Boididou et al., 2018), is beyond the scope of this paper, and further research in this area would be valuable. Nevertheless, where researchers, policymakers and responders continue to rely on different sources to monitor and study violence, often without the means themselves to verify reports at scale, it remains worthwhile comparing the profile each produces.
On average, ‘old’ media reported more unique events than the ‘new’ media sample; had wider geographic coverage, including more events in rural and less economically developed areas; and captured more violence in the run-up to and following elections. By contrast, ‘new’ media captured fewer events; had more limited geographic coverage; recorded more violence in urban and relatively economically developed areas; and captured more violence, in a timelier way, during the immediate election period. Table 3 summarises these key differences.
Key differences by data sources.

The findings point to the importance of drawing on a constellation of sources to leverage complementary advantages of different source types. Political violence varies over time and geography, amongst other factors. As such, a constellation of sources is useful for distinct contexts, especially as the relatively limited overlap between sources suggests they are complementary, and can supplement each other in meaningful ways. For example, in some more rural or economically marginalised areas, ‘old’ media may bring additional value in coverage; by contrast, in some urban or more economically developed areas, ‘new’ media may add important detail. However, optimum sourcing profiles vary by local context – affected by press freedom, new media penetration, and conflict landscape – which crisis responders ought to consider when developing a sourcing strategy. Since this project, ACLED has expanded its sourcing strategy, integrating information from select new media and local conflict observatories, based on context.
The findings here may be generalisable to similar contexts beyond Kenya: those with high SMDT usage, an active press and repeated, and relatively low-level insecurity. Moreover, they indicate that if significant biases or limitations arise even in Kenya, this should serve as a caution against an overreliance on similar sources in even less digitally developed contexts. Lastly, the finding that one size does not fit all when selecting sources to monitor violence, and that there is value in drawing on a constellation of complementary sources, extends beyond Kenya alone to all contexts.
However, the findings also point to the need to qualify the (sometimes implicit) claims that social media contributes to democratisation of the information landscape. While perhaps true in some contexts, this paper highlights important caveats, against a global backdrop of dis-accreditation of and divestment from traditional media. For policymakers relying on robust violence reporting, supporting traditional media organisations can still contribute significant value-add to monitoring and response.
Supplemental Material
Kenya_Appendix – Supplemental material for Comparing ‘New’ and ‘Old’ Media for Violence Monitoring and Crisis Response: Evidence from Kenya
Supplemental material, Kenya_Appendix for Comparing ‘New’ and ‘Old’ Media for Violence Monitoring and Crisis Response: Evidence from Kenya by Caitriona Dowd, Patricia Justino, Roudabeh Kishi and Gauthier Marchais in Research & Politics
Footnotes
Acknowledgements
We are grateful for the comments and suggestions received at workshops in Nairobi and London. We are also grateful for comments and discussions to Mutuma Ruteere, Patrick Mutahi and Brian Kimari of the Centre for Human Rights and Policy Studies (CHRIPS), Tony Roberts and an anonymous reviewer at the Institute of Development Studies (IDS), and Giuseppe Maggio.
Authors’ note
Earlier versions of this paper were presented at three workshops on ‘Exploring Media and Digital Reporting Systems for Early Warning, Response and Analysis,’ July 2017, Nairobi; ‘Reflecting on Kenya’s Elections: Monitoring Systems for Early Warning, Response and Analysis’, January 2018, Nairobi; and ‘New’ and ‘Old’ Media for Violence Monitoring, Crisis Response and Academic Research’, London, May 2018.
Declaration of conflicting interests
The author(s) declared no potential conflicts of interest with respect to the research, authorship, and/or publication of this article.
Funding
The author(s) disclosed receipt of the following financial support for the research, authorship, and/or publication of this article: This research project was funded by the Economic and Social Research Council (ESRC) (UK), grant no. ES/P010709/1, under the title ‘New and Emerging Forms of Violence Data for Crisis Response: A Comparative Analysis in Kenya’, which ran from 14/02/2017–13/06/2018.

Supplemental materials
Notes
Carnegie Corporation of New York Grant
This publication was made possible (in part) by a grant from the Carnegie Corporation of New York. The statements made and views expressed are solely the responsibility of the author.
References
Supplementary Material
Please find the following supplemental material available below.
For Open Access articles published under a Creative Commons License, all supplemental material carries the same license as the article it is associated with.
For non-Open Access articles published, all supplemental material carries a non-exclusive license, and permission requests for re-use of supplemental material or any part of supplemental material shall be sent directly to the copyright owner as specified in the copyright notice associated with the article.
