
Abstract
Recent elections in Afghanistan, Bangladesh, Côte d’Ivoire, Egypt, Iraq, Kenya, Nigeria, and Pakistan have displayed substantial contestation and violence. A growing literature explores the causes and consequences of electoral contention and violence, but researchers lack comprehensive, disaggregated data establishing a substantive link between elections and violence. The Electoral Contention and Violence (ECAV) dataset conceptualizes electoral contention as nonviolent or violent events of contestation by state or non-state actors related to national elections. The data contain more than 18,000 events of election-related contention covering 136 countries holding competitive national elections between 1990 and 2012. This article describes the scope of ECAV, presents the project’s definition of electoral contention and the variables included, and outlines the coding procedure. We then compare ECAV to other datasets on electoral contention. Cross-national and subnational analyses of electoral competition and violence show that the data are useful for assessing the global and subnational implications of existing theories. ECAV addresses current data limitations by focusing on election-related contention, by using clear criteria to determine whether events are election-related, and by identifying the timing, geocoded location, and actors involved.
Introduction
Recent elections in Afghanistan, Bangladesh, Côte d’Ivoire, Egypt, Iraq, Kenya, Nigeria, and Pakistan have displayed substantial contestation and violence. An emerging literature explores the causes and consequences of electoral contention, examining how the competitiveness of elections, the response of losing parties, the quality of the elections, armed conflict, and the role of international actors affects the incidence of contention (Birch & Muchlinski, 2017; Burchard, 2015; Daxecker, 2012, 2014; Flores & Nooruddin, 2012; Hafner-Burton, Hyde & Jablonski, 2014; Hyde & Marinov, 2014; Kuntz & Thompson, 2009; Matanock, 2017; Norris, Frank & Martínez i Coma, 2015; Rauschenbach & Paula, forthcoming; Salehyan & Linebarger, 2015; Smidt, 2016; Staniland, 2015; Steele, 2011; Straus & Taylor, 2012; Tucker, 2007; von Borzyskowski, 2013). A major limitation, however, is the lack of comprehensive, disaggregated data on electoral contention – a lack that has been noted by scholars and practitioners alike (European Commission & United Nations Development Programme, 2011; Fjelde & Höglund, 2016b). Conceptualizing electoral contention as nonviolent or violent acts of contestation by state or non-state actors that relate to the electoral process, the Electoral Contention and Violence (ECAV) dataset contains systematic, human-coded data on contentious events related to national elections for all unconsolidated regimes between 1990 and 2012. Because the unit of analysis is the event-day-location, the data allow for spatially and temporally disaggregated analyses.
Why new data on electoral contention?
Empirical assessments of election violence face two limitations: researchers lack data establishing a substantive link between elections and violence; and current data do not provide disaggregated information on the timing, location, and actors, limiting the development and testing of micro-level theories. We discuss each in turn.
First, electoral contention is conceptualized as a subtype of political contestation that is substantively linked to electoral processes (Beaulieu, 2014; Höglund, 2009; Staniland, 2014; Straus & Taylor, 2012). For example, Höglund (2009: 415) highlights that actors engaged in electoral violence aim to ‘influence the electoral process’ by objecting to elections or attempting to influence election outcomes, and others similarly stress a substantive connection between contention and elections (Beaulieu, 2014; Straus & Taylor, 2012). Yet it is challenging to establish this connection empirically, which is why empirical assessments have often considered all political violence around elections as instances of electoral violence (Daxecker, 2012; Straus & Taylor, 2012). Omitting a substantive link to the electoral process, however, presumably means including events that would have occurred anyway, raising concerns about electoral contention as a distinct type of contestation (Fjelde & Höglund, 2016b).
Second, theoretical accounts often highlight the micro-level processes motivating electoral contention, including the identity of actors or targets (Hafner-Burton, Hyde & Jablonski, 2014; Smidt, 2016), the timing of elections (Daxecker, 2014; Hafner-Burton, Hyde & Jablonski, 2014), or the geography of electoral contention (Lankina, 2015; Fielding, forthcoming). Without disaggregated data on elections, contention, and violence, however, empirical assessments are frequently limited to aggregate data or single-country analyses. Global datasets on elections such as National Elections across Democracy and Autocracy (NELDA), Quality of Elections (QED), Varieties of Democracy (V-DEM), Perceptions of Electoral Integrity (PEI), or the Countries at Risk of Election Violence (CREV) provide information on contention and violence at election- or election-month level (Kelley & Kolev, 2010; Hyde & Marinov, 2012; Coppedge et al., 2018; Norris et al., 2016; Birch & Muchlinski, forthcoming), but do not allow for temporally or spatially disaggregated analyses of contentious events relating to elections.
Recognizing these drawbacks, some researchers have used disaggregated event data on nonviolent and violent contentious events (Daxecker, 2012, 2014; Fjelde & Höglund, 2016a; Salehyan & Linebarger, 2015; Smidt, 2016), including the Armed Conflict and Events Data (ACLED), the Social Conflict Analysis Database (SCAD), and the UCDP Georeferenced Event Data (UCDP GED) (Raleigh et al., 2010; Salehyan et al., 2012; Sundberg & Melander, 2013). 1 However, UCDP GED focuses on fatalities, missing lower-intensity events. ACLED codes lower-level violence, but collapses protest and riots into a single category. Nor, with the exception of SCAD, do these datasets identify the issues around which actors’ contestation revolve, thus including many events unrelated to the electoral process. 2 These datasets also do not distinguish political parties as separate actors, despite their theoretical importance (Staniland, 2014).
Describing ECAV
Scope
ECAV includes data on the incidence of electoral contention and violence in all countries, except for advanced industrialized democracies, that held competitive national elections between 1990 and 2012. 3 ECAV contains more than 18,000 events of electoral contention for 1,208 national election rounds held in 136 countries. 4 Figure 1 shows the global incidence of events as 1x1 degree grid squares from 1990 to 2012. Only squares with at least one event are depicted on the map; darker squares indicate that more events occurred within that square. The largest number of contentious events took place in Asia (31%), followed by Africa (26%), the Middle East (20%), Eastern Europe (15%), and Latin America (8%). These regional patterns are notable because existing research has focused primarily on Africa, neglecting substantial contention in Asia and the Middle East.
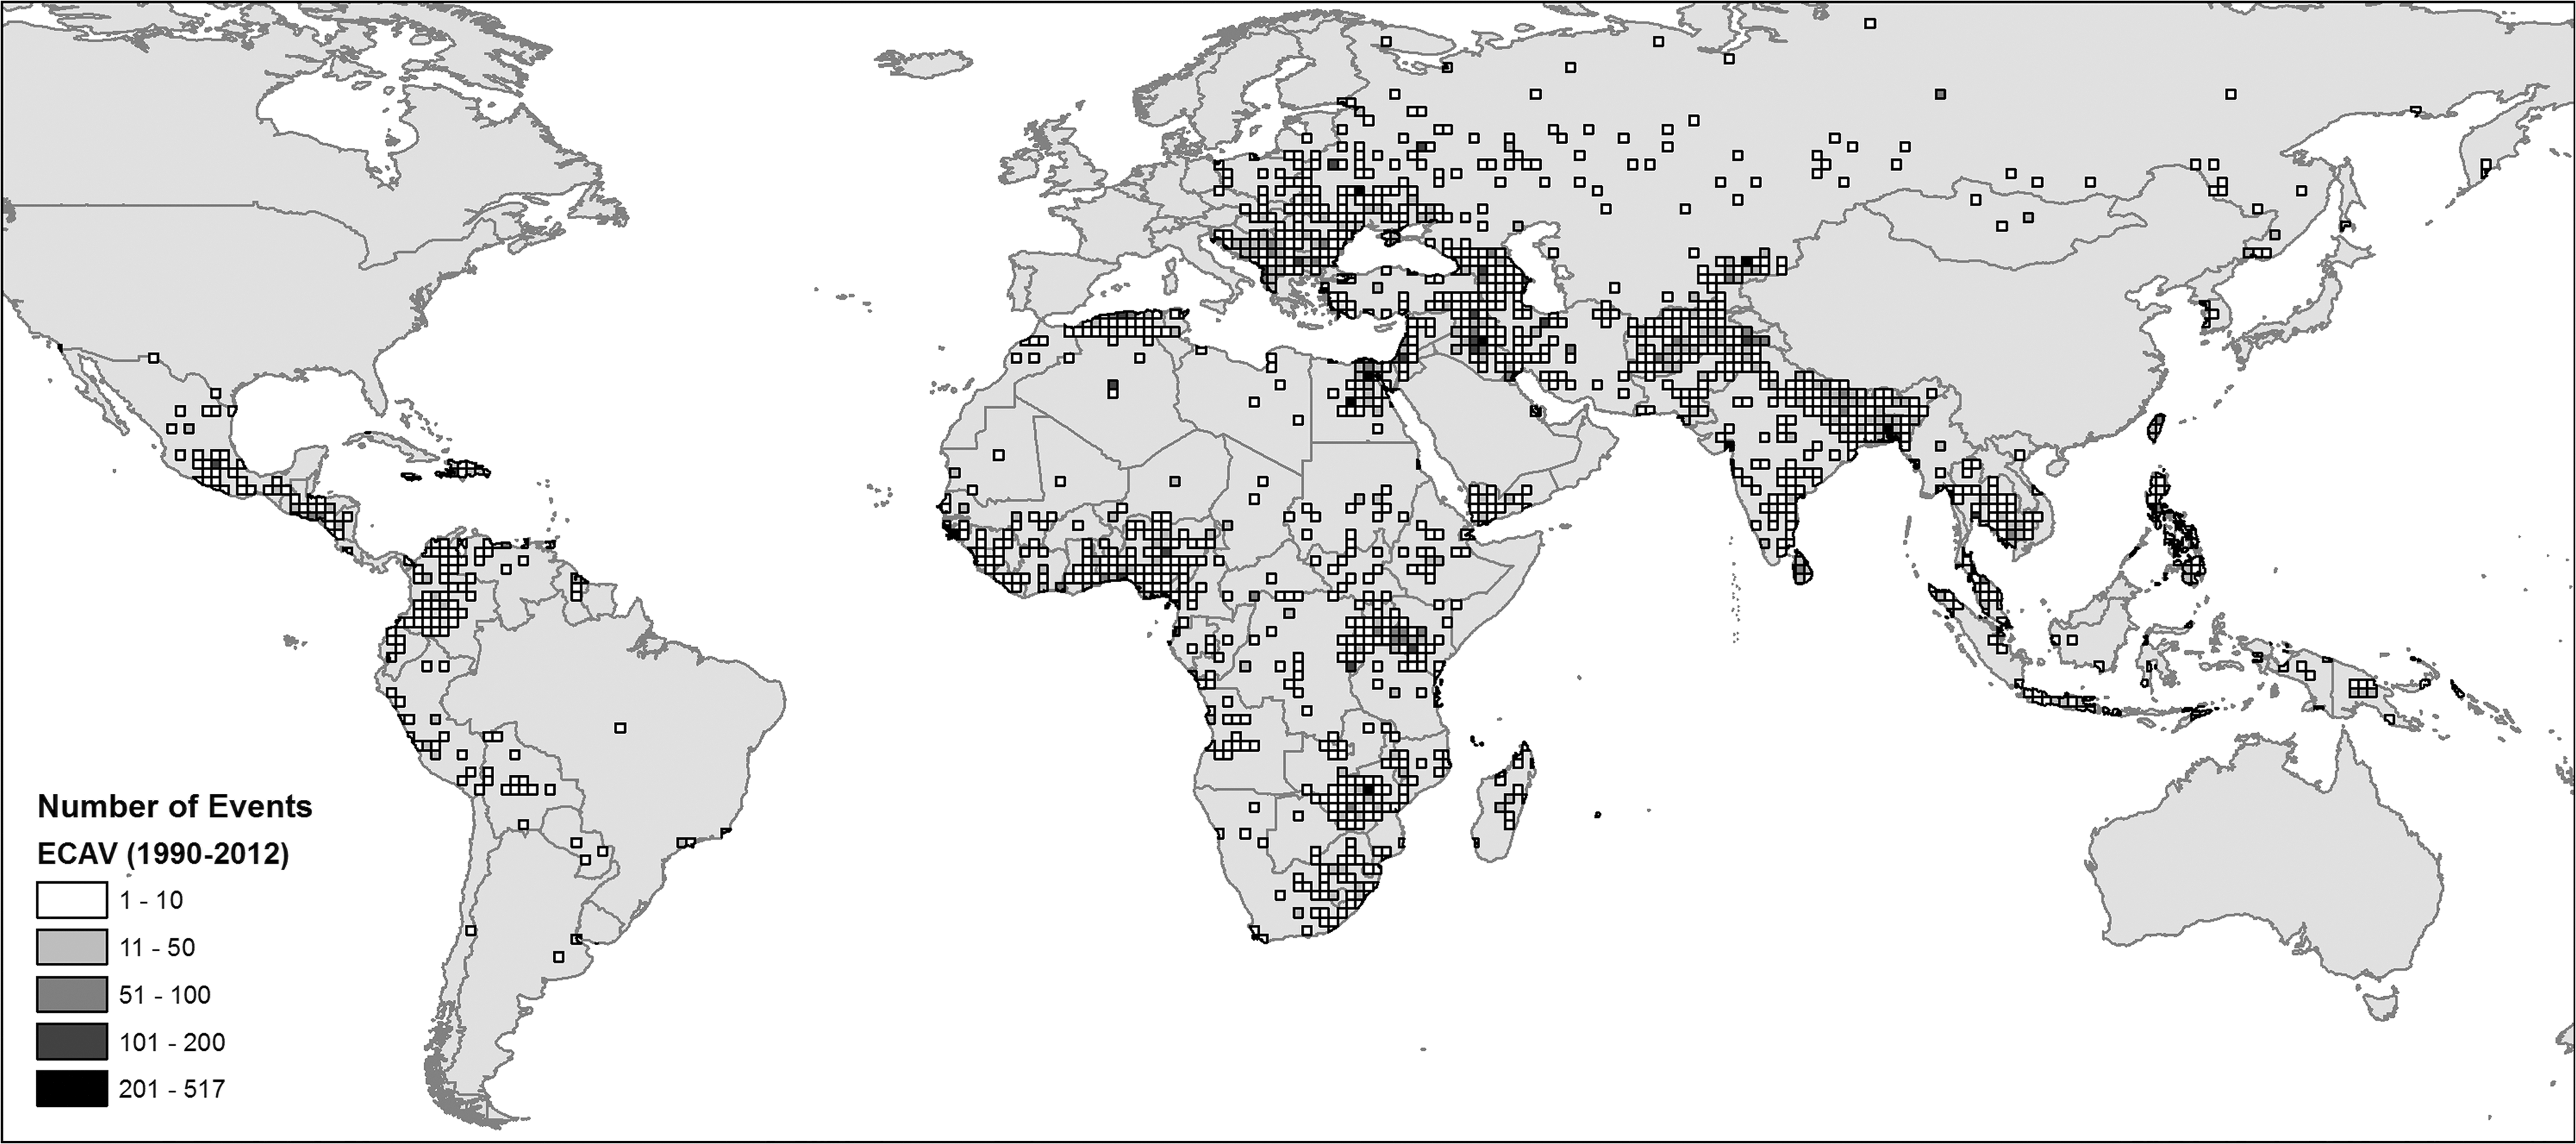
Geographic distribution of ECAV events, 1990–2012
To identify competitive elections, the ECAV dataset uses the NELDA definition, which requires elections to be direct and for a national executive or legislative office (Hyde & Marinov, 2012). 5 The ECAV dataset is thus limited to national elections. 6 Because we use NELDA, contentious events can be coded only if elections were actually held, omitting events in which contention demanding elections was unsuccessful.
The ECAV dataset excludes countries with consolidated democratic regimes, defined as states that were OECD members in 1990 (the first of year coding). 7 ECAV excludes events in Australia, Austria, Belgium, Canada, Denmark, Finland, France, Germany, Greece, Iceland, Ireland, Italy, Japan, Luxembourg, Netherlands, New Zealand, Norway, Portugal, Spain, Sweden, Switzerland, the United Kingdom, and the United States. 8 Events in states joining the OECD after 1990 (Mexico, the Czech Republic, Hungary, Poland, South Korea, Slovakia, Chile, Slovenia, Israel, and Estonia) are included. There is one exception: we code events in Turkey, despite it being a member of the OECD since 1961. Consolidated democracies are excluded because the ECAV dataset is primarily concerned with elections in which the occurrence of both electoral contention and violence is feasible.
Defining electoral contention
Electoral contention is defined as public acts of mobilization, contestation, or coercion by state or non-state actors used to affect the electoral process, or arising in the context of electoral competition. A contentious event involves at least two actors and either (1) the actors disagree on an issue and are thus seen as being on opposite sides of this issue, or (2) one of the actors threatens or uses violence against civilians. A rally or celebration in support of a political candidate would therefore not be coded as a contentious event, while an opposition party protest expressing disagreement with the government party would be coded. The above definition implies that events of electoral contention are publicly observable, are linked to an electoral process in timing and substance, and can be violent or nonviolent in nature. We discuss each in turn.
Publicness
There is evidence of actual public contention in the form of arrests, arson, attacks, bombings, boycotts, clashes, killings, intimidation, protests, rioting, shootings, or strikes. 9
Election-related
We determine the relation to elections with substantive and temporal criteria. Regarding substance, contention must be linked to an ongoing electoral process: the election can be identified, and articles explicitly mention the electoral process as an issue around which contestation occurs. Events relating to other issues are thus included only if we can infer that actors carry them out in relation to elections. For example, a strike over payment delays by health care workers a month before elections would not be included, unless the article mentioned that the proximity of elections was considered helpful in accomplishing the actors’ goals. Consistent with this approach, events taking place close to elections in states experiencing civil conflict are not automatically included. Rather, such events are included once the intent to affect (or respond to) electoral processes can be established. Intent is established based on reporting in articles or statements by the actors involved. 10
Regarding time, events occurring between six months before and three months after the election are included. This time frame may miss some relevant events, although we analyzed SCAD data to select this period before coding began (see Online appendix B). We use a common time frame for all elections because the ECAV dataset includes more than 1,200 election-rounds, making it practically impossible to research the most appropriate time frame for each election. For elections with multiple rounds, events were coded between six months before the first round and three months after the last round. 11
Nature
Contention can be nonviolent or violent. Events are coded as violent if they include the threat or actual use of force intended to inflict harm on people. Threats in which actors publicly threaten violence, such as armed groups making the rounds to threaten voters with violence if they participate in elections, are included. Verbal statements threatening violence, on the other hand, are not coded unless they involve public displays of such threats.
Unit of analysis and coding procedure
The unit of analysis is the event-day-location. An event-day-location is an election-related contentious event reported in a media source on a single day in a particular location. This implies that events occurring in multiple locations and/or taking place over more than one day are coded as separate entries. 12 For events lasting multiple days, we provide two additional variables identifying start and end dates to allow for temporal aggregation.
Information on electoral contention comes from news media reports in three newswire sources: Associated Press, Agence France Press, and BBC Monitoring available in LexisNexis. The extraction procedure is outlined in the codebook. The project relied exclusively on human coders: graduate students in social sciences at the University of Amsterdam. All coding took place under the supervision of the authors. Each coder was assigned a country and (as far as possible) coded all elections for this country. Before coding, students created a country fact file identifying election dates, main actors, notable political events, and administrative divisions.
Events data coding involves two steps. First, coders identified the events in news reports; and second, they encoded events according to the variables listed below. Coding reliability thus required coders to identify the same events and interpret them similarly (Ruggeri, Gizelis & Dorussen, 2011). We conducted a detailed assessment of the reliability of event identification and event encoding of all coders in the ECAV dataset project. For event identification, precision rates showed that coders on average identified 66% of events correctly. For event encoding, Krippendorff’s alpha showed very good or good results for variables recording violence, participant deaths, event direction, actor and target types, and location precision, and fair to intermediate results for remaining categorical variables (participant number, actor, and target side). The procedure and results are described in detail in Daxecker & Amicarelli (2019).
Variables
The ECAV dataset includes several variables for each election-day-location. The first set of variables provides identifying information, including an event ID, election ID, country name, date, location, coordinates, and a descriptor capturing the location precision level. 13
The next set of variables focuses on participants. For actors and targets involved in events, we distinguish between state and non-state actors, and further disaggregate non-state actors into civilians, party actors, and members of an armed group. Additional categories involve actors or targets that are unknown, or do not fit any other category (coded as other). We also record whether an actor supported the government, opposed the government, or whether this could not be determined. 14 The name of the actor and target in the event is also recorded. 15 Other participant variables indicate the number of participants and the number of deaths.
We record several event-related variables. We indicate whether it can be determined which actor initiated an event, distinguishing directed and undirected events. We further code whether an event was nonviolent or violent. An additional variable identifies which participant initiated the violence. We also distinguish event types. Coders were instructed to choose from a list of 18 event types (see codebook for the full list). The most frequent events are, in descending order: protests, attacks, clashes, bombings, arrests, killings, strikes, intimidation, blockades, and shootings. Events that do not fit pre-existing categories are included but constitute less than 2% of the total. Finally, we provide a brief description of each event and the source.
Limitations
Event data are attractive because they allow for temporally and/or spatially disaggregated research designs, but they have important limitations. A major concern is reporting bias, since what is reported in the news targets a particular audience, is biased in favor of particular countries or events, and is not representative of what is happening locally (Baum & Zhukov, 2015; Chojnacki et al., 2012; Weidmann, 2014). Reporting bias is particularly worrisome for research comparing countries and/or over time. ECAV uses international newswires as sources, which likely pay more attention to the developed world and areas of strategic importance. Reporting also differs across regimes, with authoritarian regimes underreporting nonviolent events and overreporting violence, whereas the opposite holds for democracies (Baum & Zhukov, 2015). Furthermore, reporting has increased over time, making it difficult to establish whether increases result from greater reporting or represent a true increase in events (Urdal, 2008). 16
Without access to the universe of true events, it is impossible to assess the extent of reporting bias in ECAV. In general, elections draw a significant amount of media attention, suggesting that they are less subject to underreporting (Fillieule, 1997). Researchers can also attempt to correct for biases using new techniques to model over- or underreporting (Cook et al., 2017), or control for factors associated with reporting bias.
Comparing ECAV to SCAD
We compare ECAV to SCAD, the dataset most similar to ECAV (Online appendix D includes a comparison with CREV). Both datasets involve event data collected by human coders from similar sources, although ECAV also includes the BBC. The geographic scope for SCAD is more limited than ECAV; SCAD is available for Africa, Mexico, Central America, and the Caribbean. We limit our comparisons to Africa because we have complete coverage in both datasets. We present cross-national and subnational comparisons of ECAV and SCAD. Our comparison is based on African countries and years (1990–2012) included in both datasets. We remove SCAD events in which elections were not one of the issues identified. We also omit SCAD events that fall outside of the time window around elections coded in ECAV. Furthermore, because SCAD does not record events occurring as part of ongoing UCDP armed conflict, we remove ECAV events that took place during UCDP conflicts. 17 We also collapse ECAV events lasting several days into single events. For both datasets, we include only events where location precision is at the level of first-order administrative units or more precise. Based on the above criteria, ECAV contains 3,057 election-related events, compared to only 533 in SCAD.
At the country level, ECAV and SCAD agree on eight of the ten African countries with most electoral contention in each dataset (DRC, Egypt, Kenya, Nigeria, South Africa, Tanzania, Togo, and Zimbabwe). The cross-national Spearman rank correlation for ECAV and SCAD events is corr = 0.72, showing considerable agreement. We then compare correlations subnationally, comparing events across first-order administrative units using the Database of Global Administrative Units (GADM). 18 The Spearman rank correlations are lower (corr = 0.45), which is unsurprising because correlations are sensitive to scale (Anselin & Cho, 2002). Figure 2 illustrates subnational patterns. We overlay 1x1 degree grid squares and calculate events per grid cell, displaying only grids experiencing at least one event. The ECAV dataset shows more geographically dispersed event coverage in several countries, including Egypt, Kenya, South Africa, Tanzania, and Zimbabwe. We also note that some countries, such as Algeria and Libya, record events in SCAD but not ECAV. However, note that the figure omits ECAV events in countries with ongoing armed conflict to make the data comparable to SCAD.
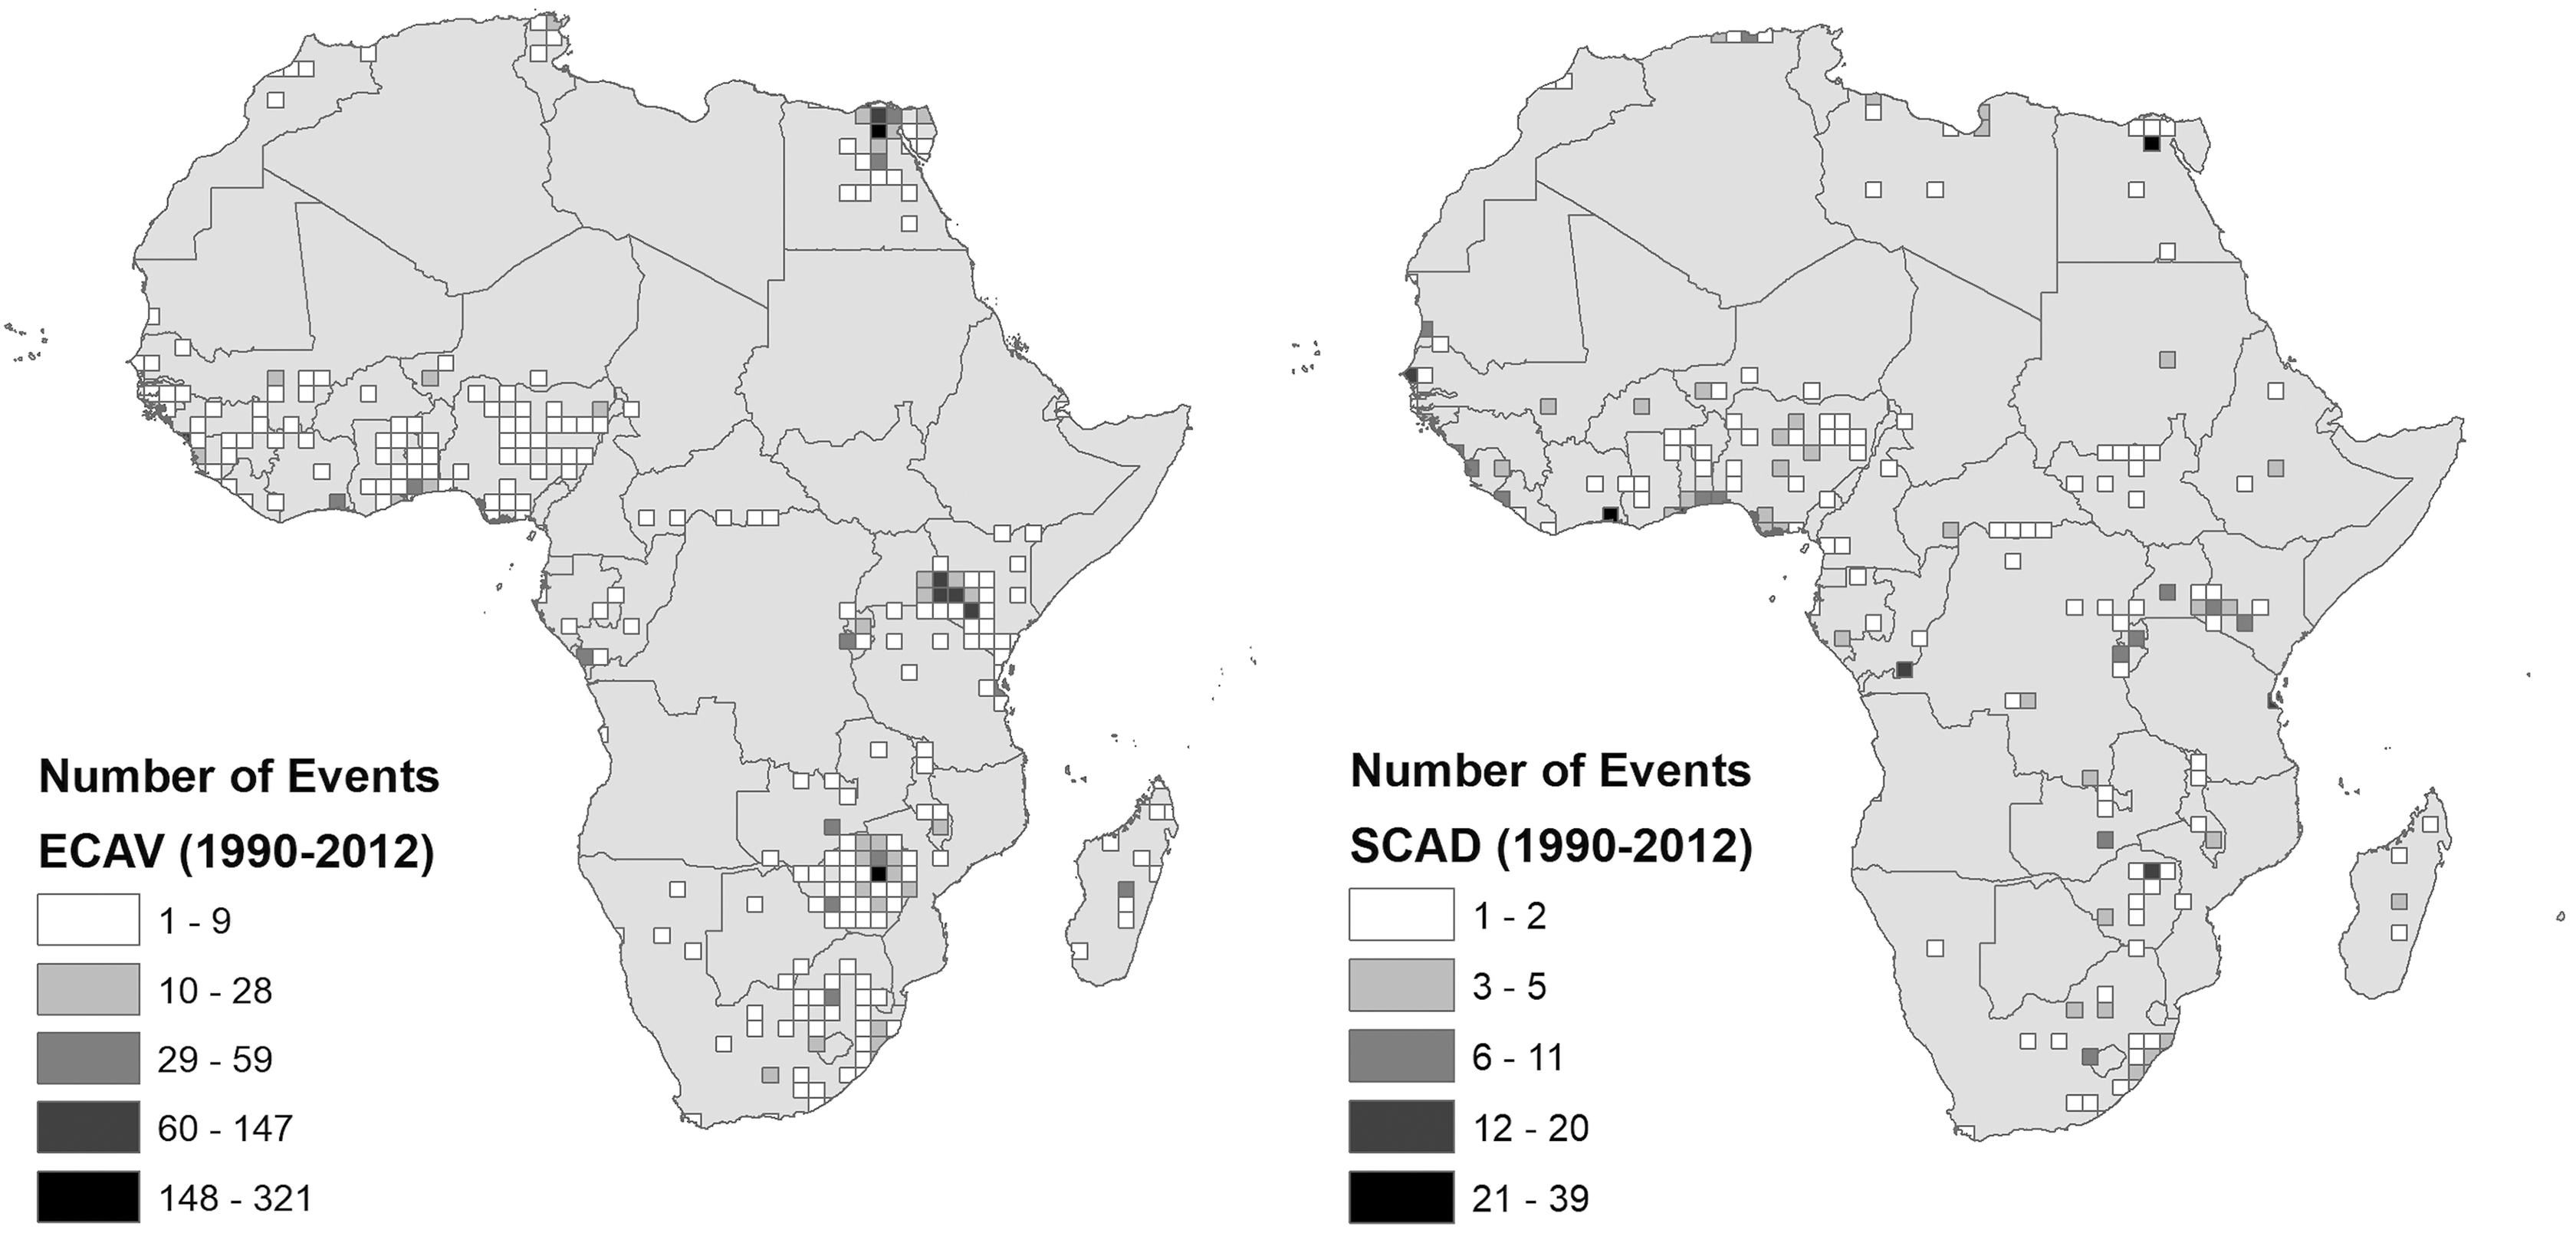
Geographic distribution of ECAV and SCAD events in Africa, 1990–2012
Application: Electoral competitiveness and violence
We demonstrate the usefulness of ECAV with cross-national and subnational applications. Existing accounts suggest that the risk of violence in unconsolidated regimes is greater when elections are closely contested, but cross-national analyses have either relied on measures indicating the presence or absence of election violence (Hafner-Burton, Hyde & Jablonski, 2014) or have been limited to African countries (Salehyan & Linebarger, 2015). We create a cross-national dataset consisting of all elections included in ECAV to examine the effect of victory margins on the incidence of election violence. 19 We include a count of the number of violent events from ECAV as the dependent variable in Model 1 (Table I), and compare these results to a model using a dummy dependent variable coded 1 for elections experiencing violence with data from NELDA (Hyde & Marinov, 2012). 20 Data for vote shares (%) come from V-Dem (Coppedge et al., 2018) and we calculate victory margins by subtracting the vote share of the second-place finisher from the vote share of the winner and divide this number by 100. We control for electoral rule, GDP per capita, population size, and ongoing UCDP intrastate armed conflict. 21 We use random-effects models because of the small number of elections for some countries. Model 1 in Table I uses the count dependent variable from ECAV and shows that expectations regarding competitiveness are confirmed. The negative and significant coefficient shows that as victory margins become larger, the expected incidence of election violence decreases. However, results in Model 2 with the dummy dependent variable show that the coefficient for victory margins misses conventional levels of statistical significance. Existing expectations on competitiveness and election violence are thus confirmed only with fine-grained indicators of election violence.
Cross-national regression of election violence, 1990–2012 (controls omitted)
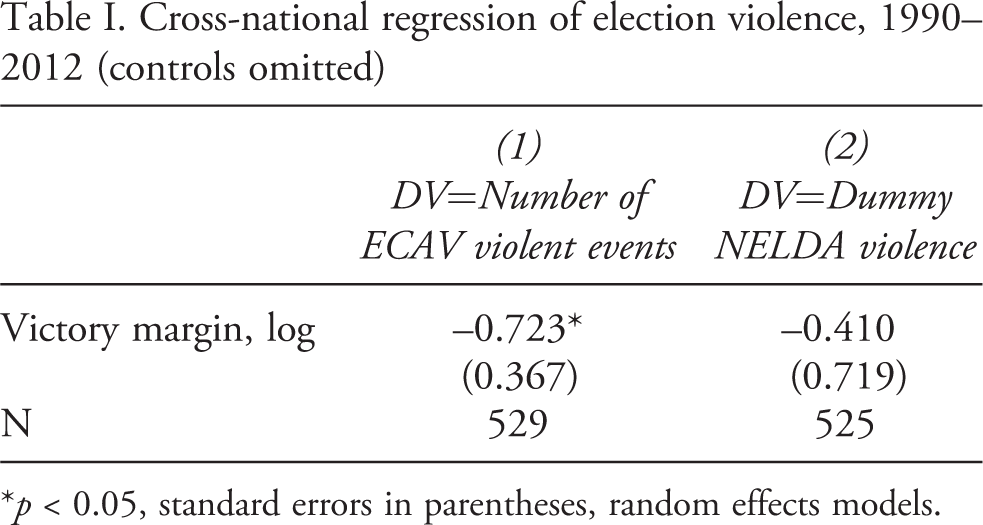
*p < 0.05, standard errors in parentheses, random effects models.
We proceed to the subnational application. A global exploration of subnational implications is not feasible for this data feature because it would require constructing a large dataset consisting of electoral constituencies from many different countries. 22 Instead, we present models examining subnational patterns of electoral competition and violence in India. India should be a most likely case for finding a subnational relationship because it has a parliamentary system with single-member districts. In such elections, violence should be employed in the most hotly contested districts since deterring voters could swing the election in favor of the incumbent.
Results in Table II are based on an analysis of election violence in all constituencies over six national elections held in India 1991–2010. Shapefiles for constituencies come from Sukhtankar (2011) for elections held before 2009, and Susewind (2014) for the 2009 elections. We use all 700 election-related violent events to create the dependent variable. We dichotomize election violence because few constituencies experience more than a few violent incidents per election. We again measure electoral competition by calculating victory margins, subtracting the second-place party’s votes from the winner’s and dividing this number by total votes using data from Bhavnani (2014). We control for gross cell product in 1990, electoral district size, distance from the capital, population, and previous conflict events in the district, and state fixed effects in Model 4. 23
Regression of election violence in India, 1991–2009 (controls omitted)
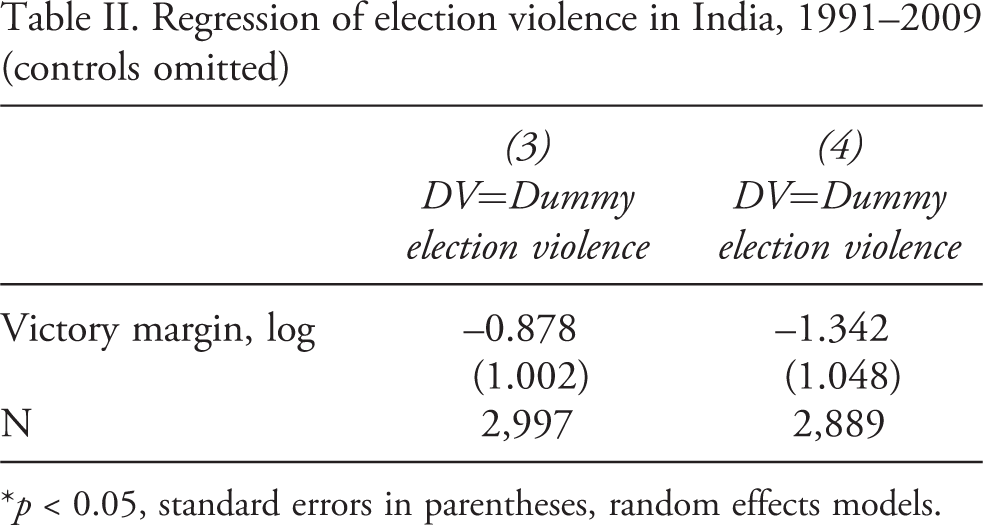
*p < 0.05, standard errors in parentheses, random effects models.
Models 3 and 4 do not confirm an effect of victory margins on election violence. This non-result may be because elites target voters in opposition strongholds rather than competitive districts, or because armed groups aim to disrupt rather than influence elections. A detailed assessment of this finding is beyond the scope of this article, but at least for the Indian case, our results show that cross-national relationships do not necessarily hold subnationally.
Conclusion
The ECAV dataset allows researchers to examine a wide variety of arguments on the causes and consequences of electoral contention. The ECAV dataset covers a global sample from 1990 to 2012, including more than 18,000 nonviolent and violent contentious events related to elections in time and substance, and allows for disaggregation across actors, time, and space. A comparison showed considerable agreement between ECAV and SCAD. Cross-national analyses of electoral competitiveness and violence showed support for existing arguments using the ECAV dataset, but not for other data. Further, the non-finding for a subnational relationship between competition and election violence illustrates the importance of carefully considering the subnational implications of current arguments.
Supplemental Material
Supplemental Material, JPR823870_appendix - Electoral contention and violence (ECAV): A new dataset
Supplemental Material, JPR823870_appendix for Electoral contention and violence (ECAV): A new dataset by Ursula Daxecker, Elio Amicarelli and Alexander Jung in Journal of Peace Research
Footnotes
Replication data
The dataset and files for the empirical analysis in this article, along with the Online appendix, can be found at http://www.prio.org/jpr/datasets. We used Stata for statistical analyses. The ECAV dataset and codebook are available at ![]() .
.
Acknowledgements
Earlier versions were presented at the 2014 European Conflict Network meeting in Uppsala, Sweden and the 2016 Electoral Integrity Project Workshop in Poznan, Poland. We thank Sarah Birch, Kars de Bruijne, Jørgen Elklit, Aurelién Evequoz, Jennifer Gandhi, Corinna Jentzsch, Lee Seymour, and conference participants for comments. We are grateful to Aurelién Evequoz and Samantha Zuhlke for excellent research assistance. We thank Hanan Bahar, Emily van Bronkhorst, Mikaela Burch, Jonathan Busnelli, Henry Chow, Gabrielle Espina, Monika Gyuris, Doran Hanlon, Johan Hansen, Roos Hopman, Marthe Huigsloot, Eva Huis in ‘t Veld, Marketa Kachynova, Ernst Kuneman, Frank van Moock, Toby Murray, Ghis Noorlander, Saskia Olivier, Ebe Ouattara, Wessel van Proosdij, Marta Ill Raga, Isabella Rebasso, Ina Rüber, Niels Snoek, Hannah Soine, Martin Wesseling, and Mark Wittfoth for work on the dataset.
Funding
This project received funding from the Netherlands Organization for Scientific Research (NWO), Innovational Research Incentives Scheme Veni no. 451-13-030 and the European Commission, Marie Curie Career Integration Grant (CIG) no.618422.
Notes
References
Supplementary Material
Please find the following supplemental material available below.
For Open Access articles published under a Creative Commons License, all supplemental material carries the same license as the article it is associated with.
For non-Open Access articles published, all supplemental material carries a non-exclusive license, and permission requests for re-use of supplemental material or any part of supplemental material shall be sent directly to the copyright owner as specified in the copyright notice associated with the article.