
Abstract
Pre-election polls are increasingly being used to forecast and study elections in new and weak democracies yet the tension that surrounds elections in less liberal regimes may make data from such surveys particularly prone to measurement error. Polls conducted before and after the 2011 Ugandan election and data gathered at various points of the election cycles in 34 African countries are compared to show that, before elections, survey respondents become increasingly wary of the interview and its purpose, especially in less liberal regimes. Those who are wary report more support for the incumbent, the incumbent’s policies and the state and effect of wariness on attitudes is significantly higher on surveys that take place immediately before elections. Misreporting increases the estimated level of support for the incumbent, and may also significantly change the apparent correlates of regime support across the election cycle. Ironically, it was found that pre-election polls may be particularly poorly suited to forecasting elections or capturing the effects of campaigns on political attitudes.
As pre-election polling has become more common in new, weak and semi-democracies, the data have been put to immediate use in forecasting elections and as a benchmark for determining whether elections were manipulated (Bratton et al., 2016; Conroy-Krutz, 2013; Perrot et al., 2014). Studies that seek to explain why leaders manipulate elections they would win anyway use pre-election surveys as evidence that the leaders in question are genuinely popular (Gehlbach and Simpser, 2015; Simpser, 2013). Studies on the effects of electoral cycles on attitudes and behaviors capture these effects by comparing pre- and post-election survey data (Cantu and Garcia-Ponce, 2015; Conroy-Krutz and Kerr, 2015; Eifert et al., 2010; Hall et al., 2015; Michelitch and Utych, 2016). Pre-election surveys are also used, either alone or pooled with other survey data, to test general theories of behavior unrelated to elections themselves (Boas, 2005; Bratton, 2008; Lupu, 2013).
Pre-election polls are of clear value in countries where data are scarce, and the proximity of these data to an election makes them particularly attractive for predicting and analyzing election outcomes. Nevertheless, I argue here that the conclusions that have been (or will be) drawn from these data may not be robust, because the very proximity of the surveys to elections makes them especially prone to bias.
Incumbents in illiberal regimes use a variety of tactics to keep citizens from voting for the opposition, and these should also discourage citizens from revealing support for the opposition on surveys. Indeed, where regimes conduct sham elections as a way to identify their opponents or ‘demonstrate’ overwhelming public support (Brownlee, 2011; Knutsen et al., 2017; Magaloni, 2007), the difference between casting a ballot and giving a survey response is not obvious, especially if respondents believe the regime is conducting the survey. 1 A voter who perceives too high a cost in opposing the regime in the privacy of the polling booth is also unlikely to voice opposition out loud to a stranger at their door.
The sensitivity of political surveys should increase in election years because that is also when the consequences of opposition peak. In more repressive regimes, voters have an incentive to avoid reporting opposition to the regime in order to avoid making themselves targets of state-sponsored intimidation and violence, which is greatest in the year immediately preceding an election (Daxecker, 2014; Hafner-Burton et al., 2014). Even where new regimes are not violent, they are likely to be clientelist: access to critical government goods depends on prior support for the ultimate winner of the election, which in illiberal regimes is, by design, most likely to be the incumbent. 2 To prevent defection and reduce post-election free-riding, the incumbent may insist that voters publicly declare their support before the election (Kitschelt and Wilkinson, 2007; Nichter, 2009). Many of the ways in which voters declare – attending rallies or displaying party paraphernalia – are linked specifically to campaign periods, and the arrival of an interviewer during a campaign may be seen as an attempt to garner just such a public declaration.
Where voters understand that supporting the incumbent is the strategic choice, those whose sincere preference is for the opposition have several options, all of which are likely to produce unease. They may tell the truth and accept the risk; they they may lie and suffer cognitive dissonance; or they may try to hide their preference by refusing to answer political questions, while knowing that they may inadvertently reveal their preference anyway. Opposition voters who face consequences for their opposition should therefore be more likely than either sincere regime supporters 3 or opposition voters in liberal regimes to show discomfort or anxiety during the survey. I used an item on the Afrobarometer public opinion poll, which asks the interviewer to note whether the respondent was at ease during the interview, to capture these voters. If the risks of opposing the regime increase during election years, and they are sufficient to reduce stated support for the opposition, we should see that respondents are more likely to be wary immediately before elections, and that those who are coded as wary are more likely to support the regime than similar voters who are less concerned. 4
I compared Afrobarometer data gathered on either side of the 2011 Ugandan election, and data gathered closer and farther from elections in a cross-national sample of 34 African countries. I show that, in accordance with expectations, survey respondents are increasingly likely to be coded as wary in the year before an election, especially in highly illiberal regimes; that those who are wary report more support for the incumbent and his (the incumbent is almost invariably a male) policies despite a likely sincere preference for the opposition; and that wariness has a significantly larger effect on political attitudes on surveys that take place immediately before elections than on those that take place at other times in the election cycle. Though the presence of misreporting on surveys in weak democracies has already been demonstrated (Bratton et al., 2016; Frye et al., 2017; Garcia-Ponce and Pasquale, 2015), my results provide evidence that the extent of bias varies over time, with the worst error occurring in the data we might otherwise find most valuable: those gathered immediately before an election. Misreporting will lead to overestimates of regime support, of unknown magnitude, and may mask or even invert the correlates of regime support, by causing those who are most starkly opposed the regime to offer the most positive evaluations.
The results contrast with findings from Europe, which show data quality improves immediately before elections because campaigns increase information and interest (Banducci and Stevens, 2015). My findings highlight that, in illiberal regimes, campaigns can also increase subjects’ discomfort, reducing data quality overall. Practically, the results indicate the need to be cautious using pre-election polls to predict election outcomes or evaluate their validity. Caution is also needed with regard to publicly releasing these data: polling results that exaggerate support for the incumbent can potentially help him dominate the electoral space and preemptively legitimize manipulated returns. 5 Theoretically, the results present a possible alternative explanation for variations in public opinion across campaign cycles; scholars interested in the effects of campaigns should consider and rule out this possibility, especially when analyzing variables that may plausibly be connected to approval of an illiberal regime.
Misreporting before and after the 2011 Ugandan election
For the analyses presented below, I used the Afrobarometer, a commonly-used publicly-available survey that now covers a majority of African countries. The Afrobarometer is well-established, with similar protocols across country-rounds: data from different Afrobarometer surveys can be credibly compared. Importantly for detecting misreporting, the survey contains a battery of variables on the conditions of the interview and the characteristics of the respondent, including the enumerator’s assessment of whether the respondent was uneasy or wary during the interview. 6 If election campaigns are tense enough to cause systematic misreporting, there should be an increase in the share of respondents coded as ‘wary’ in the pre-election period. When the stakes of publicly supporting the opposition are highest, those who are wary should report more support for the incumbent, and the effect should be stronger before the election.
I first test for exacerbated bias by comparing two surveys that took place before and after a contentious election in a single electoral autocracy; specifically, the 2011 election in Uganda. The first survey, Afrobarometer Round 4.5.2, was the second of two special pre-election polls conducted in the weeks before the February 2011 election. 7 The second is Afrobarometer Round 5, a regularly-scheduled survey that took place less than a year after the election, from December 2011 through February 2012. These surveys are particularly close together by the standards of Afrobarometer surveys. In comparing them, I hold a number of variables constant. The sampling frames were the same for both surveys and the demographic characteristics of the two samples are very similar (see Figure A1 in the online Appendix). The Ugandan party system is also quite stable. The same two major parties, represented by the same two candidates, have competed in every election since 2001.
The surveys provide clear evidence of increased wariness among Ugandans interviewed immediately before the election. On the pre-election survey, a full 30% of respondents were coded as wary, a ten-fold increase over the share of respondents who were similarly coded as wary on the post-election survey less than a year later (3%). Voters in opposition strongholds were 5 percentage points more likely to be coded as wary, significant at the 10% level.
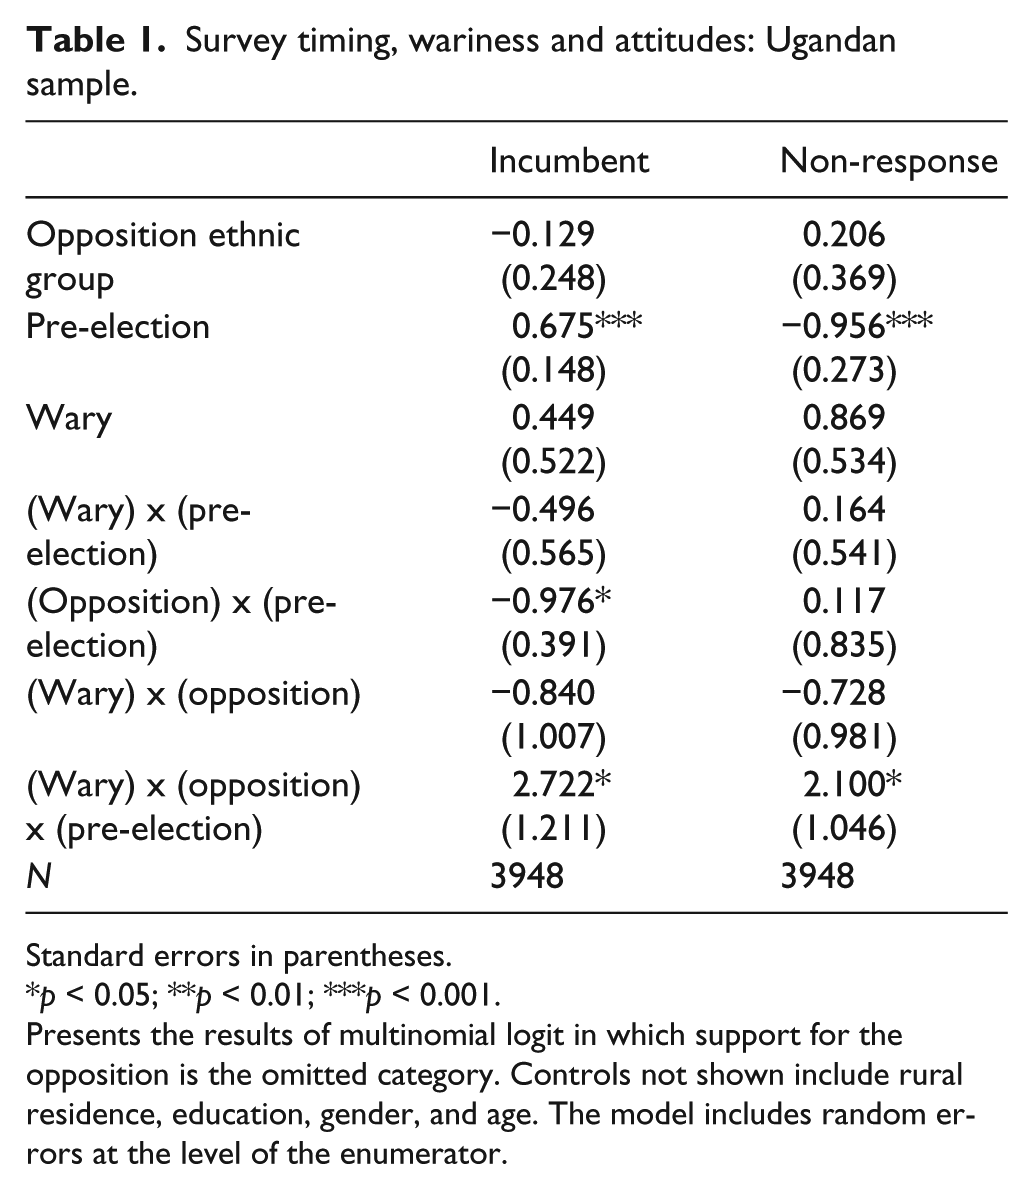
Table 1 and Figure 1 show that, in addition to being more common before the election, wary respondents were far less likely to report support for the opposition before the election, choosing instead to either support the incumbent or refuse to respond. In the model, I isolate those who have a likely sincere preference for the opposition, because these voters have the greatest incentive to misreport in response to repression by the incumbent. I use respondents’ ethnicity as an exogenous proxy for likely opposition support. Three ethnic groups voted as blocs against the incumbent in 2006, 2011 and 2016 – the Itesot and Kumam, in eastern Uganda, and the Acholi in the north. 8 I include a three-way interaction between opposition ethnicity, wariness and the survey round, as well as the interaction’s constituent terms. 9
Survey timing, wariness and attitudes: Ugandan sample.
Standard errors in parentheses.
p < 0.05; **p < 0.01; ***p < 0.001.
Presents the results of multinomial logit in which support for the opposition is the omitted category. Controls not shown include rural residence, education, gender, and age. The model includes random errors at the level of the enumerator.

Effect of wariness on vote choice, by ethnicity, pre- and post-election.
Table 1 presents the results of a multinomial logit with three choices: the incumbent president; the leader of the opposition; or refusal or non-response. 10 Support for the opposition is the omitted category. Figure 1 plots the effect of wariness on reported support for the opposition, by opposition and non-opposition ethnic groups, before and after the election. I control for education, urban residence, age and gender; the full models including controls are shown in Table A.1 in the online Appendix.
The results show that wariness induces respondents with a likely sincere preference for the opposition to hide that preference immediately before the election. As shown in Figure 1, wariness does not significantly affect vote choice for those not of opposition ethnic groups, nor does it affect voting choice after the election is over. Before the election, however, wary voters in opposition strongholds are significantly less likely to say they support the opposition. Wary opposition voters on the pre-election survey were an estimated 25 points less likely to report an intention to vote for the opposition, 6 points more likely to report support for the incumbent and 20 points more likely to refuse to answer: systematic non-response by opposition supporters further increases the incumbent’s share of those who report a preference. 11 Opposition voters who did not appear concerned, in contrast, were 20 points more likely than other voters to report support for the opposition, just as we would expect from voters who are not falsifying their preferences.
Alternative Sample and dependent variables
Uganda is among one of Sub-Saharan Africa’s more repressive regimes, and voter intentions may be particularly sensitive because the question is so overt, raising concerns that the results above are not typical. I provide evidence of falsification of pre-election preference on the full cross-national Afrobarometer sample, and for a set of dependent variables from which one could infer that a respondent might plan to vote against the regime, but which do not require the respondent to directly make such a statement. I used Afrobarometer Round 5 (2011–2013), which includes 35 countries which range from 0.07 to 0.78 on V-Dem’s liberal democracy score 12 for 2012. I created an indicator for every round that took place within a year of a presidential or general election, 13 and interacted this with the respondent-level wariness dummy used above. Unlike in the model above, I did not include the additional interaction with likely opposition support, in part because likely opposition supporters are not necessarily as identifiable in other countries as they are in Uganda, and in part because the dependent variables are scales rather than discrete choices and so there may be measurable pro-incumbent movement, even for those who already weakly favor the regime. 14
As in the Ugandan sample, the share of respondents coded as wary increases significantly as elections near: respondents interviewed in the year before an election were 5 points more likely to be coded as wary. Not surprisingly, the effect is driven almost entirely by less liberal regimes: an interaction term between the survey timing and V-Dem score is large and highly significant. In regimes less liberal than the median, respondents are 11 points more likely to be coded as wary on surveys that take place during an election year. In the most liberal regimes, the share of wary respondents is roughly the same during election and non-election years. This provides additional evidence that increased wariness before an election is a response to increased repression by the incumbent.
The results in Table 2 and Figure 2 confirm that wary respondents in the full sample give more pro-incumbent responses even when they are not directly asked who they will vote for, and that the extent of misreporting increases in election years. The dependent variables in these analyses include approval of the incumbent’s performance; assessment of how often the incumbent ignores the law; overall satisfaction with democracy; and perceived government discrimination against the respondents’ ethnic group. 15 The results shown in Table 2 are generated from a logit model with random effects at the level of the enumerator, which are perfectly nested within countries. 16 The figure provides the effect of wariness on these variables during election and non-election years. The effects of controls including rural location, education, gender, age, V-Dem score and a dummy for North Africa, are shown in Table A.2 in the online Appendix.
Survey timing, wariness and attitudes: full Afrobarometer sample.

Standard errors in parentheses.
p < 0.05; **p < 0.01; ***p < 0.001.
Presents the effect of wariness on reported attitudes, conditional on the proximity of an election. Controls not shown include rural location, education, gender, age, poverty, religion, V-Dem score and a regional dummy for Middle East–North Africa. The model is a logit model with random effects at the level of the survey enumerator.

Effect of wariness on attitudes, election and non-election years.
The results show that those who were coded as wary were significantly more likely to give pro-incumbent responses on surveys in the year before an election. In non-election years, wary respondents are neutral to negative about the incumbent, with significantly more complaints about violation of rule of law and discrimination. In election years, however, wary respondents are far more likely than non-wary respondents to say they approve of the incumbent and are satisfied with democracy, far less likely to say the incumbent violates the law, and equally likely to say that they are discriminated against.
Ruling out alternative explanations
The results above indicate that those coded as wary are more positive toward the incumbent during election years, which I have taken as evidence of misreporting by respondents. One possible alternative explanation for this pattern is that these respondents actually changed their minds immediately before the election, perhaps because the incumbent was an adept campaigner. In this case, however, there should be an increase in support for the incumbent among all respondents, not just the wary ones. The results in Tables 1 and 2 show that those who were not coded as wary actually became significantly less supportive of the incumbent during election years.
A second alternative explanation is that the number of those coded as wary increased in the pre-election period, to include respondents who supported the incumbent, perhaps because it was the opposition that was engaging in intimidation or clientelism. 17 If this were the case, we would expect that those coded as wary would be more likely to believe they were being monitored by the opposition during election years. The opposite is true, however: wary respondents on pre-election surveys were significantly more likely than either non-wary respondents or those interviewed after an election to say that they believed the government sent the enumerator to interview them. Indeed, replacing enumerator-coded wariness with self-reported government monitoring generates substantively similar results (though not all variables retain significance), providing evidence that wariness is capturing increased monitoring by the state (see Tables A.5 and A.6 in the online Appendix).
A final alternative explanation is that voters decide to vote for the incumbent because they are given a bribe to do so, but that bribes are targeted to the same types of people who are more likely to be coded as wary (e.g. young men), so that only these types of voters change their minds. Controlling for self-reported receipt of a ‘voting incentive’,and specifically receipt of an incentive in an election year, fails to reduce the increased impact of wariness on pre-election surveys, in both samples (see Tables A.7 and A.8 in the online Appendix.) Wariness is therefore not a proxy for receipt of a payout.
Substantive implications
The first implication of the above analysis is that surveys conducted in election years will tend to overestimate support for the incumbent. Without an objective measure of voters’ preferences (e.g. non-manipulated voting returns), it is impossible to determine the precise magnitude of the overestimation in a given country: if those coded as wary are the only respondents at risk of misreporting, then the total error may be small, especially in more liberal regimes. However, we cannot know from these data how many respondents felt they were being monitored, and misreported accordingly, without betraying their anxiety to the enumerator. Indeed, the share of those who believed they were being interviewed by the government (62%) was far higher than the share who were coded as overtly wary, as is the share of people who reported that one must ‘be careful what you say about politics’ (64%). If these respondents are also inclined to misreport, attitudes among ‘non-wary’ respondents may already contain pro-incumbent bias, and the extent of overestimation may be substantial enough to meaningfully affect the predicted outcome of an election.
More importantly, bias is likely to be systematically higher among certain types of respondents, potentially changing our substantive conclusions about the demographic correlates of attitudes in pre-election data. In Tables 3 and 4, I show that two demographic characteristics that have significantly different effects on surveys conducted during election years – gender in Uganda and education in the full sample – are also significant predictors of pre-election wariness. It is possible that different groups respond differently to electoral campaigns, but it is also possible that the changes are artifacts of variable rates of misreporting across groups.
Correlates of wariness and political attitudes: Ugandan sample.

Standard errors in parentheses.
p < 0.05; **p < 0.01; ***p < 0.001.
Presents the results of logit models in which respondent’s wariness and respondent’s reported support for the ruling party are the dependent variables. Data are from Rounds 4.5.2 and Round 5 of the Uganda Afrobarometer.
Correlates of wariness and political attitudes: full Afrobarometer sample.

Standard errors in parentheses.
p < 0.05; **p < 0.01; ***p < 0.001.
Presents the effect of wariness on reported attitudes, conditional on the proximity of an election. Controls not shown include rural location, education, gender, age, poverty, religion, Polity score and a regional dummy for Middle East–North Africa. The model is an OLS with random effects at the level of the survey enumerator.
Model 1 of Table 3 identifies who was most likely to be coded as wary on the pre- and post-election rounds in Uganda. The results indicate that while men and women were similarly wary after the election, women were significantly less likely than men to be coded as wary before the election, possibly because men are the primary targets of pre-electoral violence (Bardall, 2011). This suggests that men will disproportionately give pro-incumbent responses on the pre-election survey, but not on the post-election survey, altering the effect of gender on regime support. Indeed, in Model 2, I show that the impact of gender on reported support for the incumbent reverses across the waves: before the election men were 5 percentage points more likely to report an intention to vote for the incumbent, while after the election, women more likely to support the incumbent. Models 3 and 4 show a similar reversal across waves on two variables that recent literature has linked with gender: political interest, and policy priorities (Coffe and Bolzendahl, 2011; Gottlieb et al., 2016; Isaksson et al., 2012; Logan and Bratton, 2006). 18 In other words, the effect of gender on Ugandans’ attitudes is highly conditional on the timing of the survey, and this is plausibly the result of changes in the extent of misreporting by men and women.
In Table 4, I show a similar pattern in the full Afrobarometer sample. Model 1 in Table 4 indicates that younger, rural and less-educated respondents are particularly likely to be coded as wary, especially before the election. Model 2 shows that one of these factors – education – also had a significantly stronger effect on predicting presidential approval on pre-election surveys. During non-election years, those with no formal education were only 4 points more likely to approve of the incumbent than those with a secondary degree. During election years, this difference increases to ten points. Models 3 and 4 of Table 4 show a similar pattern for two additional outcomes associated with education – satisfaction with democracy (Bratton and Mattes, 2001; Doorenspleet, 2012) and political interest (Croke et al., 2016; Keller, 1980). Whilst it is certainly possible that campaigns have differential effects on the more- and less-educated, an alternative explanation may be that highly educated respondents are less wary about reporting support for the opposition, while less-educated respondents feel increasingly vulnerable as elections approach.
Conclusion
The results of the above analysis show that wary survey respondents in Africa’s new democracies are more likely to give pro-incumbent survey responses, and that both the share of wary respondents and the extent of misreporting among these respondents increases immediately before elections, when the risks of publicly opposing the regime are highest. The results do not necessarily capture the full extent of misreporting in these data: there may be respondents who falsify their preferences without appearing wary to the enumerator, and there is little way to tell who these respondents are. Rather, the results demonstrate that whatever bias there is in the data, it is likely to be greatest on surveys that take place immediately before elections.
Using pre-election data naively may cause analysts to overestimate support for the incumbent, especially in repressive regimes, with resultant implications both for forecasting and for explaining the apparent popularity of semi-autocratic leaders. Comparing pre- and post-election polls may cause scholars to attribute to shifting attitudes what is actually differential misreporting, especially when the comparison shows an apparent increase in anti-incumbent views after the election. Data gathered immediately before elections in weak or clientelist democracies should be analyzed in light of the potential for exacerbated bias. Those with a choice of polling data should consider using data gathered at other times, even for election-related inquiries. In addition, cautions should be exercised with regard to releasing pre-election data: though the results are mixed, it is possible and plausible that releasing poll results that inflate support for the incumbent may further demobilize opposition supporters (Goeree and Großer, 2007; Marsh, 1985). To the extent that the specter of a landslide victory for the incumbent further increases the costs of persisting in open opposition to the regime, the release of biased polls may actually help convince opposition voters to capitulate, creating the very conditions it purported to measure.
Supplemental Material
RAP774728_Supplementary_Material_REV1 – Supplemental material for The perils of pre-election polling: Election cycles and the exacerbation of measurement error in illiberal regimes
Supplemental material, RAP774728_Supplementary_Material_REV1 for The perils of pre-election polling: Election cycles and the exacerbation of measurement error in illiberal regimes by Elizabeth Carlson in Research & Politics
Footnotes
Declaration of conflicting interests
The author(s) declared no potential conflicts of interest with respect to the research, authorship, and/or publication of this article.
Funding
The author(s) received no financial support for the research, authorship, and/or publication of this article.
Supplementary material
The supplementary files are available at: http://journals.sagepub.com/doi/suppl/10.1177/2053168018774728. The replication files are available at: ![]() .
.
Notes
Carnegie Corporation of New York Grant
This publication was made possible (in part) by a grant from Carnegie Corporation of New York. The statements made and views expressed are solely the responsibility of the author.
References
Supplementary Material
Please find the following supplemental material available below.
For Open Access articles published under a Creative Commons License, all supplemental material carries the same license as the article it is associated with.
For non-Open Access articles published, all supplemental material carries a non-exclusive license, and permission requests for re-use of supplemental material or any part of supplemental material shall be sent directly to the copyright owner as specified in the copyright notice associated with the article.