
Abstract
State governments are now the principal source of immigrant legislation in the US. Existing research presents contradictory findings concerning the sources of pro- and anti-immigration state legislation. However, research has not adequately accounted for the multidimensional nature of immigrant legislation and the fact that many variables hypothesized to affect state legislation encompass both within-state, time-varying effects and time-invariant, cross-sectional effects. Measurement and research design strategies to address these problems are applied to a dataset of state immigrant legislation approved between 2005 and 2012. The findings are important because they show that partisan, demographic, and economic effects are often different within versus across states and may differently affect the volume versus the relative tenor of legislative output.
Introduction
The paralysis of US immigration policy at the federal level now means that policymaking is centered at the state level, where legislatures have passed thousands of laws addressing immigrant-related issues over the past decade. Explaining disparate state responses to immigration has been the focus of a growing body of research, with some researchers focusing on the rise of anti-immigration state laws (Ybarra et al., 2016; Zingher, 2014; Marquez and Schraufnagel, 2013; Reich and Barth, 2012; Turner and Sharry, 2012; Schildkraut, 2001) and others emphasizing the relative mix of pro- and anti-immigrant state legislation (Gulasekaram and Ramakrishan, 2015; Rivera, 2014; Monogan, 2013; Nicholson-Crotty and Nicholson-Crotty, 2011; Boushey and Ludtke, 2011).
Because the growth of state immigration legislation followed the expansion of immigration flows into states that had little past experience with immigration, a key issue within existing research has been the extent to which state activism reflects demographic pressures resulting from increases in immigration versus a politically-motivated shift towards either punitive or accommodating policies (Gulasekaram and Ramakrishnan, 2015). Existing research has yielded contradictory findings. Gulasekaram and Ramakrishnan find restrictive legislation unrelated to state demographic change but rather a function of polarized partisan politics. By contrast, Monogan (2013), Nicholson-Crotty and Nicholson-Crotty (2011), and Boushey and Luedtke (2011) generally find partisanship unrelated to state legislation, with Boushey and Luedtke presenting evidence that larger immigrant populations induce more integrative state legislation. However, their results also suggest that larger foreign-born populations were significantly related to restrictive legislation and that the growth of immigration was positively related to both integration and control policies. Zingher (2014) finds that both legislative conservatism and the growth of immigration propelled restrictive legislation while Marquez and Schraufnagel (2013) and Ybarra et al. (2016) present evidence of a more focused backlash against Hispanic immigrants. However, Marquez and Schraufnagel’s results again suggest a contradiction, with the growth of state Hispanic populations also associated with increases in pro-immigrant legislation.
An unresolved problem in existing research is the failure to address two sources of causal heterogeneity. First, existing studies often fail to consider whether increased legislative activity necessarily alters the overall tenor of state legislative output. Because immigrant legislation spans multiple issue areas (education, health care, law enforcement, labor laws, professional licensing, welfare benefits), states produce varying mixes of accommodating and restrictive legislation. As a result, an increased volume of one type of law (restrictive or accommodating) may not necessarily change the relative tenor of state immigrant legislation. Thus, research designs should consider whether variable effects are presumed to affect the volume of immigrant legislation, the overall tenor of legislation, or both.
Second, researchers have generally ignored cross-state versus within-state causal effects at the state level. Individual predictors at the state level often simultaneously encompass short-term changes observed within a state over a given period of time—such as changes in the growth of immigrant populations or partisan control of government—and cross-sectional effects that are static over the course of most observational studies: the same variable also registers that some states are whiter, more Republican, or have larger immigrant populations than others. The problem is that in the presence of both causal effects, as Bell and Jones (2015) show, a single measure represents an uninterpretable, weighted average of these two effects. In situations where variables encompass both a time-varying, “within-unit” process as well as a time-invariant, “between-unit” effect, Bell and Jones argue for a random effects estimation strategy that separately measures these two effects. This approach creates separate coefficients that distinguish time-variant and time-invariant effects. “Within-unit” effects for each time-varying independent variable are calculated by subtracting the (in this case) state mean from the value of each observation:

where each i represents an observation—here, a legislative year—of variable x in state j and
Independent variables
Between-state variables
Many variables that have figured prominently in recent research differ across states, but not (over the course of existing observational studies) within states, including the following variables:
(1) Institutions of direct democracy (Turner and Sharry, 2012; Reich and Barth, 2012 Schildkraut 2001). Differences in the presence and strength of direct democracy are captured here via Lewis’s (2011) “Direct Democracy Impact” measure, normalized to range from 0 (No citizen initiatives) to 5 (Highly influential direct democracy). 1
(2) Legislative professionalism (Monogan, 2013). Squire’s (2007) measure of legislative professionalism (measured here as 0 through 100) captures differences between professional and citizen legislatures over the period 2005 through 2012. This variable is a weighted combination of legislative salary, days in session, and staff per legislator (as compared with members of Congress during the same year).
(3) The growth of the state Latino population, 2000–2010 (Ybarra et al., 2016; Marquez and Schraufnagel, 2013). This variable is included to capture the specific effect of Latino immigration, which may differ from that of immigration among all nationalities (see below) and has been linked to restrictive legislation. 2
(4) Citizen ideology (Monogan, 2013). This is measured as the percentage of the state population in 2005 that self-identified as liberal, based on public opinion data used by Pacheco (2011).
(5) Immigrant State Welfare Eligibility (Filindra, 2013; Hero and Preuhs, 2007). The 1996 Personal Responsibility and Work Opportunities Reconciliation Act (PRWORA) afforded states discretion to define standards for immigrant welfare eligibility. The welfare policies that states established in the period following PRWORA can be seen as establishing a baseline level of accommodation or restriction that may influence subsequent legislation; thus, the direction of legislation between 2005 and 2012 may display continuity with immigration welfare policy regimes established post-PRWORA. State variations in defining immigrant welfare eligibility are captured via Hero and Preuhs factor-score measure, which is based on nine welfare-related policy items and ranges from -1.11 (exclusive) to 1.67 (inclusive). 3
Within-state variables
Other variables identified in recent research contain both a cross-sectional and a time-varying effect, with the time-varying component measuring changes within states between 2005 and 2012:
(1) Percent foreign-born population (Nicholson-Crotty and Nicholson-Crotty, 2011; Boushey and Ludtke, 2011; Monogan, 2013). 4 Note that the cross-state average measures the “stock” of immigrants between 2005 and 2012, while the within-state variable measures changes in the size of the immigrant population (the “flow” component) during that same period.
(2) Change in per capita state income, lagged one year (Filindra and Pearson-Moskowitz, 2013; Ybarra et al., 2015). 5
(3) Republican party control (Zingher, 2014). Two measures operationalize this effect: the percentage of Democratic state legislators (averaged over both state legislative chambers), and Republican control of both the executive and legislative branches (measured dichotomously).
(4) Latino legislative representation (Preuhs, 2007), measured as the percentage of Latino state legislators, averaged over both legislative chambers. 6
Dependent variable and estimation procedure
The dependent variables are derived from an original coding of 1393 laws approved by state legislatures between 2005 and 2012. 7 The data is grouped by state and legislative year, yielding 371 observations across 8 years (see Table A1 in online appendix for additional information on the coding protocol and a summary of laws approved in each state). 8 Two types of laws are analyzed. Accommodating legislation sought to make public services, employment, state licenses, and housing more accessible to immigrant populations, regardless of their legal status. Restrictive legislation sought to bar access to the same goods and outcomes and/or enlisted state and local law enforcement in efforts to identify unauthorized immigrants. Following most recent work on state immigration legislation (Ybarra, 2015; Marquez and Schraufnagel, 2013; Nicholson-Crotty and Nicholson-Crotty, 2011; Boushey and Ludtke, 2010), unweighted counts of each type of law are used; the presumption is that counts of legislative output speak meaningfully to the importance of immigrant-related issues across legislatures as well as the policy intentions of legislators. 9
As is common with panel data, the counts of accommodating and restrictive state legislation are “overdispersed” (the variance is greater than the mean). Following Gelman and Hill (2007: 326) and Bell and Jones (2015: 147), overdispersion is incorporated directly by including random effects at both the state and the observation level, yielding a three-level, Poisson regression:


In this model, the number of laws approved in legislative year i in state j (Yij) is a function of the vector of “between-state” (αj) and “within-state” covariates, βij. The between-state components include the state-level means
Findings: Revisiting state legislation
Table 1 provides both the incidence rate ratio (IRR) and standard deviations for each variable, with asterisks indicating particularly robust directional effects: for a positive (negative) posterior mean, it indicates that less than 5% of its posterior distribution contains negative (positive) values. 13 Models 1 and 2 illustrate the importance of distinguishing cross-sectional from time-varying effects. Model 1 suggests that the count of accommodating legislation increased with the share of Democratic legislators within a state: each percentage increase in Democratic legislative representation increased the count of accommodating laws by approximately 5% per year. However, the “between state” coefficient shows that states that averaged higher Democratic representation over the period 2005 to 2012 were actually associated with a 2% reduction in the annual count of accommodating legislation.
State immigration legislation, 2005–2012 (Markov Chain Monte Carlo posterior incidence rate ratios and standard deviations).
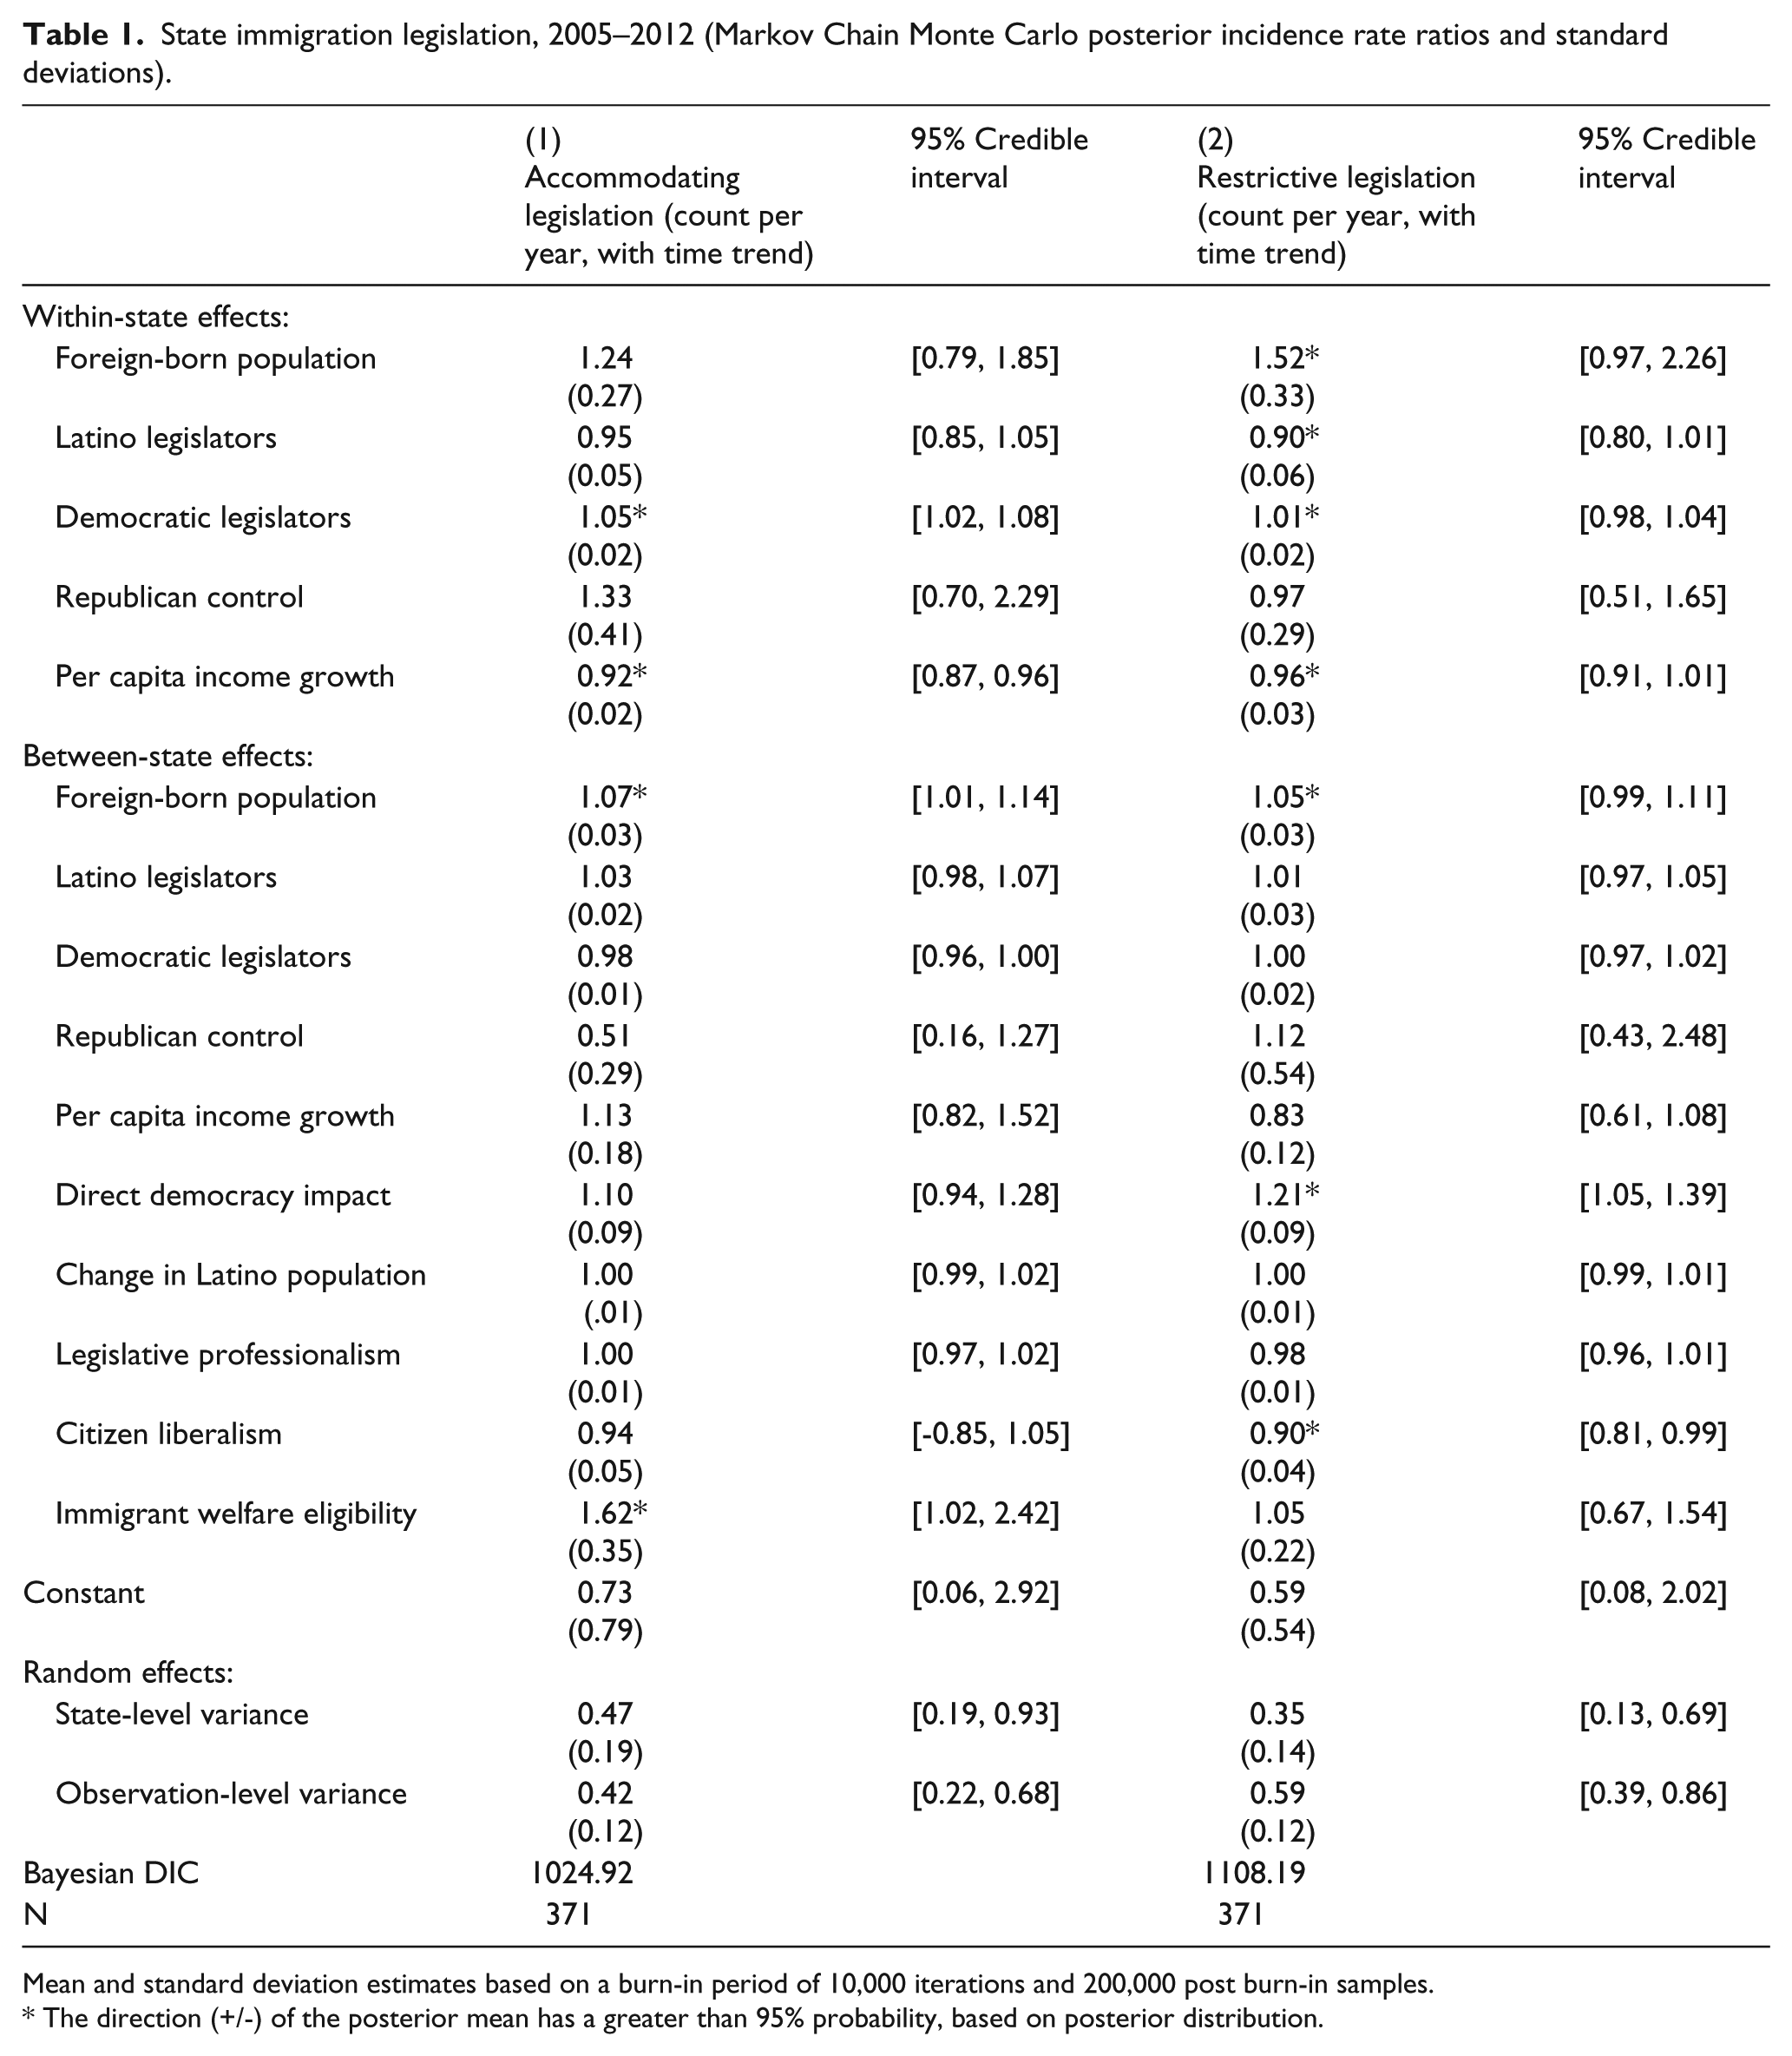
Mean and standard deviation estimates based on a burn-in period of 10,000 iterations and 200,000 post burn-in samples.
The direction (+/-) of the posterior mean has a greater than 95% probability, based on posterior distribution.
Demographic and economic effects are also marked by different within- and between-state effects. Within states, restrictive laws increased by 52% for every percentage increase in the immigrant population. But states with larger immigrant populations passed more of both types of immigrant legislation: the average size of the immigrant population was associated with a 5–7% annual increase in both restrictive and accommodating legislation. Changes in state per capita income were also related to immigration legislation, consistent with Ybarra et al. (2016). However, their study only examined punitive state laws. By contrast, Models 1 and 2 show that each percentage increase in per capita income (the “within-state” effect) is associated with, respectively, a 4% and 8% decrease in both accommodating and restrictive legislation, suggesting that immigrant legislation became less salient to legislators as state income grew. These distinctions were not possible in existing research, either because researchers collapsed state legislative output over multiple years (losing the time component) or did not distinguish within- versus between-state variable effects.
Other variables in Models 1 and 2 are more closely associated with one type law than the other. Citizen ideology, direct democracy, and the share of Latino legislators are strongly associated with counts of restrictive legislation, but less so with accommodating legislation. In Model 2, restrictive legislation increased by 21% for each unit increase in Lewis’s six-point “Direct Democracy” index, and decreased by 10% for each percentage increase in citizen liberalism and Latino representation. The credible interval indicates a greater than 95% posterior probability of these directional effects. By contrast, accommodating legislation is closely associated with more generous welfare benefits for immigrants: each percentage increase in the IW eligibility scale increased the count of accommodating laws by 61%, which translates into 1.7 more accommodating laws per legislative year from the lowest to highest observed values of the scale. Still other variables commonly cited in existing research, such as legislative professionalism, the growth in state Latino populations, and Republican control, had more ambiguous effects, with wide credible intervals that encompassed both increases and decreases in each type of immigration legislation.
Of course, as argued above, changes in the volume of each type of law do not address shifts in the relative balance of legislative output. Table 2 uses a multinomial logistic model to compare three legislative outcomes. In some instances, legislatures approved more restrictive (R) laws than accommodating (A) laws. This outcome, R>A, constitutes the base category in Table 2, and is contrasted to outcomes in which accommodating legislation predominated (A>R), and accommodating and restrictive laws were approved in equal numbers (A=R). 14 Relative risk ratios (RRR) estimate the effect of a one-unit change in each variable on the probability of the A>R and A=R outcomes relative to the base category, holding all other variables constant.
Relative balance of restrictive (R) versus accommodating (A) legislation (Markov Chain Monte Carlo posterior relative risk ratios and standard deviations).

Mean and standard deviation estimates based on a burn-in period of 10,000 iterations and 200,000 post burn-in samples.
The direction (+/-) of the posterior mean has a greater than 95% probability, based on posterior distribution.
The results suggest that partisan effects were important to the relative balance of laws, consistent with Gulasekaram and Ramakrishnan (2015), but in nuanced ways. In states where Republican control of legislative and executive branches was more common, the odds of a relatively accommodating outcome (A>R) were 81% lower (RRR = 0.19) compared to the “restrictive dominant” (R>A) outcome, a directional effect with a greater than 99% posterior probability (PP). A similar, but weaker directional effect occurs between the “neutral” outcome (A=R) and the R>A base category (RRR = 0.45, PP = 82%). Thus, although Table 1 suggests that Republican control of state government was not strongly associated with the volume of either accommodating or restrictive legislation, Table 2 suggests that it moved the balance of legislative output in a restrictive direction. Likewise, within states, each percentage increase in Democratic legislative representation increased the odds of the accommodating outcome over the restrictive base outcome by 8% (PP = 99%) and by 5% for the A=R outcome (PP = 83%). However, legislatures that averaged higher Democratic representation across the period 2005 to 2012 were actually less likely to shift toward a relatively more accommodating stance. Taken together, Tables 1 and 2 suggest an interesting legislative dynamic: more Democratic-leaning states were actually less likely to adopt a more accommodating tone toward immigrants, except as the share of Democratic legislators within the state increased.
Table 2 further clarifies the directional effects of economic and demographic variables. As the average size of the foreign-born population increased, states were more likely to be, on balance, accommodating (RRR = 1.06, PP = 92%) or neutral (RRR = 1.12, PP = .95%) rather than restrictive. Likewise, each percentage increase in average per capita income increased the odds of the more accommodating outcome (A>R) over the restrictive outcome by 59% (PP = 99%), and the neutral outcome by 90% (PP = 99%). Thus, larger average foreign-born populations raised legislative output while higher average per capita income reduced output (Table 1); however, both variables were positively associated with a shift toward less restrictive outcomes, consistent with Boushey and Luedtke (2011) and Filindra and Pearson-Merkowitz (2013).
Table 2 also suggests hypotheses regarding the political processes producing each outcome. The odds of the A>R outcome compared to the R>A base outcome approximately doubled (RRR = 1.96, PP = 99%) for each unit increase in the Immigrant Welfare State and increased by 5% with average Latino legislative representation (PP = 99%). Each percentage increase in Latino representation within states further increased the relative probability of the accommodating outcome over the restrictive outcome by 18% (PP = 88%). Thus, growing Latino representation decreased the volume of restrictive legislation (Table 1) and tilted state legislation toward a relatively more accommodating balance (Table 2). By contrast, more direct democracy decreased the odds of the accommodating and neutral outcomes by, respectively, 11% (PP = 87%) and 20% (PP = 92%) compared to the base outcome. In short, a restrictive outcome was less likely where states implemented more inclusive post-PRWORA welfare benefits for immigrants and where Latinos were a larger and growing share of state legislators. By contrast, stronger institutions of direct democracy reduced the odds of either the accommodating or neutral outcomes compared to the more restrictive outcome.
Naturally, the results here are time-bound, encompassing an eight-year period when the forces of immigration restriction were extremely influential in Republican state politics; and because there is no uniform standard for classifying state legislation, results may vary according to how researchers classify state legislation. However, the findings here suggest two guidelines that would provide more clarity and consistency to future research. First, given the multidimensional nature of immigrant legislation, causal arguments need to distinguish variable effects on the volume of legislation versus the relative balance of laws. Understanding whether states end up moving toward a relatively restrictive set of policies (e.g., Arizona), more accommodating policies (California), or some intermediate outcome depends on this distinction. Second, research would benefit from a clearer distinction of within- and between-state variable effects where variables encompass both processes. Substantively, many explanatory variables simultaneously measure the “pull of history”—relatively enduring contextual differences across states—as well as short-term economic, political, and demographic shifts. The forces may exert different directional effects on legislation, a fact that is obscured when research designs include no time component or when variables measure an uninterpretable average of both effects.
Footnotes
Appendix
Correction (June 2025):
Declaration of conflicting interest
The author(s) declared no potential conflicts of interest with respect to the research, authorship, and/or publication of this article.
Funding
The author(s) received no financial support for the research, authorship, and/or publication of this article.
Notes
Carnegie Corporation of New York Grant
This publication was made possible (in part) by a grant from Carnegie Corporation of New York. The statements made and views expressed are solely the responsibility of the author.