
Abstract
Economic development incentives target individual firms for financial or non-financial benefits to induce capital investment or job creation. Previous studies have found a mixed impact of incentives on economic development, with numerous studies pointing to no impact of incentives on economic growth or job creation. I add to this literature by analyzing two different state economic development incentive programs using the same methods and time-period, allowing for direct comparability. My analysis is the first, “pre-registered” study of incentives, where all of the data collection, design and methodological decisions were made and documented prior to receiving the data. Using a pre-registered matching method design, I estimate the impact of Maryland and Virginia’s flagship economic development incentives on job creation. My main finding is that these incentive programs had essentially zero impact on job creation when they are compared to a control group of similar firms. My secondary results find that even after removing firms from the analysis that were subject to “clawbacks” based on non-compliance with the incentive agreement do not improve the overall performance of the program.
Introduction
Firm-specific incentives ranging from tax abatements to grants have become a ubiquitous tool of economic development for cities and states 1 . These programs target firms for special benefits, such as tax abatements or grants, to induce companies to relocate, expand existing operation, or preempt an existing company from moving elsewhere. Politicians’ enthusiasm for these programs is not being driven by academic studies highlighting their effectiveness. Numerous studies find that these incentive programs have limited impact on investment decisions and that the programs’ price tag often exceeds their benefits (Jensen, 2017).
I make two advances from previous studies. First, I use the same methods and data sources to generate two comparable estimates of the job creation impacts of these different state programs during the same estimation window (2006–2012). For both studies, I compare the job creation performance of incentivized firms with a control group of firms using the same variables for matching.
Second, my analysis, to my knowledge, is the first “pre-registered” study of the impact of investment incentives. My data collection methods, coding decisions, and estimation strategy were all pre-specified prior to data collection. My pre-registration document (archived prior to receiving the data) identifies my research design of matching incentivized firms to non-incentivized firms using coarsened exact matching (CEM) to compare firms receiving incentives with a control group of firms. My pre-registration document provided full details on my estimation strategy and mock tables that were left blank. These tables, complete now with estimates of the impact of incentives on job creation, are central to this paper (Table 1 and Table 2). I supplement this analysis with additional analysis in the online appendix.
Matching estimates of job creation (Virginia).

Note: Models 1 and 2 are OLS regressions with the natural log of 2015 employment as the dependent variable. Models 3-5 present coarsened exact matching estimates using the natural log of 2006 employment, a dummy for subsidiary (as opposed to a parent firm), and three-digit Standard Industrial Classification dummy variables.
Matching estimates of job creation (Maryland).

Note: Models 1 and 2 are OLS regressions with the natural log of 2015 employment as the dependent variable. Models 3-5 present coarsened exact matching estimates using the natural log of 2006 employment, a dummy for subsidiary (as opposed to a parent firm), and three-digit Standard Industrial Classification dummy variables.
My findings cast considerable doubt on the effectiveness of these programs in generating new employment in the short run. For both the Maryland and Virginia programs, the pre-registered design finds that incentivized firms have no greater proclivity to generate jobs than comparable firms that did not receive incentives. Additional analysis, presented in the Robustness sections, finds more mixed evidence on the effectiveness of incentives, but the substantive sizes of the estimates are very small.
To assure compliance with incentive agreements, both Virginia and Maryland monitor performance (including job creation) and have the ability to cancel incentive agreements and claw back incentive rewards. Even when I purge these worst performing companies from the data set, I still find little evidence that these incentives generate jobs.
My findings provide further criticisms of incentive programs using a pre-registered research design although this analysis is not without limitations. In the conclusion, I provide a discussion of potential avenues for future research and describe how pre-registration can be used for internal evaluations or government oversight of incentive programs.
Theory and context
Economic development incentives have become one of the most common tools utilized by US states and municipalities to help generate jobs, costing an excess of $50 billion a year (Thomas, 2000). Jensen et al., (2015) reviews research on incentive programs across the globe, finding a common pattern of the ineffectiveness of these incentives. 2 This is at least partially due to the “redundancy” of incentives, where research such as James (2009) shows that 70% of incentives are allocated to companies that were already going to invest or expand. Thus, they are provided incentives for engaging in an activity that they would have done absent incentives. To quote Paul O’Neill, former chief executive officer of Alcoa, “As a businessman I never made an investment decision based on the tax code. If you give money away I will take it, but good business people don’t do things because of inducements” (O’Brian, 2006). Reading the overall evidence on these incentives programs leads many scholars to express skepticism towards the use of incentive programs. One of the most recent works on the subject by Greenbaum and Landers (2009) uses the provocative title: “Why Are State Policy Makers Still Proponents of Enterprise Zones? What Explains Their Actions in the Face of a Preponderance of Research?”. Recent work has suggested that the competition for investment has led to a “cycle of destructive competition” in the use of incentives (Zheng and Warner, 2010).
Despite these general findings in the literature, there is considerable heterogeneity in the impact of incentives across studies, partially due to the different time periods and research methods used to analyze incentives (see Buss, 2001). In this paper, I examine two separate incentive programs, estimating the impact of the programs on job creation in Virginia and Maryland, and complement published work on the main Kansas economic development program (Jensen, 2017). Do these incentive programs generate jobs or do they incentivize companies that were already expecting to create jobs? This leads to the main hypothesis; in this paper:
H1: Firms that receive incentives generate more jobs than a matched set of firms that did not receive incentives.
This main hypothesis is important for our understanding of incentive programs, but as outlined in the pre-registration document, numerous governments and economic development agencies have reformed their incentive programs to better assure taxpayers that economic development efforts are being monitored to assure compliance with the agreement between the investor and agency. Most notably, many states and municipalities now employ controls, such as clawback provisions as part of their incentive programs. 3 These clawback provisions are designed to monitor compliance with incentive agreements by canceling incentives with under-performing companies and often reclaiming incentives back from those failing firms (Peters, 1993).
Data description
To analyze the impact of incentive programs on job creation, I chose the two flagship incentive programs: the Virginia Governor’s Opportunity Fund (GOF); and the Maryland Economic Development Assistance Authority Fund (MEDAAF). Both programs are major state level incentive programs that provide discretionary incentives to companies.
For both programs, I obtained information on their incentive offerings from open record requests at relevant agencies in both states. I then matched these data with a larger database of essentially all firms in Virginia and Maryland to generating a control group of firms. I provide details on all three of these data sets.
Virginia incentive data
Virginia’s flagship incentive program, the Governor’s Opportunity Fund (GOF), renamed the Commonwealth Opportunity Fund, is the focus of the first part of my project. The GOF, often called a deal closing fund, provides considerable discretion for the governor in the allocation of loans and grants to investors. The program is meant to attract capital and jobs to Virginia and is administered by the Virginia Economic Development Partnership.
The program requires a local matching incentive by municipalities interested in applying for the grant. As described on the program website
4
:
The Commonwealth’s Opportunity Fund (COF), formerly known as the Governor’s Opportunity Fund (GOF), is a discretionary incentive available to the Governor to secure a business location or expansion project for Virginia. Grants are awarded to localities on a local matching basis with the expectation that the grant will result in a favorable location decision for the Commonwealth.
The program provides grants to firms, in support of municipalities’ applications for incentives. Companies are required to meet numerous requirements on job creation, wages, and the amount of capital investment. These firms are required to report annually on their fulfillment of these targets and are subject to clawbacks if criteria are not met. An analysis found that from 2011–2015 this program is credited with 126 projects creating 21,702 jobs at an average cost of $3,045 per job, if we assume that all the jobs associated with the program would not have been created absent incentives. 5
Through an email open-records request on 12 November 2015 to the agency responsible for the program (YesVirginia), I requested data on incentives across the lifetime of the program. YesVirginia provided full documentation of their incentive allocations since the start of the program as well as information on the clawbacks at no cost to the researcher. This includes a total of 551 projects for a total of $234 million in incentives. These incentives are associated with $22.4 billion in investment and 119,178 total jobs.
For compatibility with previous work, I will focus on incentives allocated from 2006–2012 (227 incentives). Each one of these incentives will be attributed to a single establishment using Dun and Bradstreet unique identifiers (DUNS numbers). Incentives will then be coded as either in good standing or subject to a clawback. 6
Maryland incentive data
Closely following the Virginia analysis, I next focus on the MEDAAF. This program, originally created as a subsidized business loan program in 1999, absorbed ten standing incentive programs in 2000, and another program in 2004 (Maryland Department of Business and Economic Development, 2012). This program now contains a heterogeneous mix of incentives from traditional business incentives, to day care centers, to direct financial support to local economic development budgets. I focus my analysis on traditional incentive programs provided to businesses for capital investment and job creation.
Through an email public-records request on 12 November 2015 the Maryland Department of Economic Development provided me annual reports on their incentive performance. According to their 2015 annual report, to date, the MEDAAF provided incentives of $222.6 million to 496 investments. These incentives have been associated with retention of 29,578 jobs, 20,685 new jobs and $3.8 billion in investment. Along with their annual reports Maryland’s Department of Economic Development provided an Excel worksheet of 113 investments that were associated with clawbacks.
The National Establishment Times Series Data (NETS)
Following Jensen (2017) I utilize the National Establishment Time Series (NETS) data to match Virginia and Maryland establishments that were provided incentives with similar firms in the state that were not provided incentives. The NETS database provides detailed information on essentially the full universe of firms in both states (described in Jensen (2017)). I merge that Maryland MEDAAF and Virginia GOF data into the NETS data using DUNS numbers. Some firms have gone bankrupt, relocated, been acquired, or otherwise are no longer in the database. Thus, my analysis will only compare surviving firms (firms with DUNS numbers) in the analysis.
Pre-registered research design
Across disciplines, researchers are confronting the potential for publication bias in academic research. Put simply, publication bias is a problem in that certain types of studies are more likely than others to get published due to factors not directly relative to the quality of the research. Most commonly, publication bias refers to the research and peer-reviewed evaluations of studies based on the statistical significance of their results and not the quality of the data, novel theory, or appropriateness of the analysis. In the content of this paper, a research project that finds a strong positive or negative impact of incentives on job creation is more likely to be published than a study that shows no effect.
This can lead to two related problems. First, scholars can decide to not submit papers with null results to journals, the so called “file drawer problem” (Franco et al., 2015). Alternatively, researchers may run a number of alternative specifications until a statistically significant finding appears in their data analysis. Even experimental work is subject to these manipulations, where researchers selectively report some experimental results (Franco et al., 2015). Second, publication bias could simply be a result of the review process where peer-reviewers are more likely to reject papers, ceteris paribus, that have null results and thus only strong negative or positive findings survive the peer review process (see Findley et al., 2016). In either case, the distribution of studies in academic journals is towards papers that achieve (often barely achieve) statistical significance (p < 0.5).
To address this issue of publication bias – specifically p-hacking by researchers – scholars in fields including economics, medicine, political science, and psychology have adopted pre-registration as a means of providing greater transparency in the research process (Humphreys et al., 2013; Miguel et al., 2014; Olken, 2015). A pre-registration is simply a detailed plan by the researcher specifying the theory, data, and analysis prior to beginning a research project. Obviously, researchers encounter numerous challenges in the actual implementation of their projects, and are thus not legally or even ethically bound to follow their plans precisely. Nevertheless, researchers often feel compelled to document any changes because the original plan is publicly available.
For this project, I pre-registered my data and analysis, and provided a mock table of the core results. This plan was archived at the Evidence in Governance and Politics design registry (http://egap.org/design-registrations) prior to obtaining any of the data. Thus, the analysis presented in Table 1 and Table 2 matches the pre-registered research design document prior to beginning this study.
My analysis utilizes CEM (Iacus et al., 2012) to compare Maryland and Virginia incentive recipients with a matched set of control firms. I specifically match firms based on the natural log of employment in 2006, the three-digit Standard Industrial Classification code, and a dummy variable if the firm was a subsidiary of a parent company.
Hypothesis 1 allows for a simple “but, for” test of the impact of incentives on job creation. Absent the state level incentive program, would the company have created more jobs as the result of the program? 7 Note that this research design does not directly take into account the size of the incentive, pooling large and small incentives, nor does it measure support from other sources, including local governments. In the case of Virginia, a local match is required, and thus each case of state level incentives is coupled with local incentives. These points all introduce measurement error into the analysis, but there is no reason to believe this will bias these results.
Results
For all models, I use the natural log of 2012 employment at the level of the establishment as the dependent variable. I present the results for Virginia in Table 1. The first model takes the naïve approach and simply examines the relationship between jobs in 2012 and whether or not a firm receives incentives using ordinary least squares. This does not control for the fact that the firms that applied for incentives were already larger than the non-incentivized firms, nor does it account for other factors that could affect employment. Model 2 includes a variable for the natural log of employment in 2006.
Model 3 presents the direct test of Hypothesis 1 using CEM estimates using previous employment, three-digit industry code, and a dummy variable for whether or not the company is a subsidiary of a parent company for matching. This matching allows us to generate the counterfactual by comparing job growth across similar firms. I present the kernel density before matching and after matching in Figure 1A and Figure 1B providing visual evidence of comparability of incentivized and non-incentivized firms after matching.

Kernal density before matching (Virginia).

Kernal density after exact matching (Virginia).
The main finding from this matching is that incentives have no discernable impact on job creation, which is consistent with previous studies. 8 This null result may be surprising to some readers, where the use of incentives should be tied to job growth. Yet evidence directly from the state’s “Announcement” data base on company relocations and expansions suggests that these incentivized firms are only a small subset of all firms that expanded or relocated to Virginia. 9 Of the 2,422 expansions or relocations from 2006–2012, only roughly 5% were provided economic development incentives through this program. The matching estimates suggest that job growth in the GOF firms would be similar even without the incentive.
In Models 4 and 5, I categorize firms that are in good standing or were subject to “clawbacks” by the state. These clawbacks are simply coded based on public records requests from both states indicating that the incentives were cancelled and/or part of the incentive was repaid for non-compliance with the incentive agreement. In Model 4, I estimate the impact of participating in the incentive program on employment for the disqualified firms. In Model 5, I perform coarsened exact matching that no longer includes the disqualified firms in the estimates.
In Table 2, I present the same models, this time focusing on the Maryland MEDAAP incentive program. In Figure 2A and Figure 2B, I present the kernel density before and after matching.

Kernal density before matching (Maryland).
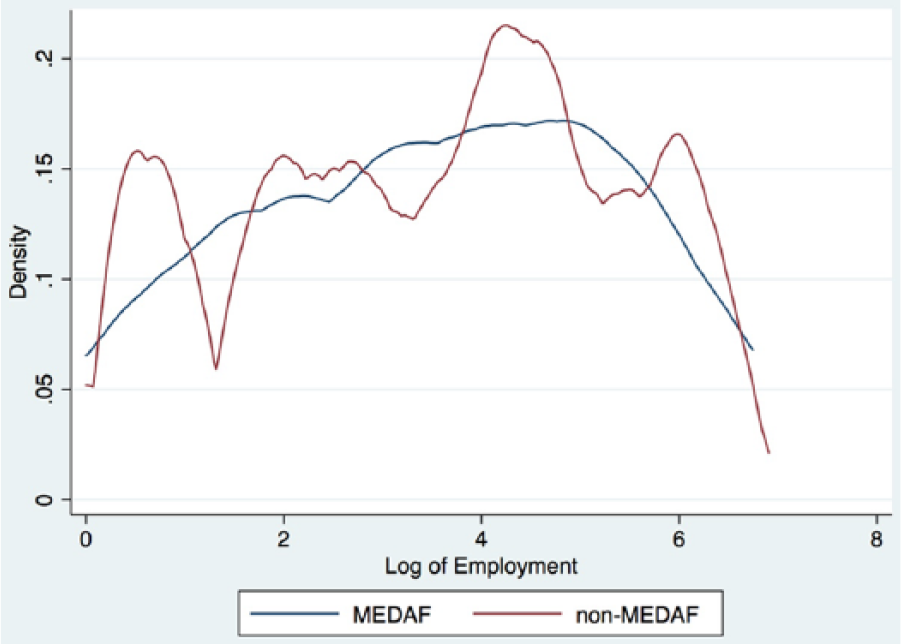
Kernal density after exact matching (Maryland).
These results from Table 2 are consistent with the results from Table 1. While MEDAAP firms have larger numbers of employees in 2012, this is largely due to larger firms participating in the program. When previous employment (2006 Employment) is considered, these incentives have a very small impact on job creation. Models 3–5 present the matching estimates, mirroring the previous tables’ results. The MEDAAP program has no impact on employment creation, even when we consider the use of clawbacks.
Robustness
To examine the robustness of the results I include estimates in the online appendix for coarsened exact matching including control variables (Table A1) as well as entropy balancing (Hainmueller, 2012) for Virginia (Table A2) and Maryland (Table A3). 10 The point estimates for these results are similar to Table 1 and Table 2, although in some models the incentives are statistically significant. The substantive effect of these results is very small. Virginia and Maryland projects in the data set proposed creating an average of 141 and 68 jobs respectively. The substantive effect of coarsened exact matching with additional control variables estimates that we can attribute 1.66 jobs and 0.37 jobs respectively (Table A1, Model 1 and Model 4). For entropy balancing, the job creation estimates increase to 4.09 jobs (Table A2, Model 2) and 0.57 jobs (Table A3, Model 2). In all models, the estimated job impact of these programs is a small fraction of the jobs proposed and relative to the size of the incentives (incentives average over $400,000 in Maryland and Virginia).
In summary, both analyses point to the ineffectiveness of these incentive programs in job creation. Even for the GOF, which also includes a matching local grant, I find no impact of these programs on job creation. Both states have economic development programs that utilize clawbacks to assure that firms comply with incentive agreements. My results suggest that compliance with agreements, even if perfect, does not address the underlying redundancy issue with these programs. Incentives are given to companies that are likely to be expanding employment even without incentives and thus these two programs are providing very few jobs.
Conclusion
In this paper, I analyze the flagship Maryland and Virginia economic development programs, matching incentivized firms with non-incentivized firms and coding if the incentivized firms were subject to a clawback for failing to comply with the incentive agreement. My findings point to the ineffectiveness of both programs for job creation in the 2006–2012 time-period. This result is one contribution of this study, but the larger contribution is methodological.
My analysis is the first pre-registered study of incentives, where the details for the project were pre-specified before purchasing the data. This limits researcher discretion in the analysis, and generally requires documentation of deviations from the pre-registered design. Note that there is nothing binding from this registration, only that the research process – from hypothesis generation, to measurement, to analysis – is made transparent prior to conducting the study. Researchers can deviate from the registered design and can engage in induct data analysis, but the important thing is that pre-registration makes this transparent.
Pre-registering can also mitigate potential bias in the self-evaluation of economic development incentive programs by economic development agencies, legislative audits, or other government actors. Many audits have become contentious: the Kansas Legislative Audit has been a back and forth between auditors and economic development agencies. Pre-registered analysis plans can allow all parties to agree on the proper way to evaluate incentives prior to data collection. This could lead to a more productive focus on how to best analyze economic policy, rather than defending or attacking the results of a program evaluation.
The findings from this study, when coupled with the analysis from Jensen (2017) provide further skepticism for the impact of incentives on job creation. Targeting incentives to a small number of firms is ineffective in creating jobs, when we compare the job creation patterns of incentivized firms with those that did not receive incentives.
The clear limitation of this work is that the focus of this project is on the short-term job creation. Future research is necessary to further explore how incentives may shape the employment decisions of firms by taking into account how the size of the incentive, as a share of business costs, affects firm employment in the long and short run. 11 An additional direction is to measure the fiscal costs and benefits of incentives by estimating new tax revenues generated by these tax-payer funded programs. 12
A second limitation is that that there are unobservable factors that can shape the decisions of firms to seek incentives. I argue that these unobservable factors, such as having future plans for expansions, bias the results towards finding a positive impact on job creation. None the less, additional work is required that either further models the decision to seek incentives, or to use experimental or quasi-experimental research to examine to causal impact of incentives on firm activities.
Footnotes
Acknowledgements
Thanks to the Ewing Marion Kauffman Foundation for providing financial support for this project and Yasuyuki Motoyama for excellent advice on the research design. Thanks to Lillian Frost, Narae Lee, Cam Powell, Matthew Scott, and Nikhil Venkatasubramanian for excellent research assistance. The design for this study was pre-registered at the Evidence in Governance and Politics (EGAP) registry, study 20160517AA.
Correction (June 2025):
Declaration of conflicting interest
The authors declare that there is no conflict of interest.
Funding
The author thanks the Ewing Marion Kauffman Foundation for providing financial support for this project.
Notes
Carnegie Corporation of New York Grant
This publication was made possible (in part) by a grant from Carnegie Corporation of New York. The statements made and views expressed are solely the responsibility of the author.
Supplementary material
The supplementary files are available at http://journals.sagepub.com/doi/suppl//doi.org/10.1177/2053168017713. The replication
files are available at ![]()
References
Supplementary Material
Please find the following supplemental material available below.
For Open Access articles published under a Creative Commons License, all supplemental material carries the same license as the article it is associated with.
For non-Open Access articles published, all supplemental material carries a non-exclusive license, and permission requests for re-use of supplemental material or any part of supplemental material shall be sent directly to the copyright owner as specified in the copyright notice associated with the article.