
Abstract
Voting is a complex dynamic driven by the sociopolitical attributes of individuals and how they are spatially located in proximity to similar or different populations. In this research note we examine how presidential vote choice is influenced by the interaction between the population density and racial composition of the ZIP code of respondents in the 2008 and 2012 Cooperative Congressional Election Studies. Our findings reveal interesting patterns with respect to a respondent’s racial background. For whites in racially diverse settings, as density increases, so does support for Obama. By contrast, for blacks the spatial and racial context has almost no effect, providing evidence in support of the claim that this is a group strongly attached to the Democratic Party and its co-racial standard-bearer.
Introduction
Political scientists seeking to understand party systems have long relied on sociological (or “social cleavage”) explanations (e.g. Lipset and Rokkan, 1967; Petrocik, 1981). The core assumption is that racial, ethnic, religious, and class divisions have served as the basis for numerous political parties, including those in the US (Burnham, 1970). Recent scholarship, however, also documents the importance of residential location in shaping people’s partisanship (e.g. Baybeck, 2006; Gainsborough, 2005; Gimpel and Schuknecht, 2004). For instance, proximity to a different group might alter and intensify certain political attitudes. Close contact with an out-group may foster congruent political behavior, while the sizable presence of an out-group in a spatially segregated setting may breed political conflict.
With respect to the contextual influence of place, in addition to the traditional urban–rural divide (Gimpel and Karnes, 2006), studies also note the importance of suburban voters, whose rise to prominence after the post-World War II housing boom created a large swing group (Gainsborough, 2005). This development has not been lost on campaigns, which now assiduously court suburban voters; for while this group is typically seen as pro-Republican, it is only marginally so (McKee and Shaw, 2003) and losses among suburban voters in the collar counties surrounding northern cities have recently tilted states such as Michigan, Pennsylvania, and Wisconsin to the Democrats (Donald Trump’s 2016 victories in these states notwithstanding).
A growing interest in suburban voting highlights how little we know about the shaping of political attitudes and behavior as a consequence of where people live and the racial composition of those settings. 1 In this research note we examine the interactive relationship between population density, racial context, and the preferences of black and white voters in the 2008 and 2012 presidential elections. The 2008 and 2012 Cooperative Congressional Election Study (CCES) data are ideal for testing these dynamics because of the large sample size and ZIP code-level geolocation. The ZIP code (ZC) indicator enables us to assign fine grain census data on population density and racial composition (e.g. percent white) to each survey respondent and thus determine if contextual features influence the likelihood of voting for Barack Obama.
Voting patterns vary a lot as the political landscape moves from the city to the suburb to the country (McKee and Teigen, 2009), yet few studies utilize the more exacting measure of ZIP code-level population density to gauge its effect on voter preferences. Rather, studies have relied on simple contrasts between urban, suburban, and rural voters. Further, a location’s racial composition can influence voting behavior but scholars typically ignore its interaction with residential density (but see Voss, 1996; Wright, 1976). In this study, we eschew coarse urban/suburban/rural distinctions and instead assess the role of density and the racial composition of a respondent’s environment in shaping presidential voting behavior, particularly given the racial profile of the individual. Controlling for numerous factors, ZC density registers a marked effect on presidential vote choice, whereas racial composition alone does not. Limiting the analysis to a specific race, we find that blacks appear almost immune to the contextual features of density and racial composition. By contrast, white respondents show considerable sensitivity to density and racial composition: indicating racial threat in high-minority/low-density environments while embracing Obama’s candidacy in high-minority/high-density locations.
Data and methods
We assign 2010 census data on population density (logged density per square mile) and racial composition (percent white; percent black) to the ZIP code of each respondent in the 2008 and 2012 CCES. We then run logistic regressions with a binary vote choice variable coded: 1 = Obama; 0 = McCain; 1 = Obama; and 0 = Romney. Controls include: party affiliation (Republican, Democrat, independent as omitted category); ideology (1 = conservative); race (black, Latino, white as omitted category); gender (1 = female); marital status (1 = married); education (1 = college graduate); income (>$100,000); logged ZC population density; age deciles (30s, 40s, 50s, 60s, and 70s); and region (South, Midwest, Mountains/Plains, Pacific Coast, Northeast as omitted category) 2 (due to space constraints, age and region estimates are not shown in Table 1, but are displayed in Table A3 of the online Appendix). 3
Models of presidential vote choice, 2008–2012.
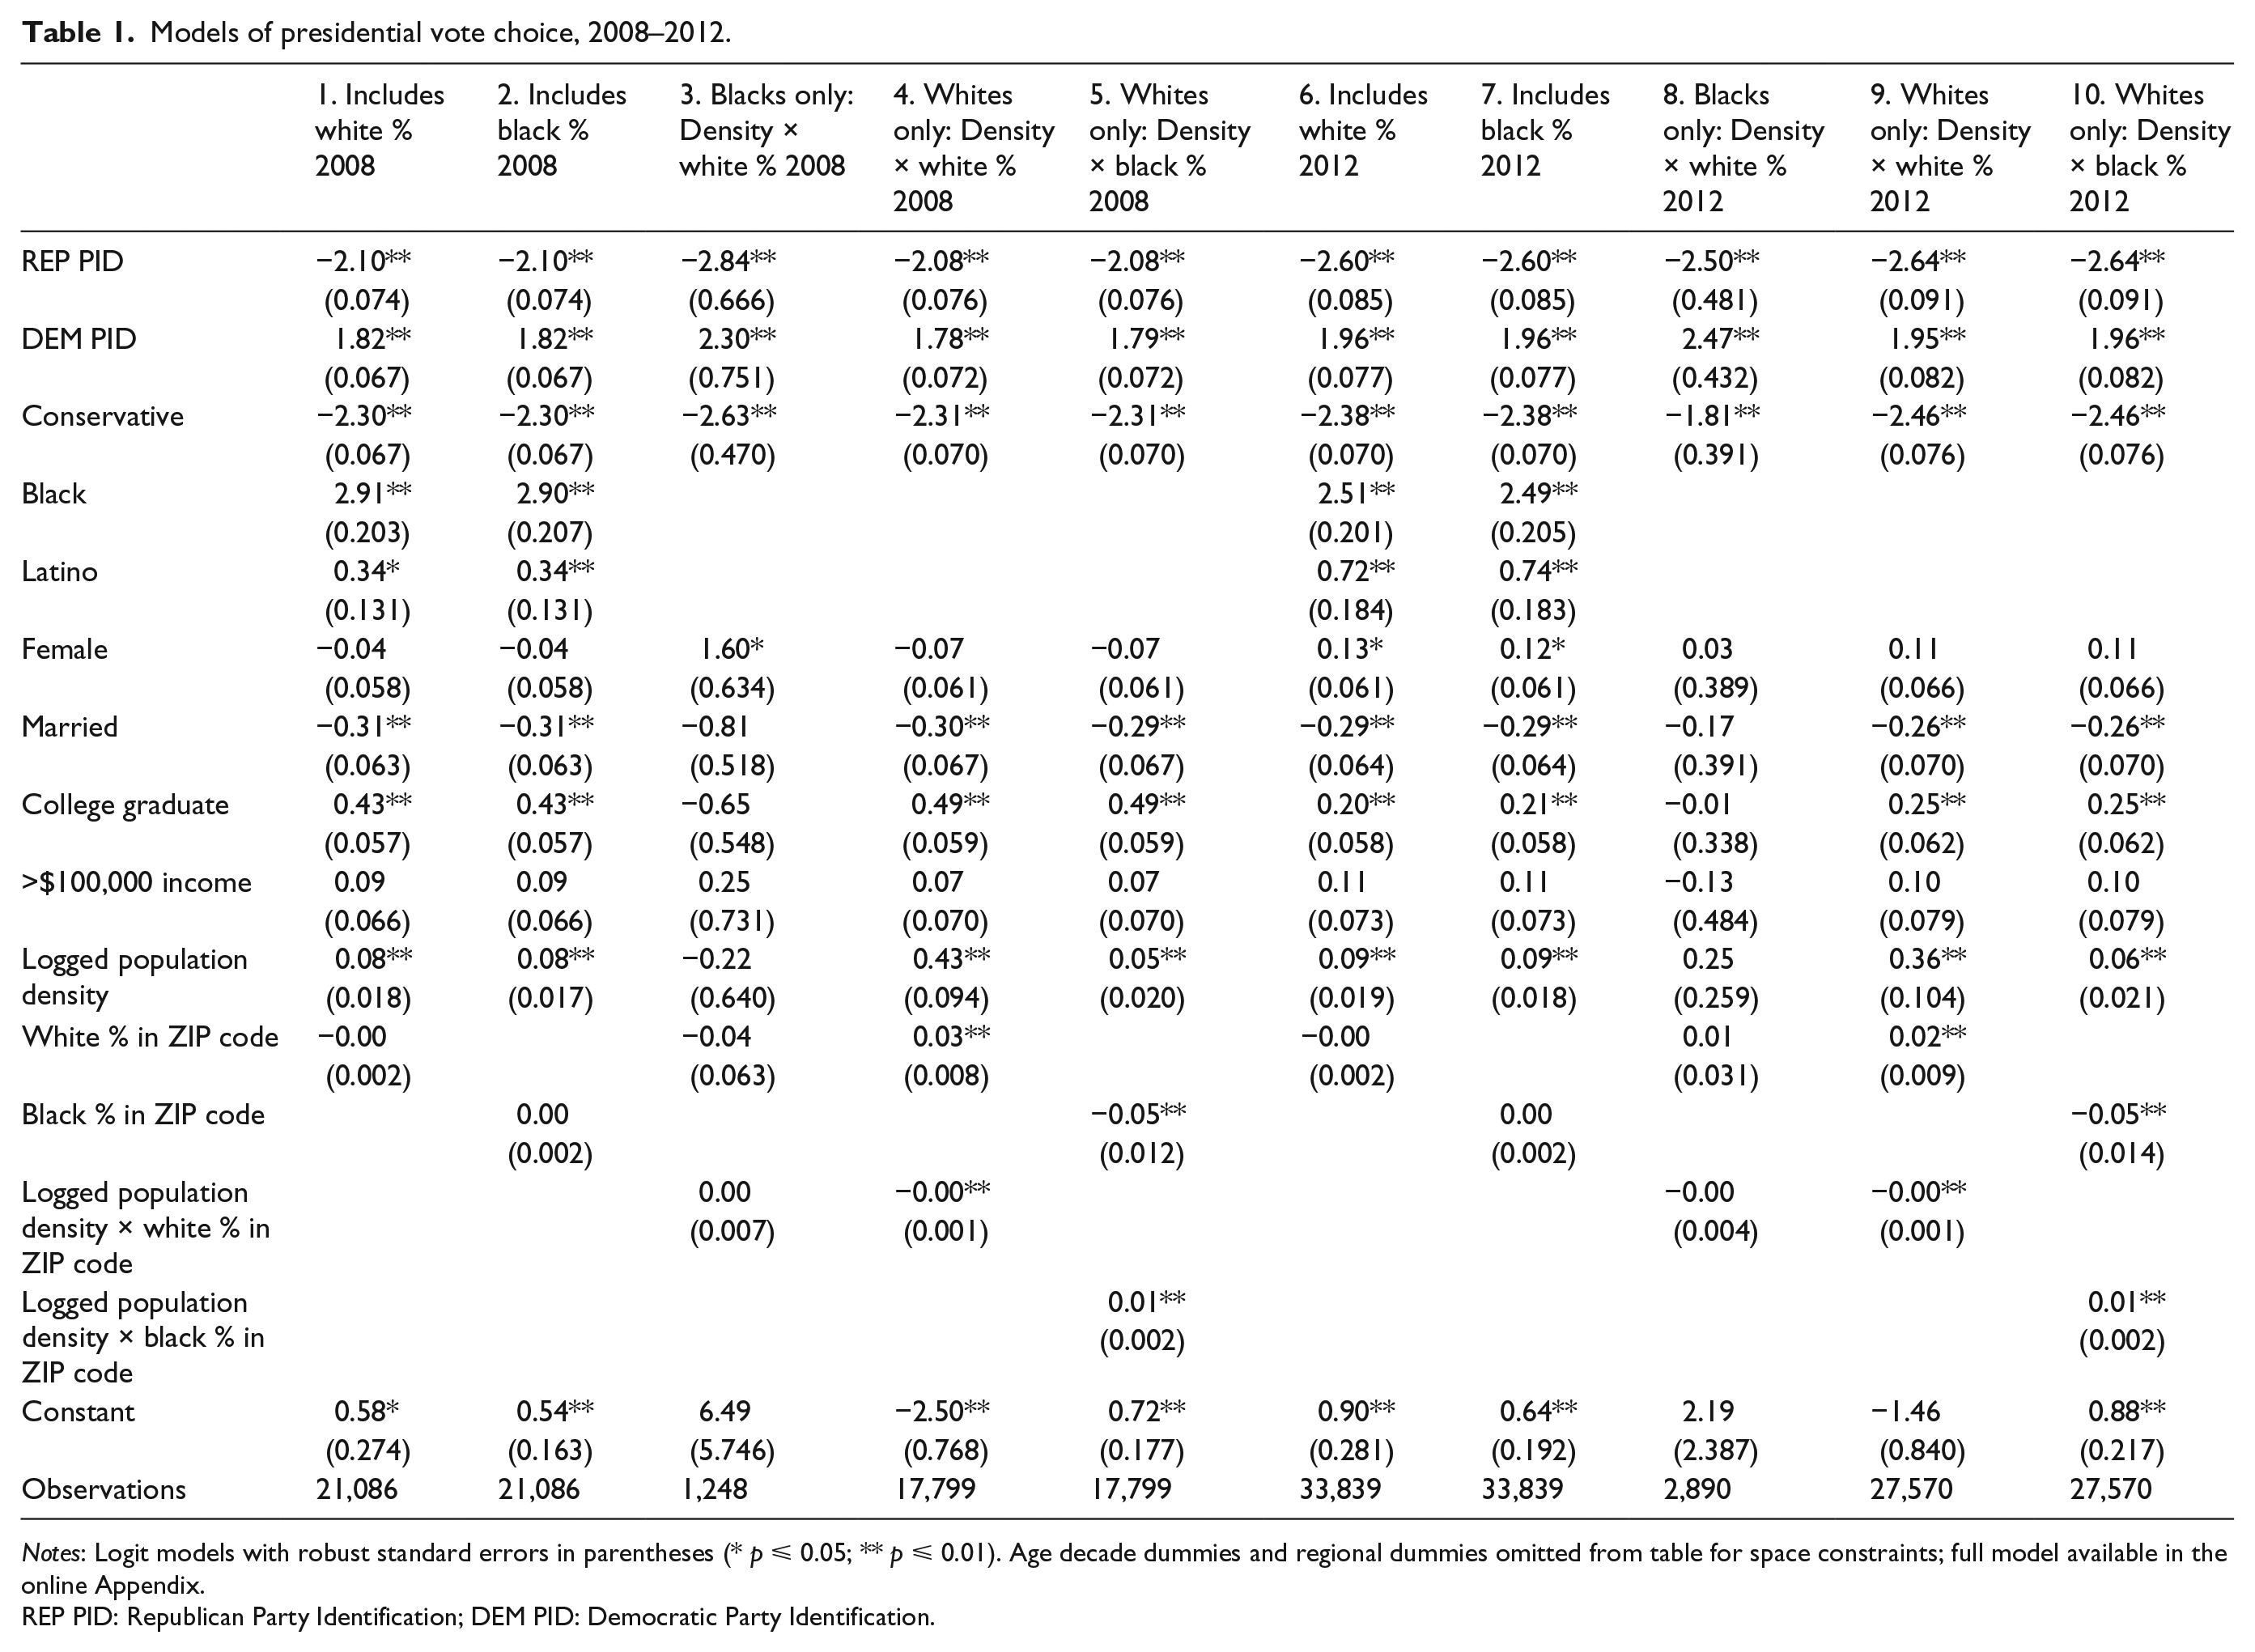
Notes: Logit models with robust standard errors in parentheses (* p ⩽ 0.05; ** p ⩽ 0.01). Age decade dummies and regional dummies omitted from table for space constraints; full model available in the online Appendix.
REP PID: Republican Party Identification; DEM PID: Democratic Party Identification.
We run the same five models for 2008 (1–5) and 2012 (6–10). The first contains the ZC percent white, the second includes the ZC percent black (excludes ZC percent white due to correlation), the third and fourth interact ZC density with ZC percent white while limiting respondents by race: black and white, respectively. Finally, the fifth model includes only whites and interacts ZC density with ZC percent black. 4
Results
First, we display the distribution of the ZC percent white and ZC percent black, respectively for white and black respondents in the 2008 and 2012 CCES. The regression estimates follow, and then we show a series of Figures that plot the likelihood of voting for Barack Obama among black and white respondents according to ZC density and two levels of ZC racial composition. Finally, in the last two Figures we highlight the notable variation in white voting behavior based on the ZC percent black while comparing low- and high-density areas.
Figures 1(a) and 1(b) are violin plots of the distribution of percent white and percent black population in the ZCs of white and black respondents in the 2008 and 2012 CCES. Compared to box plots, violin plots present a richer visual display of frequency distributions of the data as they range from their minimum to maximum values. In Figure 1(a) we see that most white respondents reside in ZCs with high white populations, whereas black respondents live in settings with a broader range of percent white residents. Complementarily, Figure 1(b) reveals the very low black population in ZCs inhabited by most whites, while blacks live in ZCs with a decidedly higher variation in the African American population.
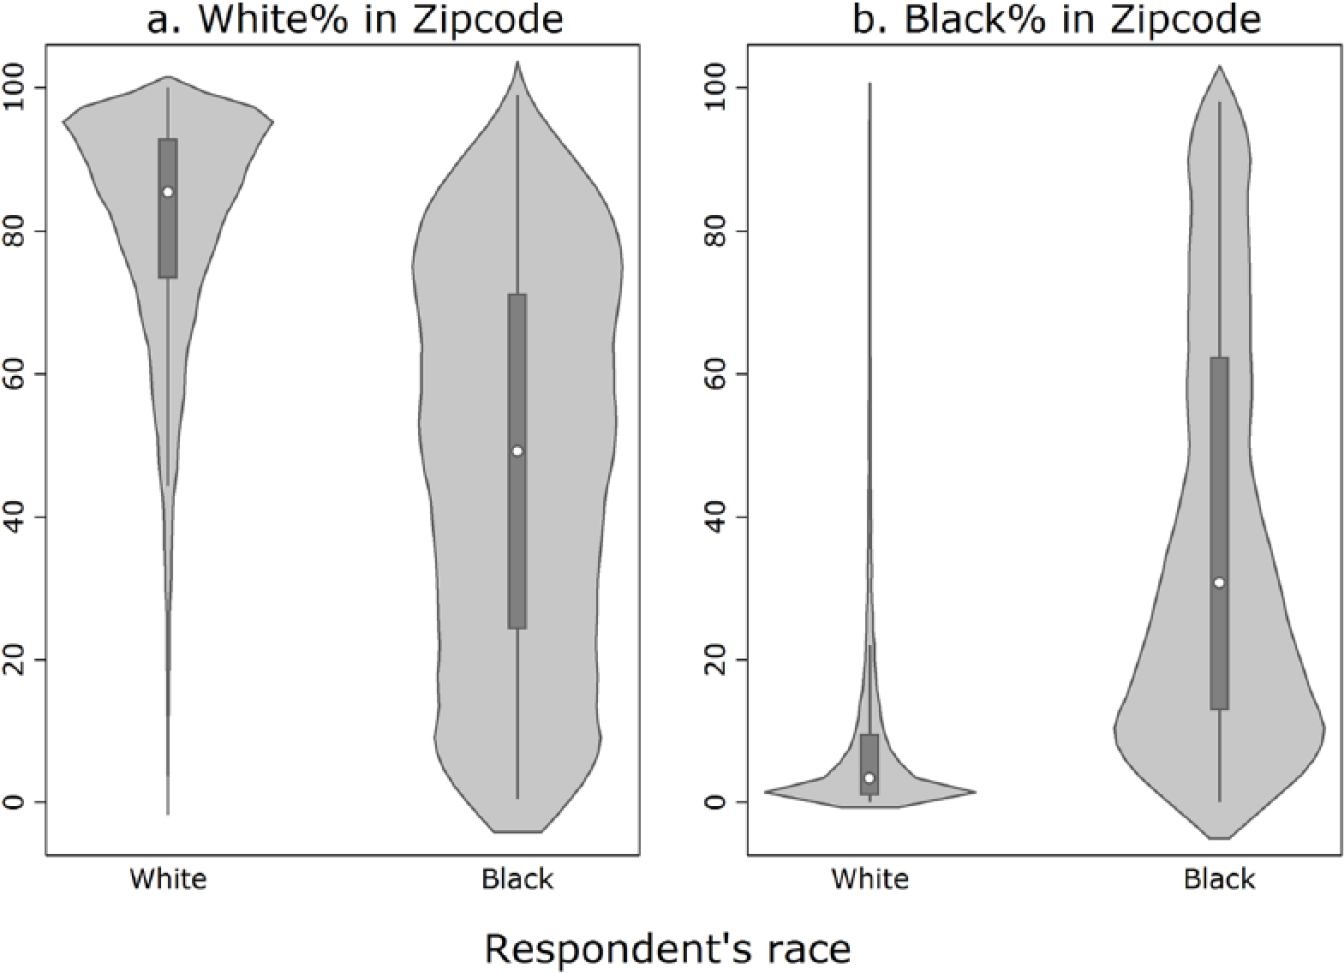
Distribution of White and Black Zip Code Populations for White and Black Respondents, 2008–2012.
Table 1 presents our models of the likelihood of voting for Barack Obama. Models 1 and 6 (2008 and 2012) include white ZC percent and Models 2 and 7 include the black ZC percent. Neither variable is significant but in these models density registers a large effect: the increase in voting for Obama across the density range goes from about 49% in the most sparsely populated ZCs to an over 58% chance of voting for Obama for respondents in the most densely populated areas (see Figures A1–A2 in the online Appendix). Models 3 and 8 (2008 and 2012) are confined to blacks, and Models 4 and 9 to whites, and each includes an interaction between density and white ZC percent. This interaction only attains significance in the whites-only models (4 and 9), but significant differences can register along certain ranges of the interaction so we present predicted probabilities of voting for Obama in Figures 2(a)–(d) according to density and two levels of white ZC percent (low = 20%, high = 95%).

Obama Vote by Density and Zip Code Racial Composition for Black and White Voters, 2008–2012.
Figures 2(a)–(b) present results for black voters in 2008 and 2012 (Models 3 and 8). It is remarkable how little movement in the likelihood of voting for Obama is based on density and ZC racial composition. Surely Obama himself partly explains this lack of variation in voting behavior, but it also seems African Americans’ stalwart Democratic support (Fauntroy, 2007) is impervious to these contextual factors. The almost inelastic and consensus black vote for Obama, speaks loudly to the notion of a linked fate/racial identity manifested in vote choice (Dawson, 1994; Tate, 1993). 5
Figures 2(c)–(d) present results for white voters in 2008 and 2012 (Models 4 and 9). In high-white ZCs, density has a marginal positive effect on voting for Obama. However, in high-minority ZCs, density has a substantial effect on white voting behavior. There is evidence of both racial threat and the contact hypothesis (Sigelman and Welch, 1993); that is, whites in rural, high-minority locales exhibit a very low probability of voting for Obama (racial threat), whereas whites in the most urban (densest), high-minority settings are more likely to vote for Obama than his two Republican opponents (contact hypothesis). Whites spatially segregated from a high-minority population in a rural environment are much less supportive of Obama and this behavior is reminiscent of the classic southern story of racial threat (Key, 1949; Wright, 1976). By contrast, urban whites living in close proximity to majority–minority populations resemble their minority neighbors in their political behavior since they are more inclined to vote for Obama.
Figures 3(a)–(b) (Models 5 and 10 in 2008 and 2012) expand upon the evidence in Figures 2(c)–(d) by contrasting the voting behavior of whites based on the relationship between ZC black percent and two levels of population density (low = 25th percentile, high = 75th percentile). Voting for Obama hardly varies in ZCs with no African Americans, irrespective of density (low or high). As the ZC percent black increases, whites in high-density (urban) settings show very little movement in the likelihood of voting for Obama (see the probability range in Table A2 in the online Appendix), whereas whites in low-density (rural) locales are decidedly more likely to vote Republican. 6

Obama Vote by Zip Code Percent Black and Two Levels of Density, White Voters in 2008–2012.
Conclusion
Political observers have long understood that environmental factors can have a pronounced effect on voting behavior. The compositional makeup of a location does much to explain its politics, but it is also true that the relative proximity in which different groups interact shapes the preferences of voters (Gimpel and Schuknecht, 2004). Where individuals live and who their neighbors are, shapes how individuals vote, even controlling for numerous sociopolitical attributes.
White voters exhibit the most political malleability in settings that vary with respect to density and racial composition. By contrast, black voting behavior in 2008 and 2012 is remarkable for its resistance to these contextual factors. Perhaps this is no surprise because, as a group, African Americans overwhelmingly favor one political party. Nonetheless, the almost inelastic voting behavior of African Americans when the racial composition and density of the ZIP code varies is noteworthy. Attachment to the Democratic Party and a black President seems to explain this. However, future research can make use of the 2016 CCES – the first time this survey will examine presidential voting behavior when neither candidate is named Barack Obama nor of African American descent – to confirm this relationship between ZIP code-level density, racial composition, and voting behavior.
Footnotes
Declaration of conflicting interest
The authors declare that there is no conflict of interest.
Funding
This research received no specific grant from any funding agency in the public, commercial, or not-for-profit sectors.
Notes
Carnegie Corporation of New York Grant
This publication was made possible (in part) by a grant from Carnegie Corporation of New York. The statements made and views expressed are solely the responsibility of the author.
References
Supplementary Material
Please find the following supplemental material available below.
For Open Access articles published under a Creative Commons License, all supplemental material carries the same license as the article it is associated with.
For non-Open Access articles published, all supplemental material carries a non-exclusive license, and permission requests for re-use of supplemental material or any part of supplemental material shall be sent directly to the copyright owner as specified in the copyright notice associated with the article.