
Abstract
Research on mass political behavior relies extensively on ideology scales. The majority of political science surveys use a unique, and potentially problematic, word to anchor the endpoints of these scales (“extremely”). However, political science has surprisingly little evidence on the effects of using this anchor over others. We utilize an older, but ignored, survey experiment on the 1989 American National Election Study (ANES) Pilot Study to analyze the consequences of the choice between using “very” or “extremely” endpoint labels. Theoretically, our results illustrate how a seemingly negative question anchor helps optimally measure a key concept (ideology) that is fundamental to understanding phenomena such as mass polarization.
Introduction
Question wording shapes respondent answers. Much scholarship has found that changing question format and labeling can create variance in measurements of political behavior (e.g. Jacoby, 2000; Schuman and Presser, 1981), but this point has been overlooked with respect to an important construct in public opinion research: ideology. Virtually every major academic survey (including General Social Surveys, National Annenberg Election Surveys, and the American National Election Studies [ANES]) measures respondent ideology using a seven-point scale anchored by “extremely” endpoints. In contrast, private polling companies often describe the most ideological positions on their scales as “very liberal” and “very conservative.” Yet with the exception of Knight’s (1990) brief analysis of the 1989 ANES Pilot Study, virtually no scholarship has examined the differences in reported respondent ideology produced by these two endpoint labels. We offer such an analysis here.
While we understand the limitations of such old data, we rely on the 1989 ANES for two reasons. First, utilizing the ANES allows us to replicate the same polarization scales and measures used in contemporary research. Second, the 1989 data are the most recent data that allow for a direct comparison of the two question wordings, and political scientists have never fully leveraged their usefulness. Even though the 1989 ANES is the only existing data on “extremely” versus “very” in a major political science survey, the only analysis was an internal ANES publication (Knight, 1990) that ignored half of the survey manipulations (shown later in Table 2). In addition, ANES data allow us to demonstrate the effects of the different ideology anchors on contemporary polarization research.
Our principal concern is whether the word “extremely” is a “symbolically loaded” way to label ideology scale endpoints (Knight, 1984: 311). This imagery is problematic if respondents who are clearly ideological (displaying strong and consistent preferences toward a liberal or conservative political worldview) fail to select a polar option on the ideological scale solely because of its question wording. If so, then research on contemporary topics such as mass polarization (Abramowitz and Saunders, 2008; Levendusky, 2009) may be fundamentally misunderstood.
This concern is multiplied when we consider the psychology of respondents. Respondents are especially unlikely to be motivated to appear “odd or extreme” when under evaluation (Jones and Sigall, 1971). Even individuals with strong preferences might be averse to indicating those preferences, especially if the measurement tool uses a subjectively loaded term, because of an “automatic process” that triggers in response to prejudices (Devine, 1989). Tourangeau et al. (2000: 212) describe this as “the standard of comparison [has] major effects on the judgments that are rendered.” If the standard of comparison is someone holding radical, fanatical opinions—a stereotyped extremist—respondents might avoid endpoint responses, even if they are strongly ideological. Moreover, if this response to extremism is psychological, it should not diminish over time.
This might be avoided with a more neutral question anchor. If “very” is better at capturing individuals who consistently exhibit ideological preferences, we should prefer that question wording (because it eschews the cognitive bias of “extremely”). Presumably, we would observe more respondents willing to select the endpoints of the scale, increasing the variance of one measure relative to the other. Yet despite our knowledge of respondents, and over 60 years of the use of the word “extremely,” we lack direct evidence on the relative performance of these two anchors. We offer that evidence next.
Data, methods, and results
We know of only one data set that offers a direct statistical test between the two endpoint labels: the 1989 ANES Pilot, originally analyzed by Knight (1990). The study was a two-wave panel design with four forms per wave. The most interesting experiment for our purposes is the experimental manipulation between the endpoints defined by the words “extremely” and “very.” The manipulations occurred as shown in Table 1. For each wave, the forms represent a two-by-two manipulation of endpoint labels and question formats. This setup allows us to test the effects of the two question anchors.
Endpoints and question types by wave and form.

Cell entries are n of wave-form.
Respondents are given the same form across waves.
First, we present the results of tests for the equality of the variances of the two question wordings. If even strongly ideological respondents are prejudiced to selecting non-strong ideological responses because of the “extremely” anchor, we should see non-equal variances between the words “very” and “extremely,” with “very” exhibiting a higher variance.
Table 2 displays the results. In the table, “SP” denotes the self-placement question format. “Branching” denotes the branching question format. “Pooled” denotes a test that pools the responses across both the self-placement and branching question formats. 1 The first two rows represent Knight’s (1990) analysis; the rest of the table displays our original analysis.
Statistical analysis of scale endpoint labels.
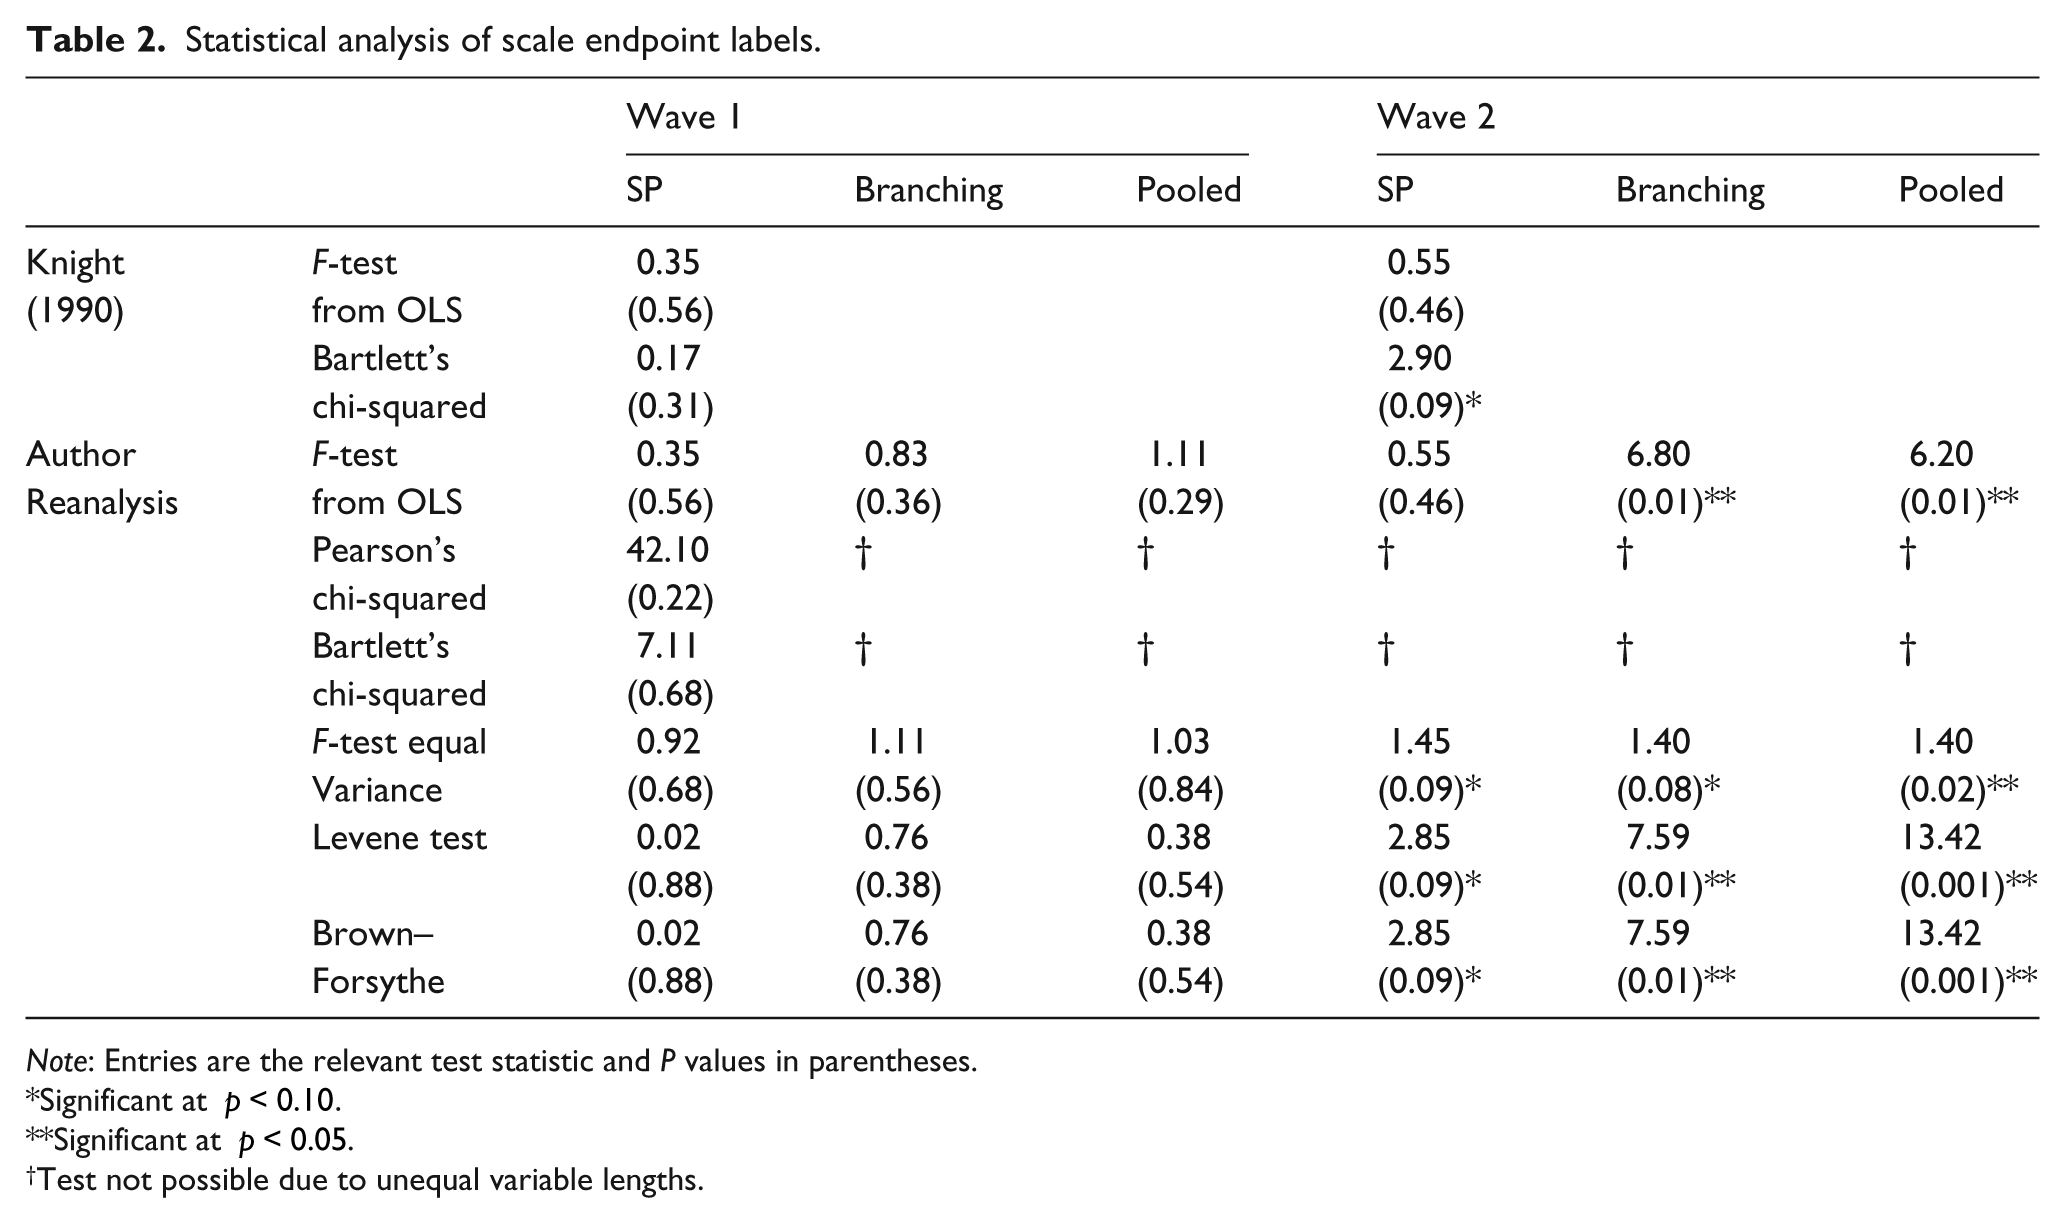
Note: Entries are the relevant test statistic and P values in parentheses.
Significant at p < 0.10.
Significant at p < 0.05.
Test not possible due to unequal variable lengths.
We discuss wave 1 first. First, we replicate Knight’s (1990) findings from the 1989 ANES Pilot study. Note that Knight’s analysis only considered a single question type: the self-placement (“SP”) format. This alone warrants reanalyzing the data. For wave 1, both the F-statistic from the OLS regression of ideology on an endpoint label dummy (the “very” label) and the Bartlett’s chi-squared test indicate no significant difference between the question anchors. We turn now to our original analysis (beyond just “self-placement”). Begin with the results in the third row, which report the F-statistics from the OLS regression of ideology on an endpoint label dummy (again, the “very” label). In no question format is the statistic significant. These tests from wave 1 show no evidence that the variances of the two question anchors differ significantly.
We now offer more appropriate tests of the data. 2 The Pearson’s and Bartlett’s chi-squared tests both require that the length of the test variables be equivalent; here, there must be the same number of respondents in the “very” question type as the “extremely” type. 3 Table 1 demonstrates that, for wave 1, this is only true for the self-placement format. Accordingly, we only execute these tests for this subsample. In neither test is the relevant test statistic significant. The same null evidence is found with the F-test, Levene test, and Brown–Forsythe test. For wave 1 we cannot reject the null hypothesis, so we conclude that the variances of “very” and “extremely” are not significantly different.
Move now to wave 2. From Knight’s (1990) analysis for wave 2, the Bartlett’s chi-squared test indicates there is a significant difference between endpoint labels “very” and “extremely” (χ2 = 2.90, p = 0.09). When we move beyond the self-placement question, we find more evidence of unequal variances of the two anchors. The branching question form (F = 6.80, p = 0.01) and pooled responses (F = 6.20, p = 0.01) both indicate that we can reject the null hypothesis of no significant difference between the “extremely” and “very” endpoints (third row). In this case, the variance of the “very” question type is higher, as we hypothesized. We find more consistent differences with the F-test of equal variance, Levene test, and Brown–Forsythe test. For these tests, in each sample in wave 2—the self-placement question alone, the branching question alone, and the pooled responses across the question types—we can reject the null hypothesis that the two questions are drawn from distributions with equivalent variances. “Very” and “extremely” evoke different responses.
The question remains: if the variance of the “very” anchor exceeds the “extremely” anchor in wave 2, which respondents are responding as “very” ideological that are not responding as “extremely” ideological? To answer this question, we replicate Abramowitz and Saunders’s (2008) polarization scores. 4 The component parts of their index were asked only in wave 2, so we focus our attention on those data. 5
Table 3 presents cross-tabulations of each folded ideology variable against the polarization scores. We provide cross-tabulations because the experimental manipulations performed on the ANES drastically reduce the n of each question wording. In the last column, we observe the distribution of preferences for those individuals who identify as either “very” or “extremely” ideological. For the “very” ideological, 78% of respondents only exhibited 0-3 one-sided preferences. Contemporary research would categorize these individuals as moderate based on their preferences (Fiorina et al., 2011), but classifying them solely on the basis of their ideological scores would label them as polarized. In contrast, almost 50% of respondents who identify as “extremely” ideological exhibit 4–6 one-sided preferences. With this anchor, we better achieve consistency between preference-based indicators of polarization and ideologically based ones.
Cross-tabulations of polarization and folded ideology (by anchor), wave 2.

Only when measuring ideology with the “extremely” anchor is ideology significantly related to the polarization measure. In wave 2, the χ2 value for the association between the combined “very” ideology scales and polarization is 13.458 (p = 0.764), and Pearson’s r = 0.111. For the “extremely” ideology scales, χ2 = 34.19 (p = 0.011), and Pearson’s r = 0.265. The extremely response category exhibits a lower variance; fewer respondents locate in the endpoints. However, when we use the “very” anchor, those additional respondents who identify as “very” ideological are precisely those traditionally considered to be more moderate. These additional moderates reduce the association between ideology and preferences to insignificance.
Discussion and conclusion
Significantly fewer individuals place themselves at the endpoints of an ideology scale when they must label themselves “extremely” liberal or conservative. Although our data are from 1989, these results complement other social science findings: people prefer to consider themselves as moderate (Treier and Hillygus, 2009) and view words such as extremism with a negative connotation (Hogg et al., 2013). The explanations for this are generally psychological, and suggest social desirability bias (Hare et al., 2014) as a possible cause.
This psychological process is unlikely to change due to time itself or changing party coalitions. The two current parties are more polarized than in 1989, but our results complement those of contemporary research. Hare et al. (2014) demonstrate that even the most ideological respondents in the 2012 ANES avoided the “extremely” ends of the ideology scale. Our results suggest endpoint labeling as a potential explanation for why this occurs. However, our results also suggest that if we seek to identify the most ideological respondents (the “polarized”), the discrimination provided by the “extremely” anchor is useful, making “extremely” the preferred anchor for theory construction.
The anchor “very” elicits the exhibition of more intense ideology, but these expressions are unrelated to actual preference intensity. Future analyses of ideology measurement on surveys need samples of contemporary respondents. Such research will need large samples, because the number of individuals who identify at ideology scale endpoints is relatively small.
Overall, the word “extremely,” as other research has found, does seem to have a negative association, as demonstrated by the relatively fewer respondents identifying as extreme. But that connotation may help political scientists measure “true” ideological intensity from “reported” intensity. This helps validate the use of a seemingly negative measure.
Footnotes
Correction (March 2025):
Funding
This research received no specific grant from any funding agency in the public, commercial, or not-for-profit sectors.
Notes
Supplementary material
The supplementary files are available at http://rap.sagepub.com/content/3/3. The replication files can be found at ![]()