
Abstract
This paper considers an innovative approach to measuring public spending preferences using an interactive budgeting questionnaire. After being presented with the President’s requested budget for the upcoming fiscal year, survey respondents were asked to adjust spending levels in line with their personal preferences, subject to budgetary trade-offs. An analysis of survey results reveals that responses sharply contrast with those recovered by traditional survey measures. The results are then used to examine the relationship between fiscal preferences and self-reported ideology, and to explore the structure of budgetary preferences. It is found that preferences scale to two substantive dimensions: the first measures the trade-off between security and non-security spending and strongly correlates with self-reported ideology; and the second reveals a crosscutting cleavage that has attracted little, if any, attention in previous research. Specifically, it measures each respondent’s relative preference for rival and non-rival government goods and services.
Introduction
The federal budget is among the most important policy decisions made by Congress and the President each year. How citizens would like the federal government to allocate funds would seem to tap into the most basic political preferences, yet determining public spending preferences is a textbook example of the difficulties and limitations of determining public wants from surveys and opinion polls. These difficulties largely result from survey questions that have traditionally ignored important budgeting trade-offs and, as a result, produce uninformative or incoherent responses that prove problematic for representatives and researchers alike.
This paper presents a new survey method designed to address many of the problems associated with traditional survey measures for budgeting preferences. Instead of testing whether the public can approach budgeting issues in a rational manner, as earlier surveys have done, it employs a framework that forces logically coherent responses that fully account for budgetary trade-offs. Rather than pose questions in terms of preferences for increasing or decreasing spending, an interactive questionnaire presents respondents with the federal budget summarized into twenty spending categories. Using the President’s requested budget as a starting point, each respondent was asked to adjust spending amounts in accordance with her personal preferences, effectively creating a personal federal budget.
This paper makes two contributions. First, it speaks to a methodologically oriented literature on measuring public spending preferences. The questionnaire design represents a step forward in survey methods for revealing public spending preferences, and should lead to a substantial improvement in the quality of data collected. Importantly, the questionnaire ensures that responses are coherent and provides basic information about the federal budget and spending programmes, without which many respondents lack a proper perspective on federal spending levels. This contrasts with traditional survey frameworks – for instance, the National Election Study and the General Social Survey – in which considerable uncertainty remains over how exactly a ‘more’ or ‘less’ response should translate into policy demands.
Second, the paper also demonstrates how this type of data can inform researchers’ understanding of budgetary preferences among the mass public. Although the analysis is limited to a convenience sample of university students, it was found that preferences as revealed by the interactive questionnaire greatly differ from what would be expected in a traditional survey. This paper further explores the dimensionality of public spending preferences via multi-dimensional scaling techniques in order to demonstrate improved empirical tractability of the data. The scaling reveals that fiscal preferences are largely explained by two latent dimensions; the first dimension measures the trade-off between security and non-security spending, and strongly correlates with self-identification on the liberal–conservative dimension; and the second dimension reveals a crosscutting cleavage that has attracted little, if any, attention in previous research. Specifically, it appears to measure each respondent’s relative preference for rival and non-rival government goods and services.
In the following section, the interactive budgeting questionnaire and survey implementation are introduced. This is followed by a presentation of the results from the student survey. The remaining sections apply the survey responses to explore the structure and dimensionality of fiscal preferences and how they map onto standard notions of left–right ideology.
Interactive budgeting questionnaire
Fiscal preferences have often been used as an avenue of research into the questions of public competence. One group of studies examines survey framing effects and finds that responses are highly sensitive to changes in question wording, suggesting a public easily manipulated by simple framing tricks and fickle in their preferences (Jacoby, 2000; Rasinski, 1989). Another group of researchers utilized data on public spending preferences to analyse public rationality, and observed an irrational pattern whereby a majority of respondents supported increased spending but also supported reduced taxes, which eventually gained notoriety as the ‘more for less paradox’ (Hansen, 1998; Haskell, 2001; Ladd et al., 1979; Mueller, 1963; Page and Shapiro, 1992; Welch, 1985).
Together, these studies cast a pessimistic shadow on the public’s competence to weigh in on the budgeting process. Haskell (2001) succinctly captures the resulting sentiment with the claim that ‘the main point of having people in leadership positions in legislatures is to have them do that which citizens are in no position to do – construct some rational whole out of a given year’s budget’. However, it is worth considering that the incoherency present in responses to conventional budgeting survey questionnaires is more a symptom of the test than the takers. In any other context than a survey, it would likely seem unreasonable – perhaps even unfair – to ask individuals about their public budgeting preferences without first providing even a minimal amount of information on relative spending amounts needed to place them in context, and then declare the uninformed and often incoherent preferences that result as evidence of their irrationality and incompetence.
Political scientists have long acknowledged these shortcomings and have struggled to develop adequate methods to measure public spending preferences (Hansen, 1998; Musgrave, 1959; Welch, 1985). In particular, there was a surge in interest in budget games in the public finance and public choice literatures during the 1980s (Auld, 1980; Brookshire et al., 1982; De Groot and Pommer, 1987; Hockley and Harbour, 1983). Much of this literature concerned designing new and innovative budgeting questionnaires. These questionnaires generally used some variant of allowing respondents to allocate spending across several budgeting categories but were limited by the available technology, which typically relied on pen-and-paper arithmetic or presenting respondents with chips that represent a gross simplification of budgeting amounts.
This paper takes advantage of newly available tools to advance on the earlier literature. An online survey with software that included an interactive budgeting questionnaire was designed and implemented. The questionnaire design emphasized making sure the budgeting amounts were made comprehensible to respondents. When each respondent reached the budgeting section of the survey, they were presented with a visual summary of the relative spending amounts for twenty budget categories corresponding to the President’s requested budget for FY2006. 1 The questionnaire also incorporated an information page for each spending category, containing a brief category description, a list of the major spending programmes within the category and their respective amounts, and links to a detailed chart of outlays and the White House brochure on the spending category. For reference, a snapshot of the budgeting questionnaire is displayed in Figure 1. 2
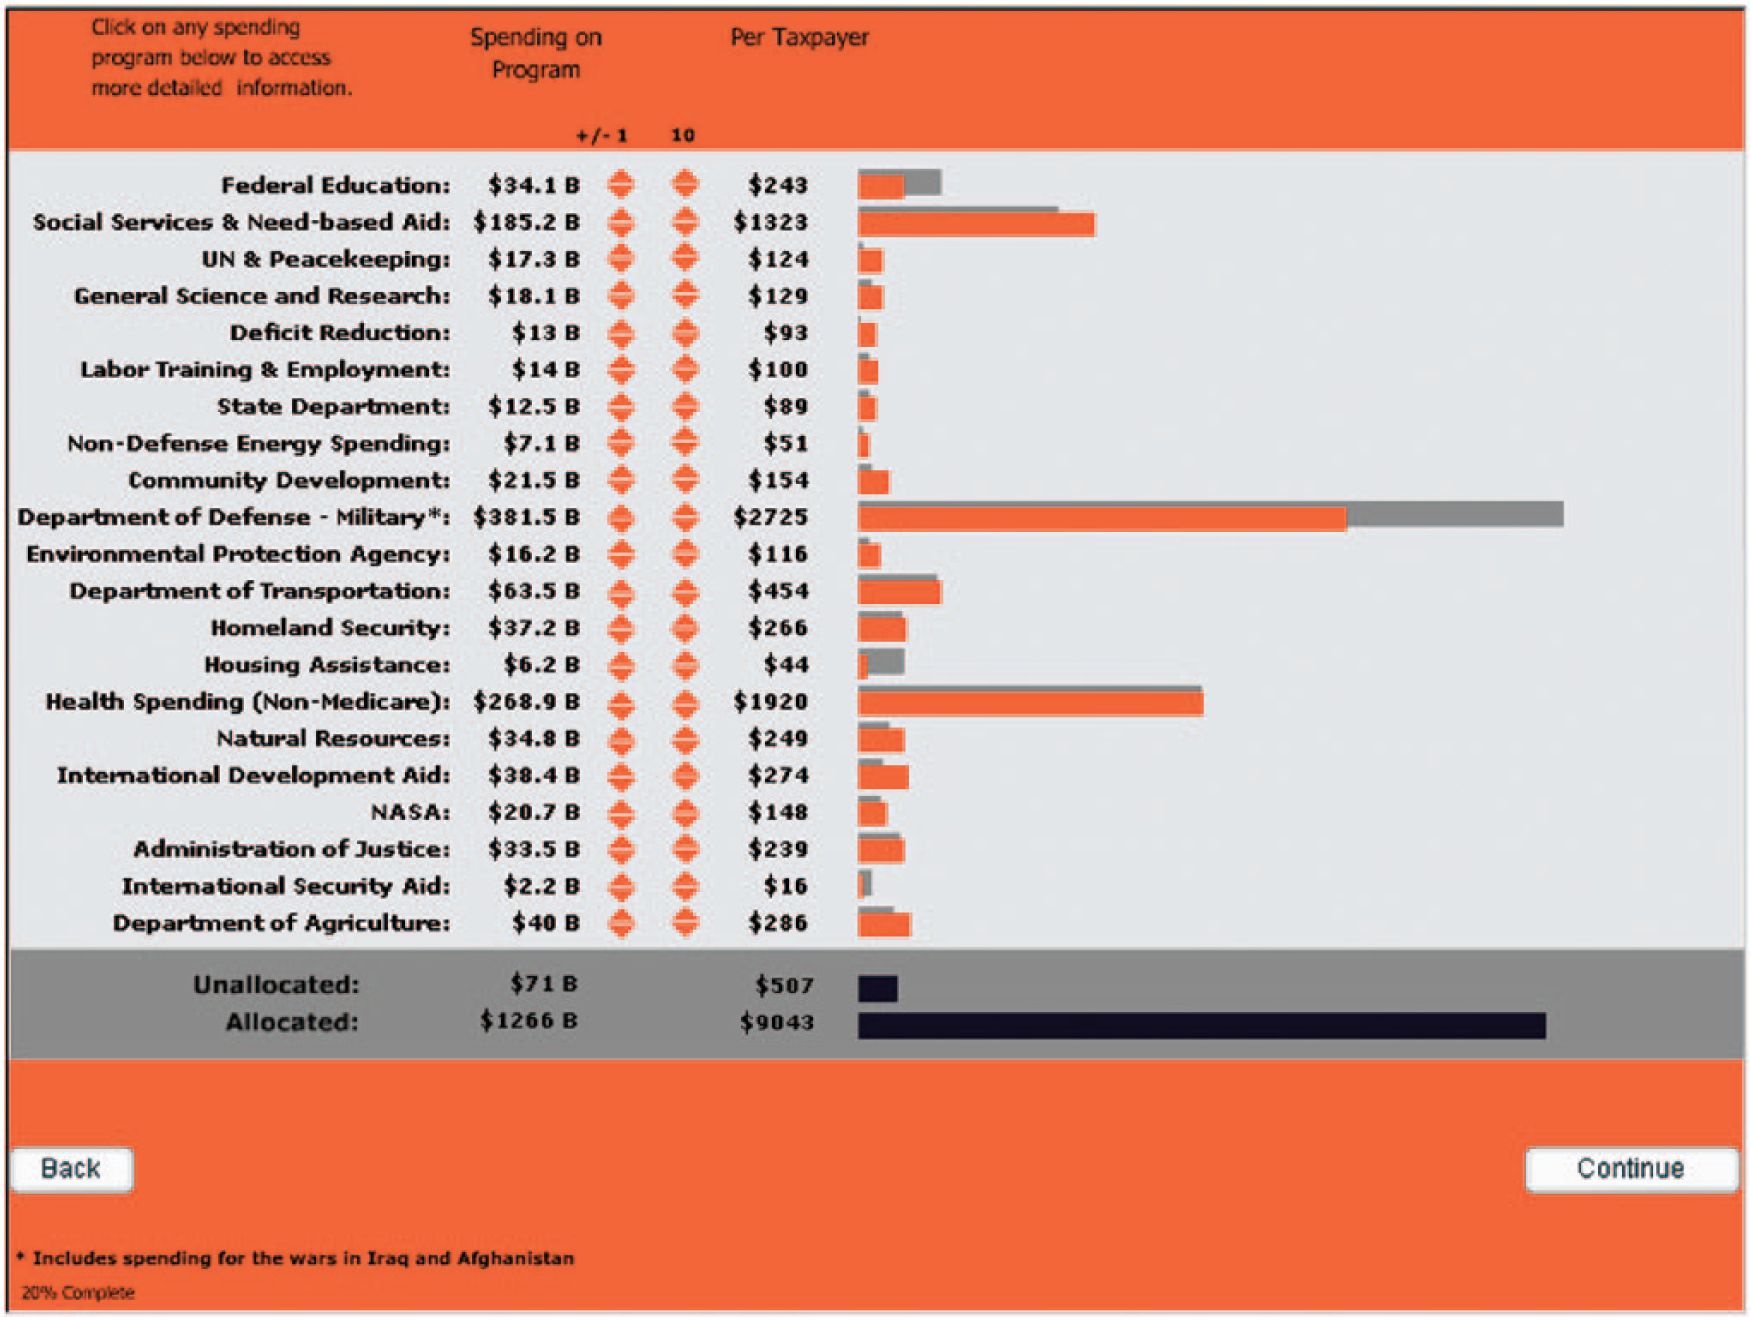
Screenshot of interactive allocation section of the questionnaire.
After being presented with detailed instructions, respondents were asked to adjust spending to bring it in line with their personal preferences. The user interface was designed to be intuitive and easy to use. Each spending category was associated with buttons that could increase or decrease spending for that category in increments of one billion or ten billion dollars. The respondents could track these changes with horizontal bars that visually displayed the spending amounts relative to other categories and relative to the President’s requested budget. A key feature of the questionnaire is that a budget constraint is strictly enforced. In order to allocate funds to increase spending on one dimension, the respondent must first decrease spending in another category, thus forcing respondents to fully account for budgetary trade-offs.
The poll was conducted from 9 November to 5 December 5 2005, yielding a sample of 896 undergraduate students from five colleges and universities. 3 At each university, an e-mail was sent to the student body inviting students to participate in the survey. As is the case with all convenience samples, the researcher should be cautious about assuming that the results generalize to the population at large. Despite this limitation, the empirical analyses are useful in demonstrating the ways in which improved measures of budgetary preferences could further the understanding of the structure and contours of public preferences.
Survey results
Table 1 reports summary statistics for mean responses by spending category for the entire sample and grouped by party. It also includes a measure of polarization calculated as the distance between the mean responses by party normalized by the mean amount for the entire sample. Lastly, a Gini coefficient is included as a measure of preference dispersion. The Gini coefficient captures whether a small portion of individuals account for a disproportionate amount of spending. 4
Summary statistics for spending categories.

The table rows are ordered from most to least polarized. The dimensions with the largest partisan differences are UN and EPA, followed by Military and Homeland Security. Publicly funded healthcare, which is traditionally seen as a highly politicized issue, is among the least polarized dimensions, both in terms of Gini coefficient and the distance between parties. To a lesser extent, this is also true of Social Services and Housing and Community.
One of the more surprising findings of the survey is the extent to which respondents differed from the President’s requested budget. This can be seen most clearly with respect to Military spending. Republican identifiers cut defence spending an average of $82 billion (14.9%) and Democratic identifiers cut defence spending an average of $238 billion (43.1%). This was seemingly at odds with the political environment at the time. Politicians were hardly divided on defence spending. Both John Kerry and George W. Bush had vocally campaigned to increase defence spending in the 2004 Presidential election. In Congress, the FY2006 spending bill for the Department of Defense passed unanimously in the Senate and claimed only a handful of Democratic dissenters in the House. Moreover, the survey results strongly contrast with results from traditional surveys. The 2004 National Election Survey asked participants to place themselves on a seven-point scale regarding favourability towards decreasing or increasing defence spending. Only 16.7 per cent leaned towards decreasing spending while 47.1 per cent leaned towards increasing spending, with 23.6 per cent keeping it the same. In contrast, 72.3 per cent of students cut defence spending, with strong majorities across most of the ideological spectrum.
The relationship between spending preferences and self-reported ideology on a liberal–conservative scale can be seen on a per issue basis in Figure 2, which plots the mean response for each spending dimension on self-reported ideology. The spending categories that exhibit stratification generally increase/decrease monotonically with ideological self-placement. Mean preferences for many spending categories vary linearly with self-reported ideology. In particular, demand for Military spending (conditional on demand on other spending dimensions) is strongly correlated with self-reported ideology. That, on average, preferences on a single continuous spending dimension correctly predict ideology says a great deal about the information captured by the raw measures.
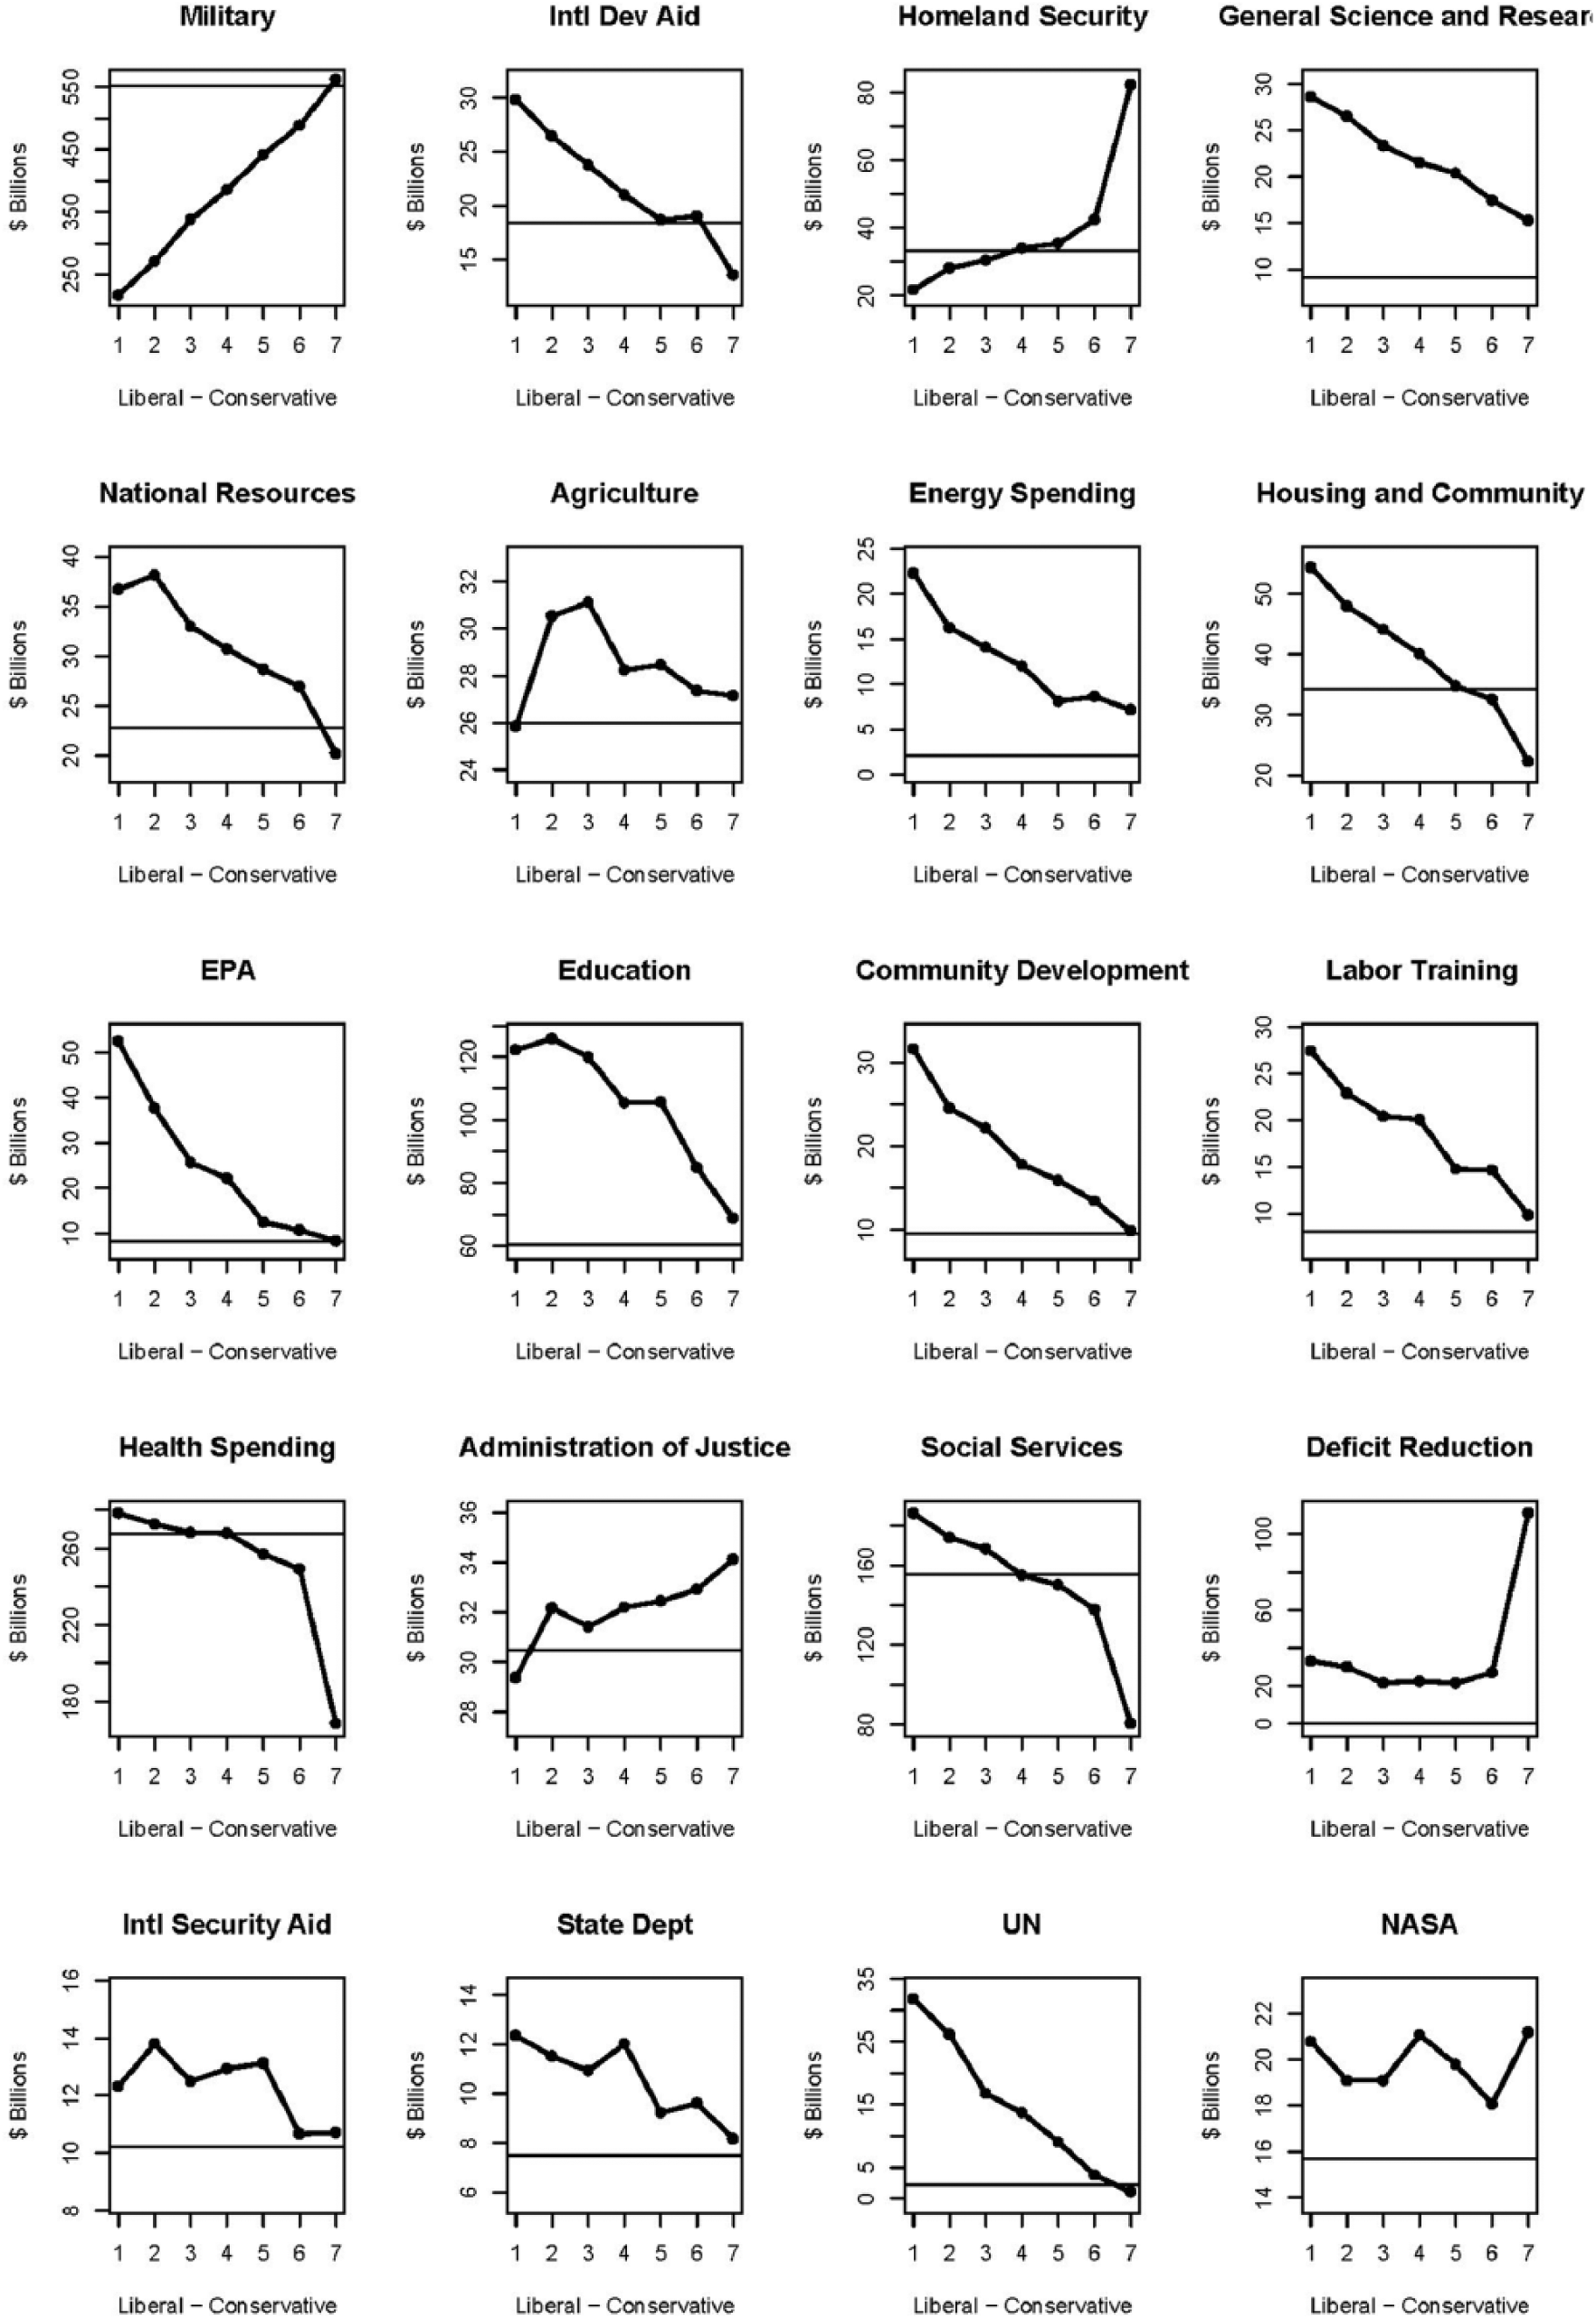
Mean preferences for spending dimensions plotted onto self-reported ideology. The horizontal lines represent the President’s requested budget for each dimension.
The structure of and dimensionality of fiscal preferences
This paper further explores the structure of fiscal preferences using multidimensional scaling techniques. An interesting feature of budget responses is that they closely map onto assumptions made by multidimensional scaling methods, particularly with respect to the shared metric, scale, and separability. This paper reports results from scaling performed via principal component analysis (PCA). PCA scales a second dimension orthogonal to the first and factors the correlation matrix directly, which eliminates limitations posed by singularity and allows all of the spending dimensions to be included in the model. Results from factor analysis with a Varimax rotation adjustment and deficit spending as the excluded dimension, are similar (see Appendix for details.)
A comparison of vote choice and party identification offers a validity check on the latent measures. For the model to be consistent with theoretical expectations, the first dimension should explain the variance in vote choice and party identification at rates comparable to ideological self-placement. Table 2 reports the correlation between measures. It shows that the first dimension correlates with ideological self-placement (ρ = 0.57) and party identification (ρ = 0.64), and is an equally strong predictor of presidential vote choice in the 2004 elections (ρ = 0.61). Although not entirely unrelated, the second PCA dimension is only weakly associated with partisan affiliation, vote choice, and ideological self-placement.
Correlations. Note: polychoric correlation is used when both variables are ordinal; polyserial correlation is used when one variable is ordinal and one variable is continuous.

Interpretable patterns arise from each of the two dimensions, as seen in Figure 3. The first dimension seems to map to the liberal–conservative spectrum and is primarily determined by demand for security spending. The issues that load positively on the first dimension are Military, Homeland Security, and to a lesser extent, Administration of Justice; the issues with the strongest negative loadings are Housing Aid, EPA, Community Development and UN and Peacekeeping, all predictably liberal issues. Deficit Reduction, NASA, State Department, and Health Spending, barely load on the first dimension.

The figure on the top displays the principal component analysis (PCA) loadings for spending categories on the first and second PCA dimensions. The figure on the bottom displays respondent ideal points projected on the PCA dimensions. The ideal points are colour coded by self-reported ideology. The proportion of variance (eigenvalue) explained by the first dimensions is 0.171. The additional proportion of variance explained by the second dimension is 0.103.
The second dimension reveals a dimensionality that has attracted little, if any, attention in previous research. This dimension distinguishes between demand for Health, Social Services, and Housing Aid on one end and EPA, General Science and Research, NASA, and Deficit Reduction on the other. This appears to reveal general preferences for public versus private goods and services. There is a clean distinction between rival and non-rival goods and services. Health, Social Services, and Housing Aid are private goods (rival and excludable). All spending categories at or above UN and Peacekeeping on the second dimension are public goods (non-rival and non-excludable). These spending categories focus on areas best thought of as societal investments that yield positive externalities either through research and technological advances (General Science and Research, NASA, and Energy Spending), fiscal responsibility (Deficit Reduction), foreign policy resources (State Department and UN and Peacekeeping), or through public safety (Administration of Justice).
While one might expect the rival/non-rival dimension to fit neatly within the framework of liberal–conservative ideology, the correlation between self-reported ideology and positions on the rival/non-rival dimension is a modest ρ = 0.17. This result is somewhat curious because the rival/non-rival dimension reflects relative support for redistributive spending, which is widely considered a core matter of disagreement between liberals and conservatives.
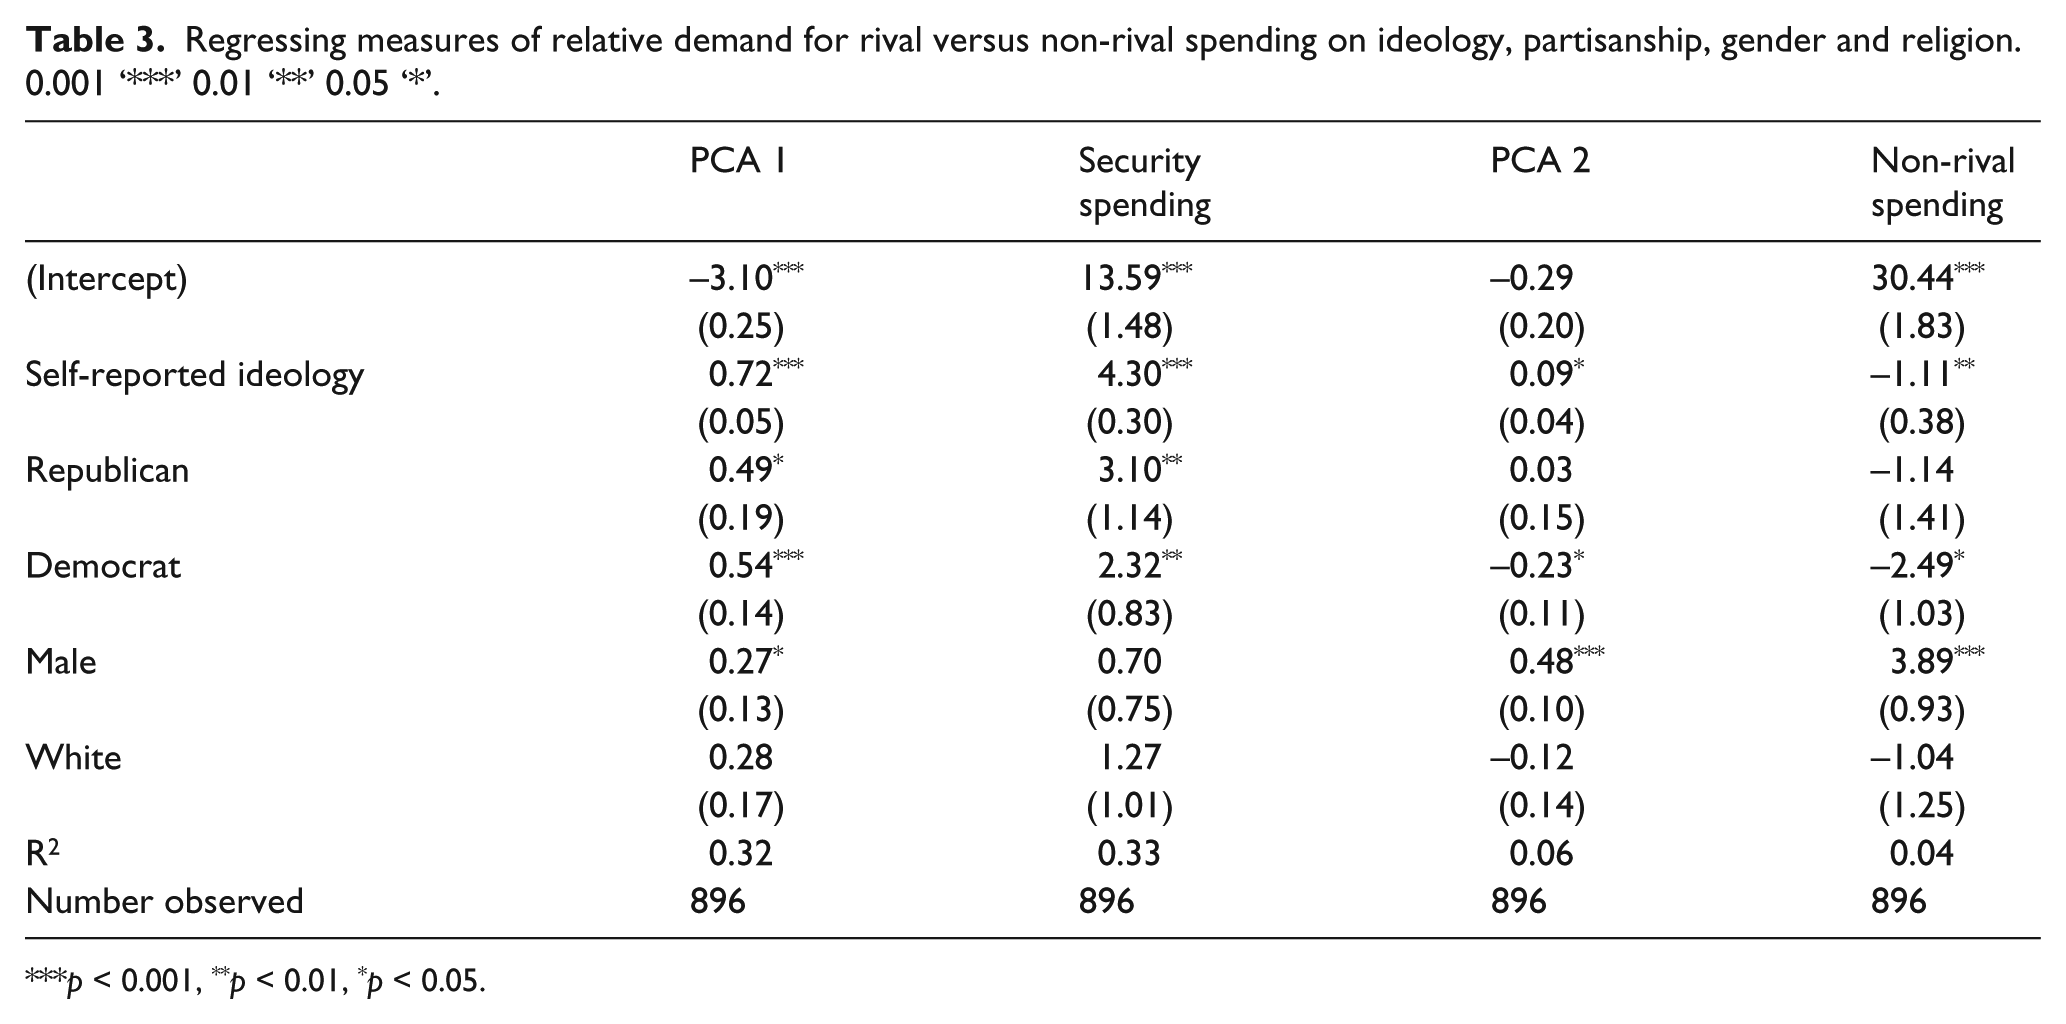
Given that positions on the rival/non-rival dimension are only weakly related to self-reported ideology and partisanship, what other factors might explain positions on the rival/non-rival dimension? In order to answer this question, this paper regresses two measures of relative demand for rival versus non-rival spending and two measures of demand for security spending, on self-reported ideology, partisanship, gender, and race.
5
As an exploratory tool, PCA aids in identifying the phenomena of interest but does not necessarily provide the best or most direct measures of these phenomena. Scores on the PCA dimensions are included as dependent variables but are accompanied by related measures constructed by bundling the related spending categories. The dependent variables in the first two columns of Table 3 measure demand for security spending. The dependent variable in the first column is the first dimension of the PCA, and the dependent variable in the second column is the total percentage allocated to security related spending, defined as Military, Homeland Security, and Administration of Justice. The remaining columns measure relative demand for rival/non-rival spending. The dependent variable in the third column is the second dimension of the PCA. Lastly, the dependent variable for the fourth column is the proportion of non-rival spending of the combined total of rival and non-rival spending, calculated as
Regressing measures of relative demand for rival versus non-rival spending on ideology, partisanship, gender and religion. 0.001 ‘***’ 0.01 ‘**’ 0.05 ‘*’.
p < 0.001, **p < 0.01, *p < 0.05.
The gender gap on the rival/non-rival spending dimension is the most pronounced feature of the data. On average, males are much less supportive of rival spending than females. Overall, the mean male position is 0.36 compared to -0.19 for females (p-value ≤ 0.001). Furthermore, the differences in means are statistically significant within and across partisan groups, establishing that the gender gap is not merely a residual of the gender gap in partisanship. The mean position for Republican males is 0.718 compared to 0.034 for Republican females (p-value ≤ 0.001). The mean position for Democratic males is 0.05 compared to -0.37 for Democratic females (p-value ≤ 0.01). Controlling for other characteristics in Table 3, males are associated with an increase of 0.48 higher on the second dimension. The alternative dependent variable calculated as relative proportion of non-rival spending affirms this result as well. As a proportion of total rival and non-rival spending, males on average give 3.89 per cent more funds to non-rival spending. Interestingly, after controlling for self-reported ideology and partisan affiliation, gender does not appear to be related to preferences for security spending.
Although interesting and suggestive, it is unclear whether these findings would generalize to a non-student sample. Nevertheless, the above demonstrates the potential of interactive survey data on budgeting preferences as a tool for measuring and exploring public opinion in new and revealing ways.
Conclusion
Fiscal preferences offer a unique window into the policy preferences of voters. By requiring respondents to account for budgetary trade-offs, the interactive budgeting questionnaire provides a more complete and meaningful measure of public budgeting preferences. It was found find that responses strongly contrast with what would be expected from conventional budgetary survey questions. This raises questions about the value of measuring budgeting preferences using the ‘increase/decrease/keep the same’ format, as well as many of the conclusions about voter competence that have been drawn from them. An alternative perspective suggests that the incoherent and woefully uninformed public revealed by past research on budgeting preferences is partly an artifact of how the questions are asked.
An attractive feature of the recovered budgetary preferences is the near perfect correspondence with the ideal type of multi-dimensional issue space posited by spatial models of politics. This makes for a rich environment in which to explore the structure of public preferences. An application in which multi-dimensional scaling techniques are used to explore the latent structure of budging preferences helps to demonstrate the improved empirical tractability associated with the data. In doing so, it hints at a previously unexplored ideological dimension that appears to be largely orthogonal to the liberal–conservative dimension that defines contemporary US politics. The generalizability of this finding merits further exploration.
The proposed approach to measuring public spending preferences is not without limitations. It is worth considering how a different questionnaire structure might have influenced responses. For instance, had the questionnaire provided the option to adjust revenue by manipulating tax rates, it seems likely that preferences over the total size of the government, as determined by the demand for taxes, would have overtaken, or at least merged with, security spending as the primary dimension. Moreover, decisions about how to group spending into budget categories might also have influenced results. For instance, had spending on transportation been divided into spending on highways versus spending on mass transit, it may have been more a divisive issue. The decision to replicate the budget categories used by Congress in large part reflects these concerns. However, the budgeting categories used by Congress and the President were arguably constructed in a similarly arbitrary manner. Control over how they are constructed is a likely source of agenda power (Shepsle and Weingast, 1981).
Future directions of research might attempt to address some of these questions through extensions to the questionnaire. If respondents prove to be sensitive to changes in categorization, it may shed light on the Congressional budgeting process. Another promising extension would be to use survey experiments to gain a better understanding of agenda control in the federal budgeting process. These suggested extensions highlight that adopting new approaches to measuring budgeting preferences may give researchers both a new tool for understanding public preferences in this important area, and new opportunities to test how institutional features of the budgeting process affect outcomes.
Footnotes
Appendix A: Comparisons with factor analysis with Varimax rotation
Declaration of Conflicting Interest
The authors declare that there is no conflict of interest.
Funding
This research received no specific grant from any funding agency in the public, commercial, or not-for-profit sectors.