
Abstract
This study revisits an important recent article about racial bias and finds that many of its inferences are weakened when we analyze the data more completely. DeSante in 2013 reported evidence from a survey experiment indicating that Americans reward Whites more than Blacks for hard work but penalize Blacks more than Whites for laziness. However, the present study demonstrates that these inferences were based on an unrepresentative selection of possible analyses: the original article does not include all possible equivalent or relevant analyses, and when results from these additional analyses are combined with the results reported in the original article, the strength of inferences is weakened. Moreover, newly-reported evidence reveals heterogeneity in racial bias: respondents given a direct choice between equivalent targets of different races favored the Black target over the White target. These results illustrate how the presence of researcher degrees of freedom can foster production of inferences that are not representative of all inferences that a set of data could produce. This study thus highlights the value of preregistering research design protocols and required public posting of data.
Introduction
Identifying racial bias is an important goal in political science. DeSante (2013a) reported evidence of a nuanced anti-Black bias in which persons penalized Blacks more than Whites for laziness but rewarded Blacks less than Whites for hard work. However, reanalysis reveals that several key inferences in DeSante’s study were based on an unrepresentative set of possible analyses.
Review of the experiment
The DeSante (2013a) experiment from the 2010 Cooperative Congressional Election Studies module surveyed 1000 US adult respondents, who were coded as White (751), Black (96), Hispanic (84), Asian (12), Native American (7), Mixed (20), and Other (30). Respondents were asked to divide US$1500 between an applicant for state assistance who was said to need US$900, another applicant for state assistance who was said to need US$900, and a fund to offset the state budget deficit. Respondents were shown an application for state assistance that varied along two elements: first, the applicant name varied—it was either left blank (no name was provided), was a name intended to indicate a White female (Laurie or Emily), or was a name intended to indicate a Black female (Keisha or Latoya). Second, the Worker Quality Assessment for the applicant varied—either it was not provided, it indicated a poor assessment (signaling laziness), or it indicated an excellent assessment (signaling hard work). Condition characteristics and mean allocations in each condition are reported in Table 1.
Experimental condition descriptions and mean allocations.

Reported and unreported comparisons
All data are from DeSante (2013b) and are unweighted. t-tests were conducted with equal variances assumed, and reported p-values are two-tailed p-values unless otherwise indicated. The notation [X/Y] indicates an allocation of funds to applicant X in condition Y.
Table 2 of DeSante (2013a: 350) reports results from 11 t-tests to compare allocations in selected conditions. Test 1 compared the US$579 allocated to the unnamed worker with no Worker Quality Assessment in [1/1] with the US$644 allocated to the unnamed worker with an excellent Worker Quality Assessment in [1/2] (a US$65 difference, p=0.09); but the same test could have been conducted by comparing the US$595 allocated to the unnamed worker with no Worker Quality Assessment in [2/1] with the US$618 allocated to the unnamed worker with an excellent Worker Quality Assessment in [2/3] (a US$23 difference, p=0.56). 1 Similarly, test 2 in DeSante (2013a) compared the US$595 allocated to the unnamed worker with no Worker Quality Assessment in [2/1] with the US$416 allocated to the unnamed worker with a poor Worker Quality Assessment in [2/2] (a US$179 difference, p<0.0001). The same test, however, could have been conducted by comparing the US$579 allocated to the unnamed worker with no Worker Quality Assessment in [1/1] with the US$512 allocated to the unnamed worker with a poor Worker Quality Assessment in [1/3] (a US$67 difference, p=0.08). Figure 1 displays this pattern of comparison.
Combined effects for reported and unreported analyses.
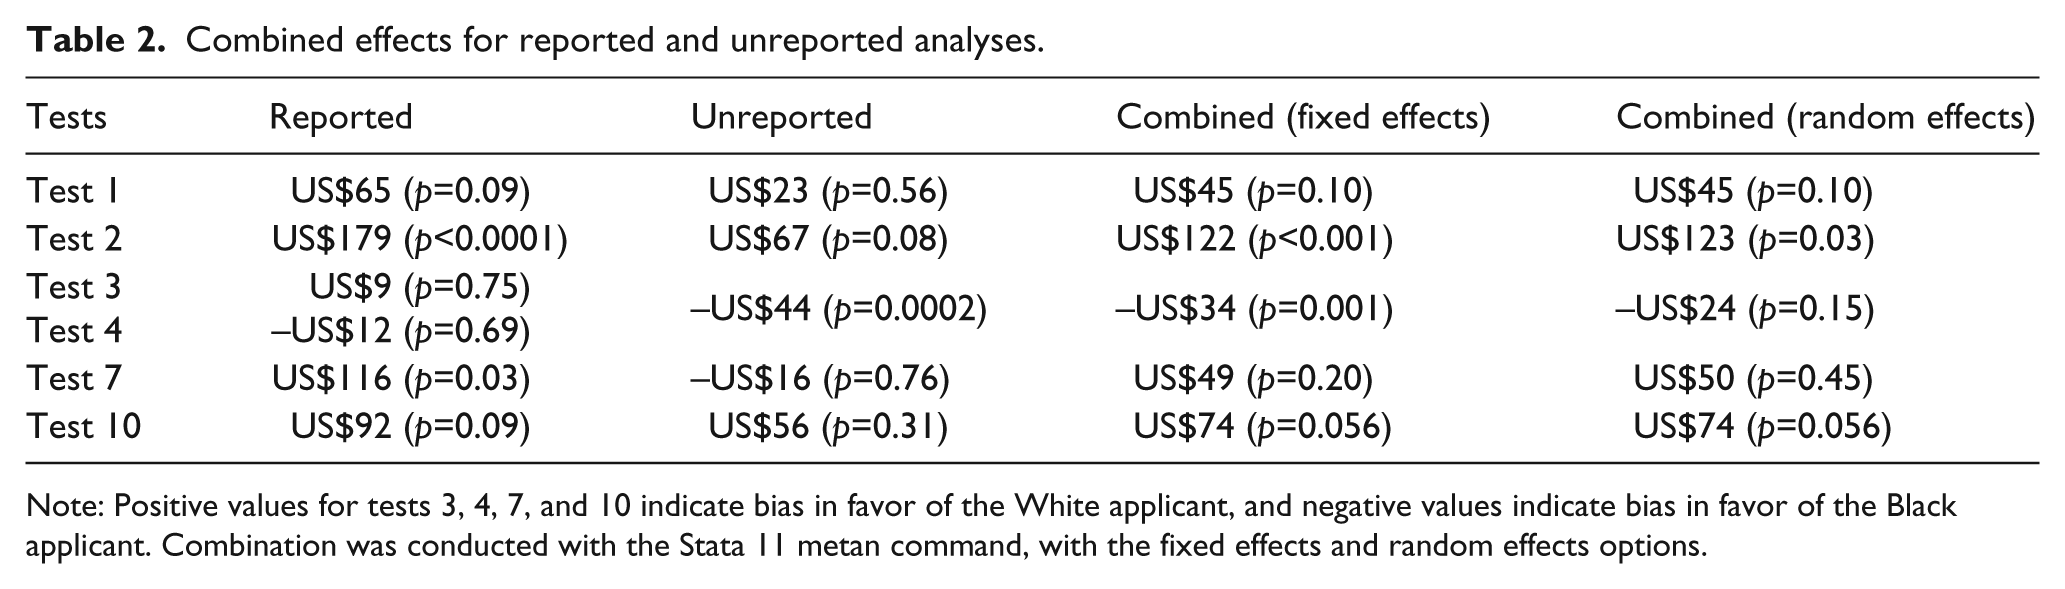
Note: Positive values for tests 3, 4, 7, and 10 indicate bias in favor of the White applicant, and negative values indicate bias in favor of the Black applicant. Combination was conducted with the Stata 11 metan command, with the fixed effects and random effects options.

Reported and unreported comparisons for Test 1 and Test 2. Dots indicate the mean allocations to applicants with the given characteristics. Solid lines indicate comparisons reported in DeSante (2013a), and dashed lines indicate equivalent comparisons not reported in DeSante (2013a). WQA: Worker Quality Assessment.
DeSante (2013a: 349) reported the results of tests 3 and 4 as follows: ‘[n]either test shows any significant difference, meaning that white applicants are not rewarded any more than blacks on the basis of race alone.’ Test 3 compared Laurie in [1/7] to with Latoya in [1/10], both of whom were paired with Keisha and had no Worker Quality Assessment. Test 4 compared Emily in [2/4] with Keisha in [2/7], both of whom were paired with Laurie and had no Worker Quality Assessment. The respective differences in allocation were US$9 favoring Laurie (p=0.75) and US$12 favoring Keisha (p=0.69). However, respondents in condition 7, who were presented with a direct choice between Laurie and Keisha (neither of whom had a Worker Quality Assessment), allocated US$44 more on average to Keisha than to Laurie (p=0.0002), representing bias in favor of the Black applicant. Figure 2 displays this pattern of comparison.

Reported and unreported comparisons for Test 3 and Test 4. Dots indicate the mean allocations to applicants with the given characteristics. Solid lines indicate comparisons reported in DeSante (2013a), and the dashed line indicates a relevant comparison not reported in DeSante (2013a). WQA: Worker Quality Assessment.
DeSante (2013a) tests 5, 6, and 7 form a group. Test 5 compared Emily in [2/4] with Emily in [2/6] to assess how much an excellent Worker Quality Assessment increased Emily’s allocation relative to Laurie (US$123, p=0.001); test 6 compared Keisha in [2/7] with Keisha in [2/9] to assess how much an excellent Worker Quality Assessment increased Keisha’s allocation relative to Laurie (US$7, p=0.85); and test 7 assessed the difference in these differences (US$116, p=0.03). But the same assessment could have been conducted as follows: compare Laurie in [1/7] with Laurie in [1/8] to assess how much an excellent Worker Quality Assessment increased Laurie’s allocation relative to Keisha (US$64, p=0.09); compare Latoya in [1/10] with Latoya in [1/11] to assess how much an excellent Worker Quality Assessment increased Latoya’s allocation relative to Keisha (US$81, p=0.03); and assess the difference in these differences: US$16, favoring the Black applicant (p=0.76). Figure 3 displays this pattern of comparison.

Solid lines indicate comparisons reported in DeSante (2013a), and dashed lines indicate equivalent comparisons not reported in DeSante (2013a). The comparison applicant was Laurie for the left side of the figure and Keisha for the right side of the figure. WQA: Worker Quality Assessment.
DeSante (2013a) tests 8, 9, and 10 also form a group. Test 8 compared Emily in [2/4] with Emily in [2/5] to assess how much a poor Worker Quality Assessment decreased Emily’s allocation relative to Laurie (US$21, p=0.55); test 9 compared Keisha in [2/7] with Keisha in [2/8] to assess how much a poor Worker Quality Assessment decreased Keisha’s allocation relative to Laurie (US$113, p=0.007); and test 10 assessed the difference in these differences (US$92, p=0.09). But the same assessment could have been conducted as follows: compare Laurie in [1/7] with Laurie in [1/9] to assess how much a poor Worker Quality Assessment decreased Laurie’s allocation relative to Keisha (US$56, p=0.13); compare Latoya in [1/10] with Latoya in [1/12] to assess how much a poor Worker Quality Assessment decreased Latoya’s allocation relative to Keisha (US$112, p=0.007); and assess the difference in these differences: US$56, favoring the White applicant (p=0.31). Figure 3 displays this pattern of comparison.
Reducing inferential selection bias
These results illustrate inferential selection bias: inferences drawn from reported comparisons differ from inferences drawn from a different set of equivalent or relevant unreported comparisons. Inferential selection bias is possible because of ‘researcher degrees of freedom,’ a situation in which a hypothesis can be tested multiple ways (Simmons et al., 2011: 1359). In such cases, it is preferable to ‘analyze all relevant comparisons’ (Gelman and Loken, 2013: 14). Pre-registration of research designs has been proposed as a solution to researcher degrees of freedom (Monogan, 2013), and preregistering all relevant comparisons in DeSante (2013a) could have caused concern that some planned comparisons produce statistically significant differences by chance. For experiments in which a hypothesis can be tested multiple ways, results can be combined in a meta-analysis. Table 2 presents such combined results for key tests in DeSante (2013a): point estimates for tests 1, 2, 7, and 10 were lowered.
The influence of racial resentment
DeSante (2013a) also presents evidence regarding the influence of racial resentment on allocations to offset the state budget deficit. The first three models in Table 3 of the present study report results from the three models in Table 3 of DeSante (2013a: 352). DeSante’s models predicted allocations made by White respondents to offset the state budget deficit. In these models, racial resentment (RR) appears as both an explanatory variable and as an explanatory variable interacted with the race of applicants in a condition. WW indicates a condition with two White applicants, WB indicates a condition with one White applicant and one Black applicant, and BB indicates a condition with two Black applicants. The original DeSante (2013a: 351) study interprets model 3’s results as follows:
As seen by the large negative sign for racial resentment interacted with two white applicants (RR × WW), the presence of white applicants attenuates the effect of racial resentment on a desire for fiscal responsibility. Clearly, race matters when evaluating applicants for welfare and, when given an ‘acceptable’ alternative to spending the money, those who are most racially resentful will allocate money to decrease a state’s deficit, but at a far lesser rate when evaluating white applicants for welfare. In summation, those who are most racially resentful are willing to spend much more on welfare when the applicants are both white than when applicants are black.
The effect of racial resentment on allocations to offset the state budget deficit.

Note: The dependent variable is the allocation to offset the state budget deficit instead of assistance to one or the other applicant. Numeric cell entries are coefficients, with standard errors in parentheses; to mirror asterisks in DeSante (2013a), an asterisk (*) indicates statistical significance at the p⩽0.10 level (two-tailed test). Following DeSante (2013a), the sample for analyses reported in this table was restricted to respondents coded as White. Bold face indicates the key row highlighted in DeSante (2013a) regarding the interaction of racial resentment and the race of the applicants.
But category variables must be interpreted relative to the omitted category, which in model 3 is for two unnamed applicants. Thus, the RR × WW result in model 3 indicates only that the influence of racial resentment was different for two White applicants compared with two unnamed applicants. The left side of Figure 4 presents the RR × WW model 3 comparison: for two unnamed applicants, respondents at the highest level of racial resentment allocated US$551 more to offset the state budget deficit than respondents at the lowest level of racial resentment; but for two White applicants, respondents at the highest level of racial resentment allocated only US$213 more to offset the state budget deficit than respondents at the lowest level of racial resentment (a US$338 difference, p=0.060).

The mean allocations to offset the state budget deficit. The left side of the figure indicates the model 3 comparison from DeSante (2013a), a statistically significant difference in the influence of racial resentment for conditions with two White applicants compared with conditions with two unnamed applicants. The right side of the figure indicates the model 4 comparison from the present study, a non-statistically significant difference in the influence of racial resentment for conditions with two White applicants compared with conditions with two Black applicants.
However, the right side of Figure 4 presents the relevant comparison: the US$213 difference caused by racial resentment in the condition with two White applicants, compared with the US$355 difference caused by racial resentment in the condition with two Black applicants (a US$142 difference, p=0.41), indicated by results for RR × WW in model 4, with BB the omitted category. Thus, when comparing conditions with two White applicants and conditions with two Black applicants, there is insufficient evidence to support the inference of a difference in the effect of racial resentment on allocations to offset the state budget deficit.
Conclusions
DeSante (2013a) presents evidence of anti-Black bias, but reanalysis of the data indicates that much of the evidence is weaker than the original analysis suggested. The direction of results for RR was as expected: respondents low in racial resentment offered similar amounts of money to offset the state budget deficit for two Black applicants for two White applicants, but respondents high in RR offered more to offset the deficit for two Black applicants than for two White applicants. This difference, however, was not statistically significant. When we reassess evidence on the deservingness of applicants, combined results indicate reasonable evidence that Blacks are penalized more than Whites for laziness (test 10), but mixed evidence that Blacks are rewarded less than Whites for hard work (test 7). It is possible that some of the difference in results between reported and unreported tests reflects differences in responses to the names of applicants, rather than the race associated with the names.
Reported results reflect heterogeneity in bias. On the one hand, DeSante (2013a) test 11 indicated that respondents allocated on average US$107 more to offset the state budget deficit, and therefore less to the applicants, across conditions with two Black applicants compared with two White applicants (p=0.005). Consistent with this pattern, respondents on average allocated US$64 more to offset the state budget deficit across conditions with one Black and one White applicant, when compared with conditions with two White applicants (p=0.10). On the other hand, condition 7, which provided a choice between Laurie and Keisha, revealed that respondents allocated more to a Black applicant than to an equivalent White applicant when given a direct choice. Taken together, results are more consistent with subconscious racial bias instead of racial animus, given that the bias in favor of White applicants reversed for respondents who were aware that they were making an allocation choice between equivalent Black and White applicants.
These analyses also illustrate the value of preregistering research plans and publicly posting data. Preregistration permits readers to distinguish confirmatory tests from exploratory analyses and protects researchers from claims that reported analyses were selected to support a preferred result. Lack of preregistration provides researchers flexibility in analyzing data, so readers might be concerned that results from reported analyses are not representative of results from all reasonable analyses that could have been conducted. In such cases, public posting of the data would provide readers with the opportunity to assess for themselves whether reported results are representative.
Footnotes
Acknowledgements
The author thanks the editors and anonymous reviewers who provided comments on the manuscript.
Declaration of conflicting interest
The author declares that there is no conflict of interest.
Funding
This research received no specific grant from any funding agency in the public, commercial, or not-for-profit sectors. The original article (DeSante, 2013a) acknowledged data collection support from the Social Science Research Institute and Duke University.