
Abstract
Here I propose procedural replication as a method for diagnosing errors and omissions and identifying research artifacts in published studies. The goal of procedural replication is not to make substantive contributions so much as improve research practice, or how scientists go about doing science. This is accomplished by generating checklists of lessons learned that scholars can use to assess the reliability of new or existing studies, guide editorial reviews, and make scientific knowledge production more reliable. I demonstrate the method by implementing a procedural replication of Michael Ross’s controversial finding that democracy has no effect on child mortality. I find this null finding is an artifact of the way five-year averages were computed and the static nature of the preferred model. I demonstrate, using causal diagrams, how concerns about listwise deletion and selection bias affecting previous studies may have been overstated. I also provide a checklist with lessons learned.
Keywords
Introduction
The impact of regime type on welfare outcomes is a topic of great importance. Against the prevailing consensus, a recent study finds “little evidence that the rise of democracy contributed to the fall in infant and child mortality rates” in the period between 1970 and 2000 (Ross, 2006: 872). 1 According to the study, the negative association between democracy and infant and child mortality reported in previous studies disappears once corrections are made for additive, time-invariant, unobserved heterogeneity; common time trends; and selection bias from listwise deletion. Here, I report results from a procedural replication of this finding. I show this null result is an artifact of a highly restrictive dynamic specification. I also find that concerns about selection bias in previous studies may have been overstated. Finally, I document sources of errors and omissions in a checklist that scholars can use to assess the reliability of new or existing studies, guide editorial reviews, and make scientific knowledge production more reliable.
Ross’s (2006) null finding has wide ranging theoretical, policy, and practical implications. It questions core theories of representation, electoral accountability, and redistribution (Boix, 2003; Bueno de Mesquita et al., 2003b; Lake and Baum, 2001; Meltzer and Richard, 1983); and it questions democracy’s constructive and direct roles in the conceptualization and satisfaction of needs (Sen, 2000). It also provides evidence against the desirability of political conditionality in foreign aid (Alesina and Dollar, 2000; Crawford, 1997). Moreover, by toning down the perceived accomplishments of democracy, it can also influence the very process of democratization via problem definition (Rochefort and Cobb, 1993), preference formation (Druckman and Lupia, 2000), and political persuasion (Cobb and Kuklinski, 1997). As a testament to this importance, Ross’s (2006) study has been cited over 300 times. 2
Replication studies remain highly controversial. One reason for this is that social scientists disagree on what constitutes a replication study, how they are done, and for what purpose (Anderson et al., 2008; Berthon et al., 2002; Bueno de Mesquita et al., 2003a; Burman et al., 2010; Gelman, 2013; Herrnson, 1995; Ishiyama, 2014; King, 1995; McCullough et al., 2008; Schmidt, 2009). For example, many scholars are adamant that replication studies should make a substantive − as opposed to procedural – contribution. In this view replications are completely uninteresting unless accompanied by a new discovery. Yet from the point of view of research practice, or the study of how scientists do science, a primary goal of replication studies is to identify research artifacts, diagnose sources of errors and omissions, and document lessons learned through checklists, guidelines, and assessment scales. 3
It is a mistake to think all replication studies should make a substantive contribution. First, such replication studies often struggle with the question of where the replication ends, and a new study begins. After all, most scientific studies are nothing but replication studies with extensions and new findings (King, 2006: 1). Second, replication studies that aim to make a substantive contribution often relegate the details of the replication – what went wrong and lessons learned – to a footnote, thus forsaking an opportunity to inform and improve research practice. Third, these studies often focus on contentious solutions rather than on diagnosing errors and omissions, yet diagnosis is central to prevention and remediation. For example, procedural checklists can help bring problematic areas to the attention of researchers and reviewers, whilst avoiding contentious debates about specific solutions that are best resolved in the context of specific applications.
Here I introduce procedural replication, a formal method to diagnose errors and omissions, identify research artifacts, and contribute new (or improved) checklists that scholars can use to inform future research, streamline editorial reviews, and improve research practice. The replication proceeds in two steps. First, I conduct a pure replication to infer the exact procedures and technologies, or scientific standard, used in producing the original study outputs. Second, I undertake a critical evaluation of the inferred standard, including a checklist to prevent future errors and omissions. The focus of the evaluation step is on “what to look out for,” not what an ideal study would do; and on problematic areas rather than contentious solutions. Standard replication studies aim to make substantive contributions by changing data, model specifications, estimators or inference procedures. By contrast, procedural replications aim to improve research practice and the reliability of scientific knowledge production by reporting sources of errors and omissions.
This case-study in research practice proceeds as follows. The section titled “Data” describes the data in the replication file. “Pure replication” presents results from a pure replication, including inferences about the scientific standard used in the original study. “Diagnosing errors and omissions in the inferred scientific standard” demonstrates how a minor change to the way quinquennial averages are computed is enough to reverse the null finding, and how concerns about selection bias from listwise deletion may be overblown. The article ends with “Conclusion.”
Data
In response to a request for replication materials for Ross’s (2006) study “Is democracy good for the poor?” the author kindly provided the following: (1) a raw annual frequency data set; (2) a quinquennial frequency data set used in the analysis (the dependent variable is only available every five to 10 years so all annual data are collapsed to quinquennial frequency); and (3) five quinquennial frequency multiply imputed data sets. The estimation results using the quinquennial frequency data and the multiply imputed data were sourced from the published manuscript. The original computer code, random seed for multiple imputation, and other elements of the procedures used to generate the estimates could not be obtained. Even so, judging from information in the published paper and replication file I infer that the principal software platforms used were Stata, R (R Core Team, 2013), and Amelia I (King et al., 2001). The exact version of each could not be determined.
Pure replication
The objective of a pure replication is to infer the exact procedures and technologies used in the original article and to document potential errors and omissions. These are then diagnosed further at the evaluation stage (see “Diagnosing errors…”). The pure replication was done in three steps. First, I reproduced the quinquennial frequency estimation data from the raw annual data using the exact same procedures reported in the original article. Next, I tried to reproduce the listwise deleted estimation results. Finally, I did the same with multiply imputed data and results. I report the findings from each step below.
Replicating the estimation dataset
First, the available replication data are incomplete. Collapsing the raw annual data into quinquennia by computing five-year averages I was unable to replicate the key measure of democracy – the polity variable – in the quinquennial estimation data set. 4 In addition, the adult HIV prevalence and democratic years variables were both missing from the annual dataset, so I could not replicate their quinquennial averages in the estimation dataset. All other variables in the original quinquennial frequency dataset could be replicated from the annual data with the exception of real GDP (gross domestic product) per capita, where I found minor differences for the UK, Greece, Ireland and Thailand between the quinquennial data in the replication file, and the corresponding five-year averages I computed from the annual data.
Second, the original study computes quinquennial data using a forward average. As shown in “Diagnosing errors…” this can severely dampen the estimated effect of democracy on child and infant mortality. For example, mortality data for the 1970 quinquennium refers to mortality in the year 1970. These data are regressed on the Polity data for the 1965 quinquennium. However, the latter is computed as a forward average for the years 1965–1969, which is centered in 1967, and not the centered average for the years 1963–1967, which centered in 1965. This is closer to a three year than a five year lag.
Third, the original study’s criteria for defining the population of interest – sovereign countries having a population larger than 200,000 − are ambiguous. In effect the study uses an artificially balanced panel of 169 countries for the quinquennia 1970, 1975, …, 2000 (see Table 1). This panel excludes extinct countries (like the USSR) and includes extrapolations for non-sovereign country years (like Ukraine prior to 1989). As a result, the original study sample contains 14% more annual “observations” than Przeworski et al.’s (2000) unbalanced panel of sovereign country years, which, by recording history as it happened, avoids extrapolations and includes deceased entities. As shown in “Diagnosing errors…,” the extra observations in artificially balanced panels can inadvertently deflate standard errors. 5
Summary statistics for Ross’s quinquennial data set, 1970–2000.

Data for 169 countries observed over the quinquennia 1970, 1975, …, 2000. In general data are forward quinquennial averages of annual data (e.g. the quinquennial datum for 1970 is the arithmetic average of the log annual data for the years 1970–1974 inclusive). These averages are computed ignoring missing values. Over 30% of mortality data from various sources are observed as missing in the quinquennial data. The equivalent figure for the annual data is 80%. Lagged variables are lagged one quinquennium.
WB: World Bank; GDP: gross domestic product
Fourth, the original study did not use the available data efficiently or consistently. With two exceptions, all annual data prior to 1970 were discarded before computing the quinquennial averages and their lagged values. 6 Consequently all lagged values for the 1970 quinquennia, which refer to 1965–1969, are missing even if annual data are available for these years. Some of these observations were then imputed manually before multiple imputation (see Table 2).
Summary statistics for Ross’s quinquennial data set, 1970.
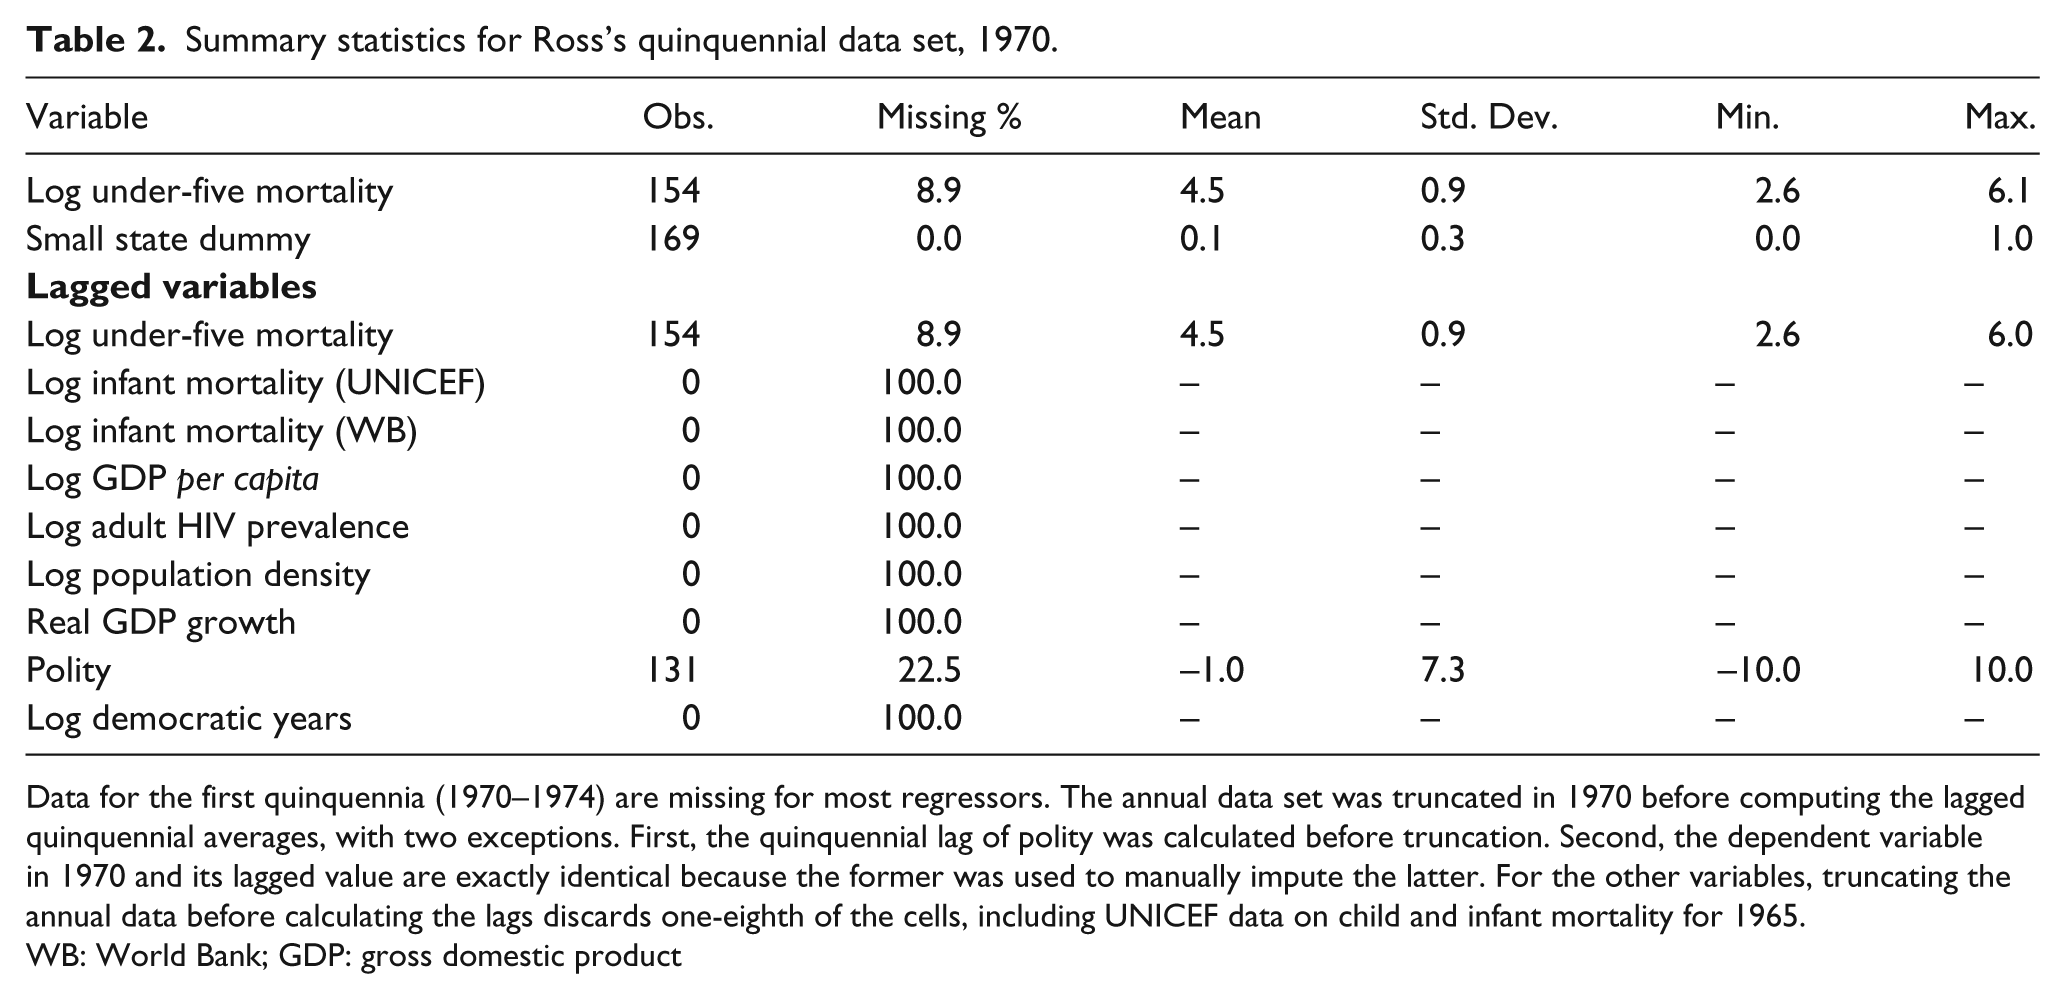
Data for the first quinquennia (1970–1974) are missing for most regressors. The annual data set was truncated in 1970 before computing the lagged quinquennial averages, with two exceptions. First, the quinquennial lag of polity was calculated before truncation. Second, the dependent variable in 1970 and its lagged value are exactly identical because the former was used to manually impute the latter. For the other variables, truncating the annual data before calculating the lags discards one-eighth of the cells, including UNICEF data on child and infant mortality for 1965.
WB: World Bank; GDP: gross domestic product
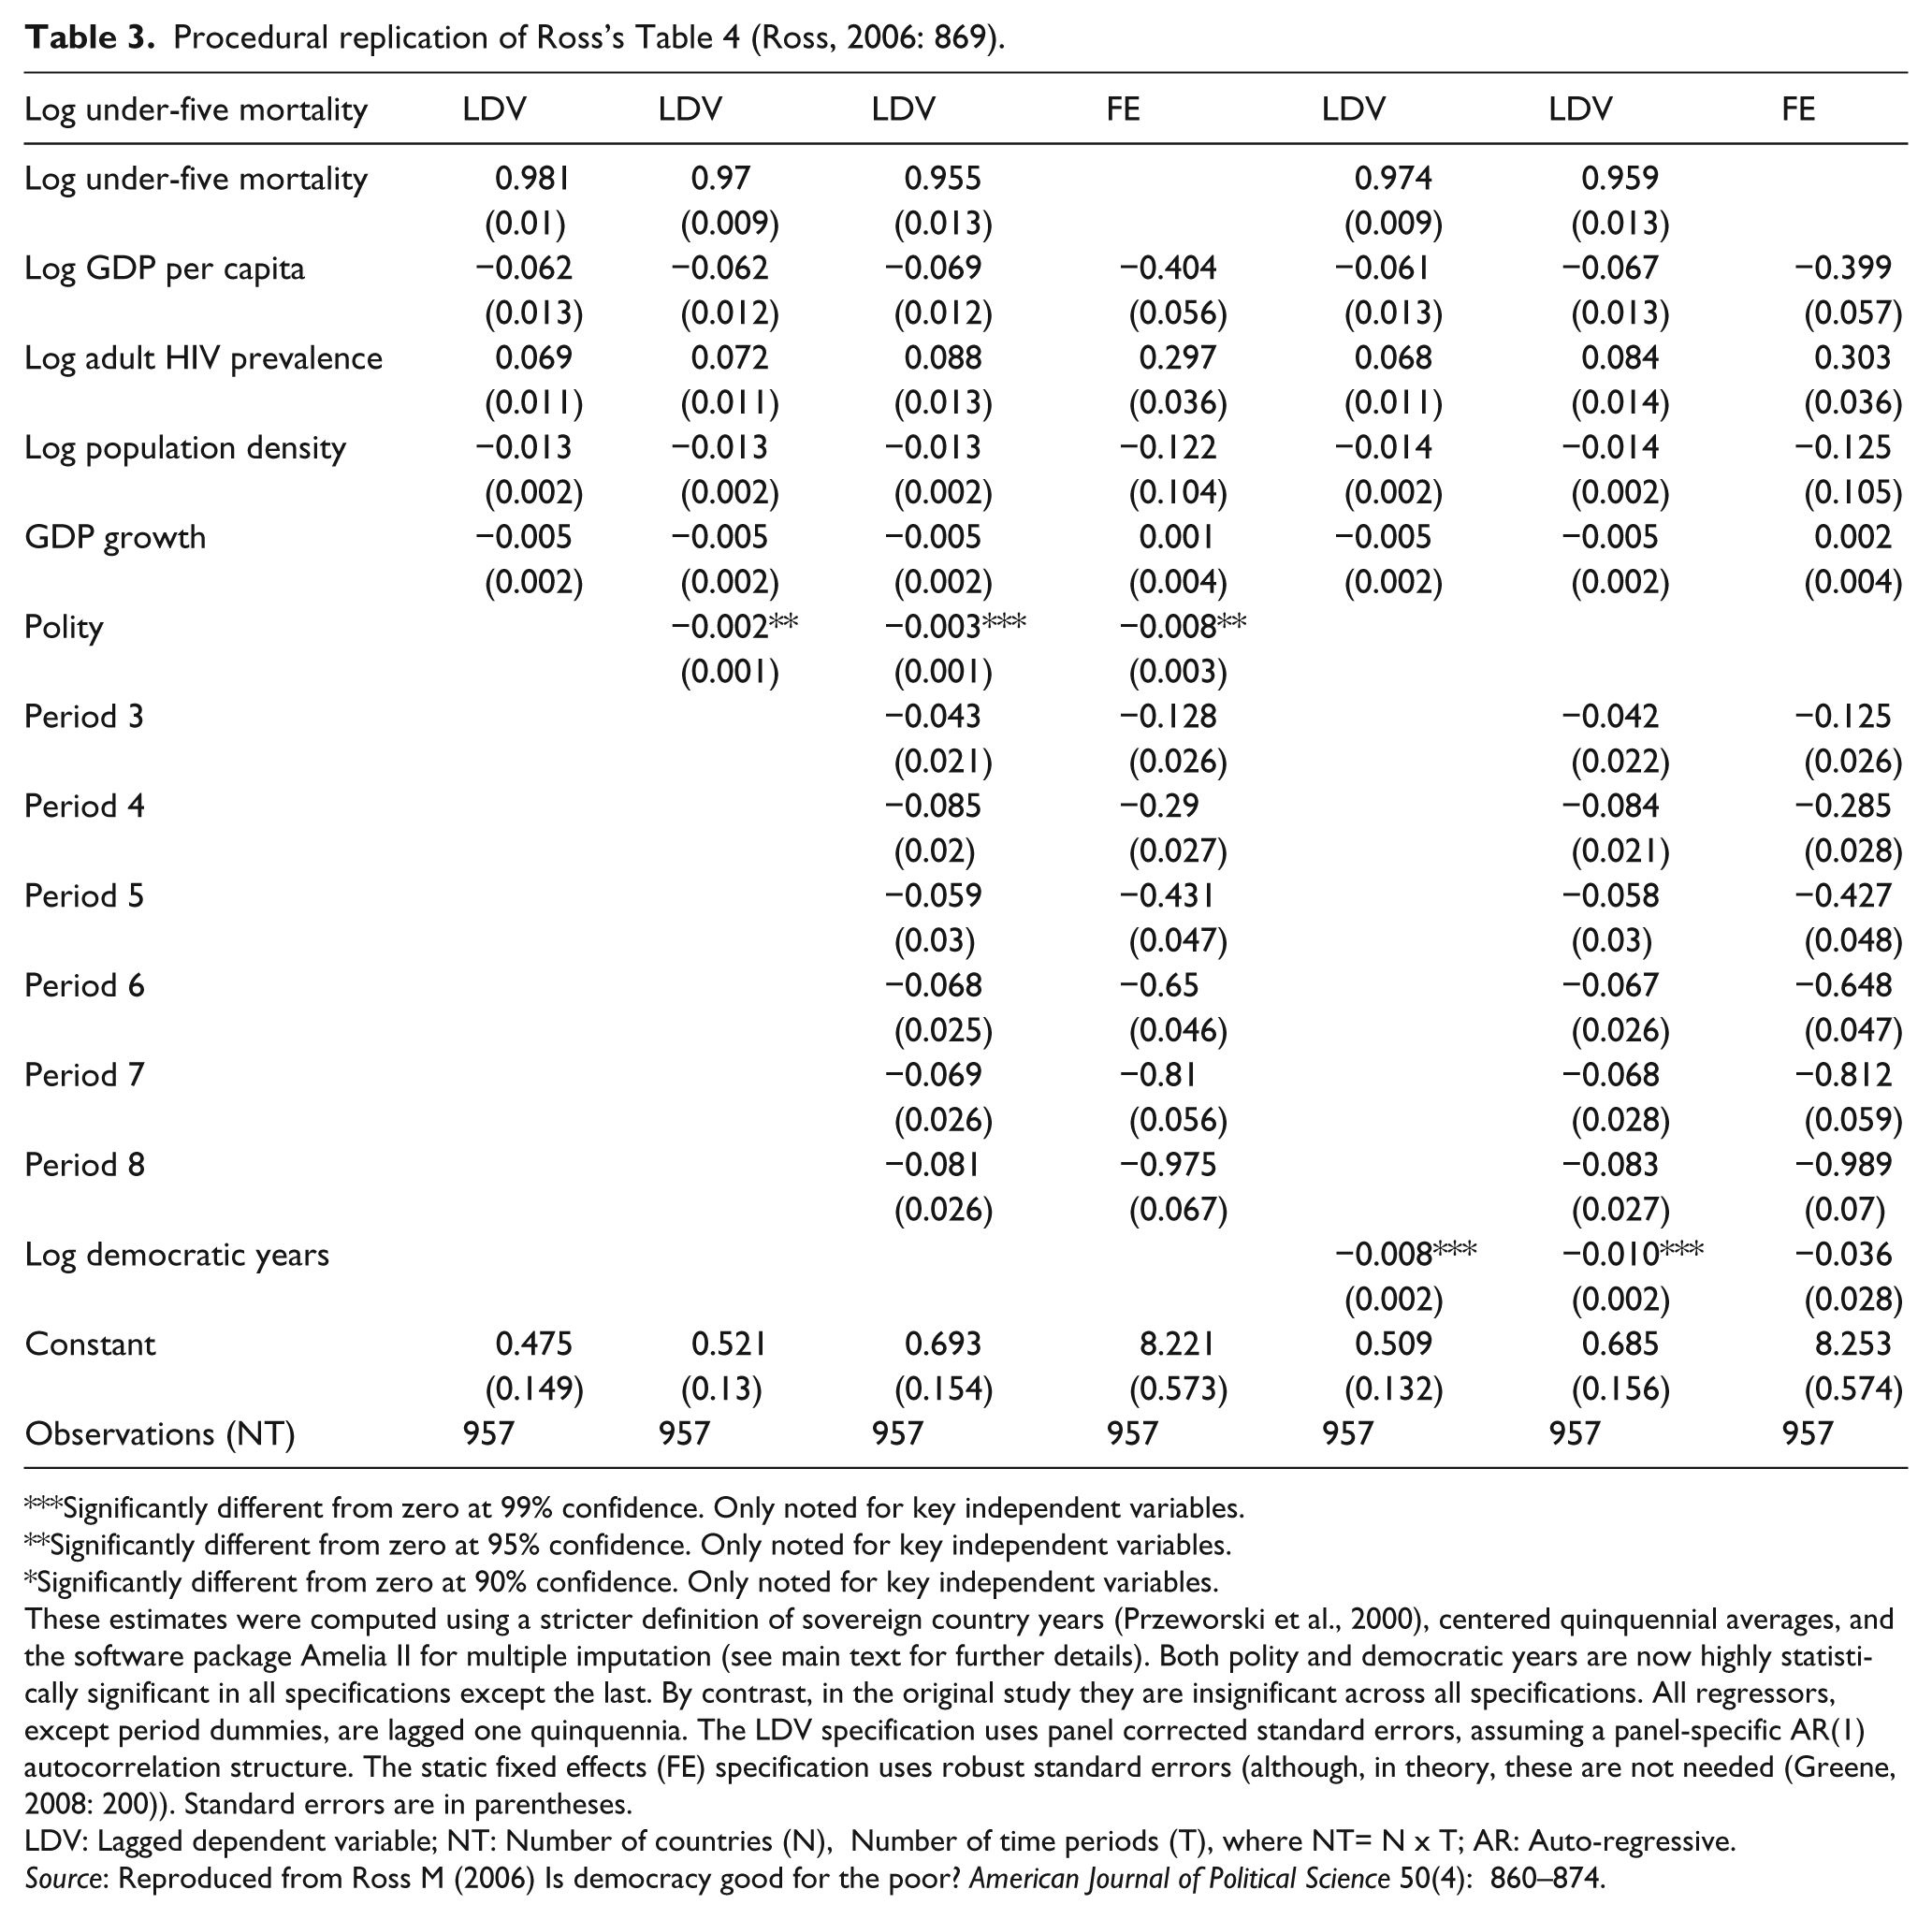
Using the quinquennial data in the replication file, I was able to replicate exactly the listwise deleted results reported in Table 3 of the original study (Ross, 2006: 869). However, I found both the R2 and dependent variable are misreported. The reported R2 measures the overall as opposed to the within-country variation. 7 Furthermore, the dependent variable used in Tables 3 and 4 of the original study is not UNICEF’s child mortality rate (Ross, 2006: 866), but rather the World Bank’s under-five mortality rate, which has the most missing cells.
Procedural replication of Ross’s Table 4 (Ross, 2006: 869).
Significantly different from zero at 99% confidence. Only noted for key independent variables.
Significantly different from zero at 95% confidence. Only noted for key independent variables.
Significantly different from zero at 90% confidence. Only noted for key independent variables.
These estimates were computed using a stricter definition of sovereign country years (Przeworski et al., 2000), centered quinquennial averages, and the software package Amelia II for multiple imputation (see main text for further details). Both polity and democratic years are now highly statistically significant in all specifications except the last. By contrast, in the original study they are insignificant across all specifications. All regressors, except period dummies, are lagged one quinquennia. The LDV specification uses panel corrected standard errors, assuming a panel-specific AR(1) autocorrelation structure. The static fixed effects (FE) specification uses robust standard errors (although, in theory, these are not needed (Greene, 2008: 200)). Standard errors are in parentheses.
LDV: Lagged dependent variable; NT: Number of countries (N), Number of time periods (T), where NT= N x T; AR: Auto-regressive.
Source: Reproduced from Ross M (2006) Is democracy good for the poor? American Journal of Political Science 50(4): 860–874.
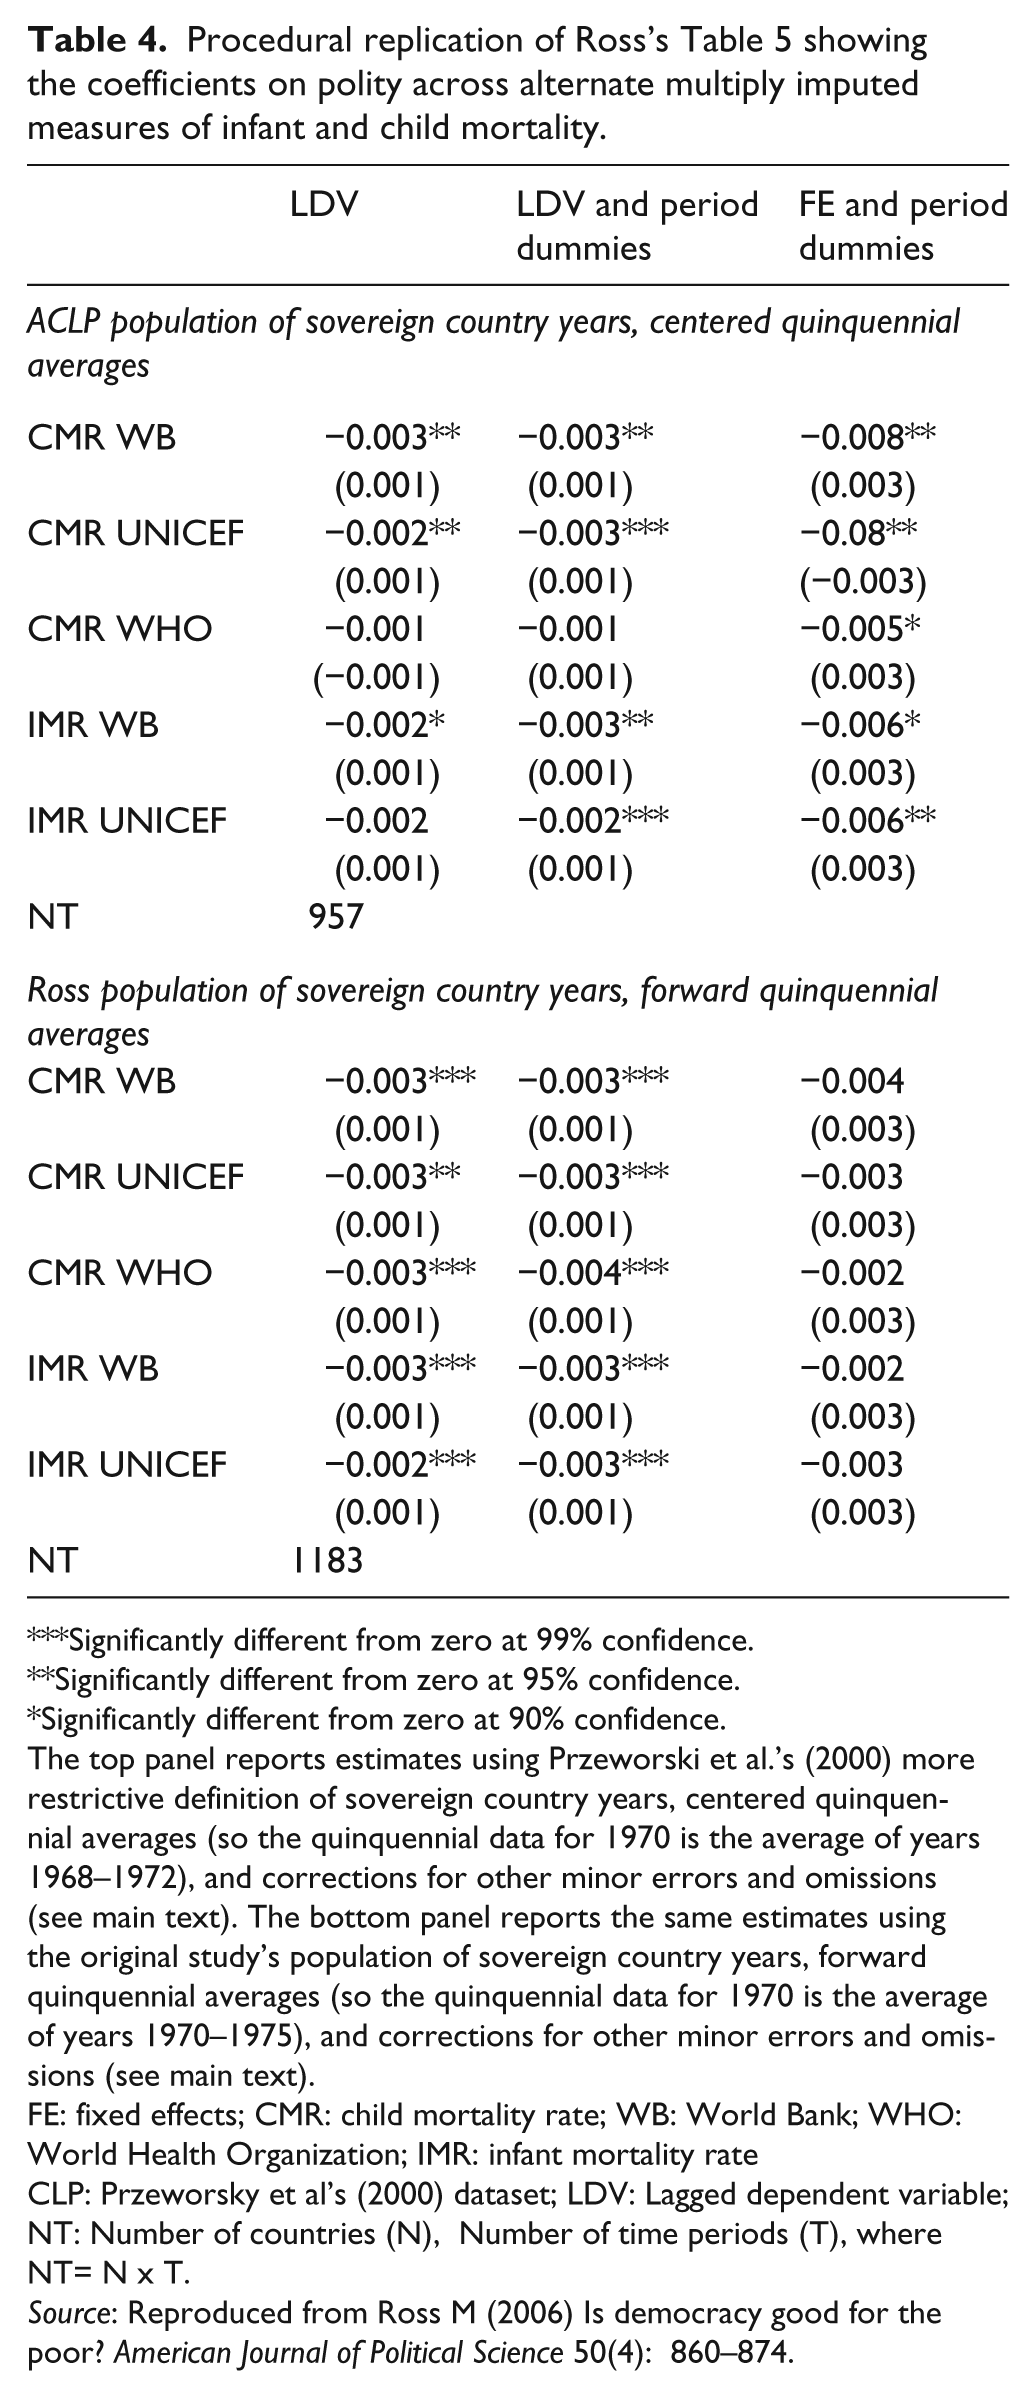
Procedural replication of Ross’s Table 5 showing the coefficients on polity across alternate multiply imputed measures of infant and child mortality.
Significantly different from zero at 99% confidence.
Significantly different from zero at 95% confidence.
Significantly different from zero at 90% confidence.
The top panel reports estimates using Przeworski et al.’s (2000) more restrictive definition of sovereign country years, centered quinquennial averages (so the quinquennial data for 1970 is the average of years 1968–1972), and corrections for other minor errors and omissions (see main text). The bottom panel reports the same estimates using the original study’s population of sovereign country years, forward quinquennial averages (so the quinquennial data for 1970 is the average of years 1970–1975), and corrections for other minor errors and omissions (see main text).
FE: fixed effects; CMR: child mortality rate; WB: World Bank; WHO: World Health Organization; IMR: infant mortality rate
CLP: Przeworsky et al’s (2000) dataset; LDV: Lagged dependent variable; NT: Number of countries (N), Number of time periods (T), where NT= N x T.
Source: Reproduced from Ross M (2006) Is democracy good for the poor? American Journal of Political Science 50(4): 860–874.
Replicating the multiply imputed estimates
I could not replicate exactly the multiply imputed data and estimates because the replication file does not include a random seed for the imputations. Even so, I found missing data were imputed inconsistently. For example, quinquennial averages were computed ignoring missing observations (a form of imputation); lagged values of the dependent variable in the first period were manually imputed using the actual observation in that period; and the key independent variable, polity, was never included in the imputation model. 8 Moreover, the imputation software available at the time ignored time dependency (King et al., 2001).
Diagnosing errors and omissions in the inferred scientific standard
The pure replication in the previous section helped me partially infer the combination of technological inputs and procedures (or scientific standard) used in the original study. Here, I diagnose potential errors and omissions. The objective is to learn from mistakes, assess their impact, and propose preventive measures, not to make a substantive contribution about regime type and human welfare by changing data sources, model specification, estimators, or inferential procedures.
Relaxing the dynamic specification in the observed dataset
The original study’s preferred two-way fixed effect model specification includes only one lag of polity, and no interactions with time. Combined with the forward quinquennial averages, this imposes severe dynamic restrictions. As formulated, the original study asks not whether democracy has an effect − any effect – on infant and child mortality, but whether it has a constant additive effect in the first three years after a transition. Few social scientists would expect democracy to have a substantive impact in such a short period, yet the original study provides no theoretical justifications for this choice. This is all the more puzzling considering that most econometric textbooks highlight the flexibility of panel data in characterizing dynamic effects (e.g. Baltagi, 2001: 6).
For example, in the preferred two-way fixed effects model specification the outcome for 1975 is given by yi,1975 = α
i
+ λpolityi,1970 +
The dynamic restrictions are so severe that even a minor relaxation, like computing centered quinquennial averages (which allow for a slightly longer lagged effect), is enough to reverse the null findings in the original study. To show this separate from the multiple imputation I replicated the listwise deleted estimation results in Table 3 of the original study, replacing the forward quinquennial data in the original estimation with centered quinquennia. I also used Przeworski et al.’s (2000) unbalanced panel of sovereign country years. 9 Using the exact same two-way fixed effect specification in the published table – the study’s preferred specification – I obtained a point estimate of −0.005 (s.e. 0.002). This is statistically and practically significant, and about twice as large as the published estimate (–0.0021 (s.e. 0.002)). For example, a movement of 10 points in the polity variable implies a 5% average decline in child mortality after five years (95% CI: –9.4 to −1.3%).
To check that this was not a result of using a different population, I replaced Przeworski et al.’s (2000) unbalanced panel of sovereign country years with the original study’s artificially balanced panel. The result is an almost identical estimate (–0.0054; s.e. 0.002). Relaxing the dynamic specification further, by adding an extra lag of polity or an interaction with a linear time trend, also yielded practically and statistically significant results. These results underscore the importance of omitted dynamics in generating the original study’s null result.
Relaxing the dynamic specification in the multiply imputed dataset
The original study claims previous significant findings may have been biased by missing data. Specifically, listwise deletion drops rich autocracies with enviable records in reducing mortality from the sample, thus biasing the estimated effect in favor of democracies. Assuming this bias is removed by multiply imputing the missing data and controlling for two-way fixed effects, the original article showed democracy has a negligible effect on mortality. In what follows I show the claim about selection bias has weak theoretical support. The null result in the original study is an artifact of the extremely restrictive dynamic specification, not the result of correcting selection bias in previous studies.
First, the selection bias argument does not withstand theoretical scrutiny. The fact that rich autocracies with enviable declines in infant and child mortality are listwise deleted from the estimation sample tells us nothing about the effect of democracy on mortality. For all we know, their declines could have been faster (or slower) had they been democracies. Therefore the bias, if it exists, could go either way. Besides, if selection is on the basis of income and regime type, as the original study claims, then controlling for these variables, like most previous studies do, should help alleviate the bias. For example, suppose autocratic regimes above a certain income threshold all drop out from the sample. If the effect of democracy increases with income, then the sample estimate will underestimate the population effect. But the estimate will remain unbiased for the countries in the sample, which in this case includes most of the world. Figure 1 illustrates this logic using a causal diagram. 10

Simplified causal diagram illustrating the causes of the outcome of interest, the missingness, and the selection through listwise deletion. The graphical model assumes mortality is caused by last period’s regime type (polityt−1), income (GPDt−1), and other unobserved causes (Ut). For simplicity I assume GDPt−1 is the only variable with missing data. The missingness indicator
Second, the selection bias argument does not withstand empirical scrutiny. For example, using centered quinquennia, and a multiple imputation software better suited for time dependence, I found democracy has a practical and statistically significant effect on infant and child mortality, as reported in Table 3. 11 These results are very different from the corresponding estimates in Table 4 of the original study (Ross, 2006: 869). There none of the coefficients on polity or democratic years is significant. By contrast, the corresponding estimates reported in Table 3 are all practically and statistically significant, with the exception of democratic years in the last column.
To further check the robustness of this results I replicated Table 5 in the original study (Ross, 2006: 870). That table reports the coefficients on polity when different multiply imputed measures of infant and child mortality are used. I repeated the replication twice. Once using Przeworski et al.’s (2000) unbalanced panel of sovereign country years and centered quinquennia (top panel, Table 4), and again using the artificially balanced panel of sovereign country years and forward quinquennia from the original study (bottom panel, Table 4).
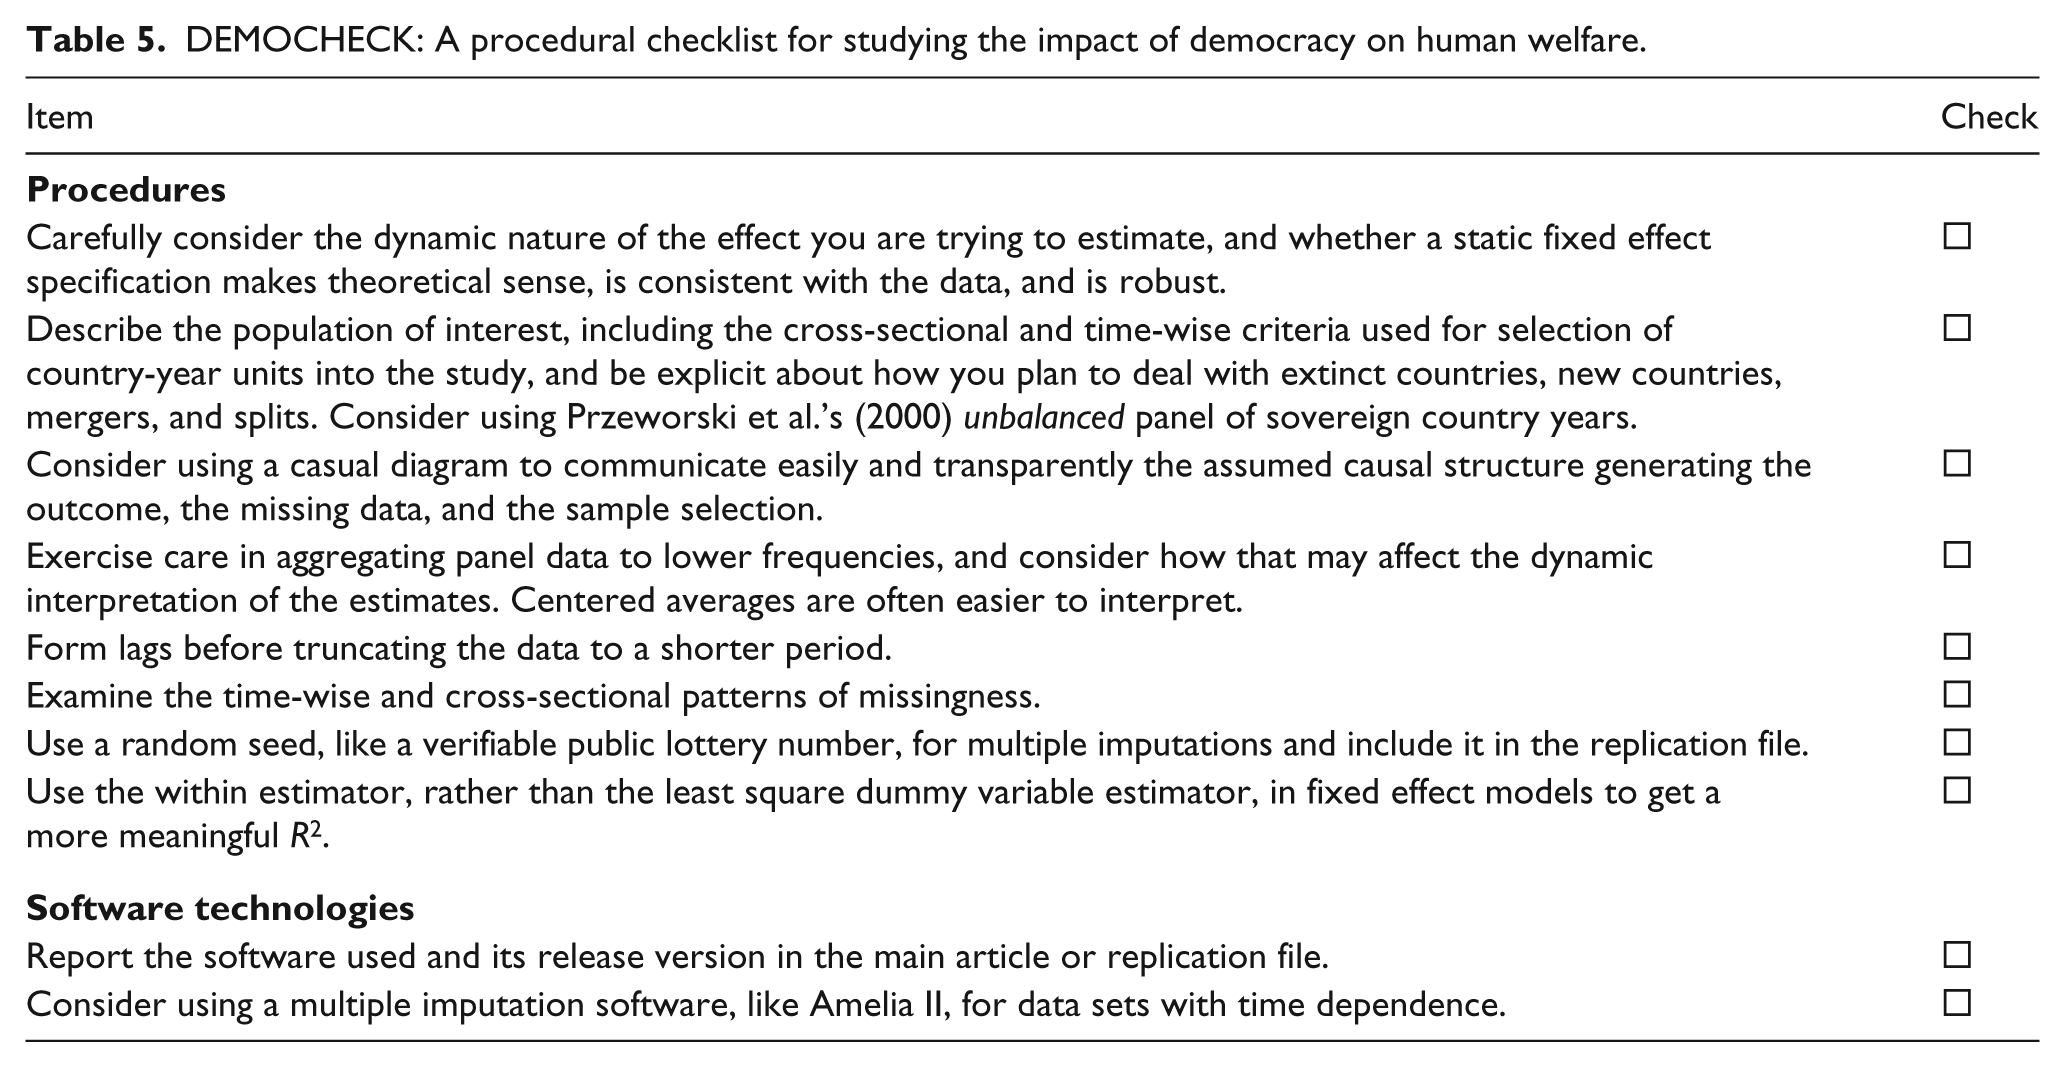
DEMOCHECK: A procedural checklist for studying the impact of democracy on human welfare.
First, using the original study’s preferred two-way fixed effect model I found polity is significant at the 10% level or less whenever I used the centered quinquennia data (top panel, last column of Table 4). However, using the forward quinquennia I found all estimated coefficients are insignificant, and about half the size (bottom panel, last column).
Second, using the lagged dependent variable specifications I found most point estimates are similar and significant, even when forward quinquennia are used (first two columns of Table 4). This is because the lagged dependent variable specification, though still very simple, allows for short- and long-run effects. However, I found standard errors are higher when using Przeworski et al.’s (2000) stricter definition of sovereign country years (top panel) compared to the original study’s criteria (bottom panel). The reason for this difference is that the stricter criteria yield 957 observations, as opposed to the original study’s 1183 observations. The latter treats observations for countries like Ukraine prior to 1989 as missing rather than undefined. Multiply imputing these data may exaggerate the amount of information in the dataset, thus underestimating uncertainty.
I summarize the lessons from the pure replication in the section “Pure replication” and the diagnosis and criticism in “Diagnosing errors…” in a checklist (see Table 5). Such a checklist can be used prospectively to help design more effective studies on the impact of regime type on human welfare. It can also be used retrospectively to assess the quality of existing studies and as a quality control in the peer review process.
Conclusion
Ross’s (2006) controversial and widely cited finding that democracy has no effect on child mortality is of momentous significance. If true it has wide ranging theoretical, policy, and practical implications. I replicated this study using a procedural replication and found reasons to challenge it.
I found Ross’s (2006) original null result is an artifact of an extremely restrictive dynamic specification. The preferred static fixed effect model specification, combined with forward quinquennial averages, assumes democracy only has an additive effect on child or infant mortality within the first three years or so after a transition − and not thereafter. Few social scientists expect democracy to have a substantive impact in such a short period. The restriction is so severe that even a small change in the dynamic specification, like using centered quinquennial averages that allow for a five-year lag, is enough to detect practically and statistically significant effects. The lesson here is that scholars should think carefully about dynamics when estimating the effect of democracy on mortality.
I also found the original study’s concern over listwise deletion and selection bias may have been overstated. Ross (2006) claims previous significant findings are biased by missing data. Specifically, listwise deletion drops rich autocracies with excellent records in reducing mortality from the sample, thereby biasing the estimated effect in favor of democracies. However, the theoretical arguments and empirical evidence presented here demonstrate that selection bias may not have been such a problem after all. What is driving the null result is the extremely restrictive dynamic specification, not the presumed correction for selection bias in previous studies. I also found a more sound definition of the population of interest yields better measures of uncertainty. Finally, I showed how causal diagrams can be used to analyze selection bias and listwise deletion succinctly.
Here I have demonstrated the use of procedural replication. The objective of procedural replication is to diagnose sources of errors and omissions, identify research artifacts, and propose preventive measures including checklists to inform future research, streamline editorial reviews, and improve cumulative research about the impact of regime type on human welfare. In pursuing this objective I deliberately avoided questioning the basic research design, choice of measures, model specifications, estimators, inferential techniques and other assumptions. 12 Advocating alternative choices and assumptions, and testing them, is the remit of standard scientific studies, not procedural replications. Indeed, it is a mistake to think all replication studies must make a substantive contribution. The point of any consequential scientific endeavor is not just to present novel findings, but to actually answer existing questions reliably. Procedural replication focuses squarely on improving our answers to existing questions and so the method ought to be as relevant as the questions are consequential.
Footnotes
Acknowledgements
I would like to thank Michael Ross for his kindness and generosity in sharing his data, answering my questions, and providing excellent constructive comments on earlier drafts of this manuscript; Patrick Royston for kind help with the Stata package mim; Neal Beck; anonymous reviewers; and the editors of Research & Politics. All errors are my own.
Declaration of conflicting interest
The author declares that there is no conflict of interest.
Funding
This research received no specific grant from any funding agency in the public, commercial, or not-for-profit sectors. The views expressed are my own and not necessarily those of Cambridge Social Science Decision Lab Inc.