
Abstract
Little is known about the thousands of people who take part in communal violence. Existing research is largely based on interviews, impressionistic accounts and government records of arrestees. In contrast, this paper examines data from a novel survey of a representative sample of residents of Alexandra, a township in South Africa where a 2008 nation-wide wave of anti-immigrant riots began. Data on participation in the attacks were collected using a method ensuring the privacy of responses, thus potentially reducing response bias. In contrast to the conclusions of existing research, which emphasize the participation of young males, the survey data reveal that a significant number of participants were female and participants were not particularly young, being 34 years old on average. Participants are more likely to support an opposition party, attend community policing meetings and have a high-school education.
Introduction
Violence against other social, national, ethnic, racial and religious groups continues to affect many parts of the world. Such communal riots may produce significant human rights violations and loss of life, and may even be a harbinger of more severe political or intergroup conflict (Horowitz, 2001).
A number of scholars, including Brass (1997), Dancygier (2010), Olzak (1992) and Wilkinson (2004), have consequently provided careful analyses of the determinants of communal violence. They do so from the “top down”, however, treating riots as events and offering ecological-level explanations. A newer group of researchers have complemented this research with microlevel examinations of individuals’ motivations for participation in attacks on other groups (Claassen, 2014; Scacco, 2010).
Despite this accumulation of research on why riots occur and why people participate, we still have little idea who the rioters are, and how many they number. There are both theoretical and policy reasons why we should want to know the answers to these questions. Data on numbers might offer a challenge to policymakers who dismiss rioters as a tiny criminal minority (see Misago et al., 2010; Sears and McConahay, 1969), while knowledge of who riots—the socio-demographic factors that correlate with participation—would seem to be a prerequisite to understanding why riots occur.
This paper uses recent survey data from South Africa to tackle both these questions: the numbers who take part in communal violence and the socio-demographic factors that predict who does. I use a survey of a sample of residents of a South African township 1 that was struck by communal violence between locals and African immigrants in 2008 (see Misago et al., 2010). Three features of the survey render it useful for the task of describing riot participants. Firstly, the survey was conducted in Alexandra, the township where the 2008 violence began and where it reached its greatest intensity. Secondly, interviews were conducted with a representative sample of adult South African residents of the area, permitting externally valid inferences about who actually participated in 2008. Thirdly, the participation questions were asked using a method designed to ensure the privacy of respondents, and thus the validity of responses.
My results are as follows. With respect to numbers, I find that 8.5% of adult South African residents of the area participated in some way in 2008. In contrast to existing descriptions of participants, my survey data show that a significant number of women took part in the 2008 riots in Alexandra (30% of participants). Moreover, and again in contrast to existing accounts, participants were not particularly young (median age: 34). Those who participated in 2008 were more likely to support an opposition party and to have a high-school (versus higher) education, particularly among the male subsample. Participants, particularly among the female subsample, also attended more community policing meetings, which were the sites where violence was initially organized (Misago et al., 2010).
Communal riots
Researchers have noted high levels of xenophobia in South Africa, both in the form of pronounced anti-immigrant attitudes (Mattes et al., 1999) as well as widespread lynchings of immigrants (Harris, 2004). Such xenophobia is particularly severe in the townships that ring South African cities, where many black South Africans live, and where many immigrants from Mozambique, Zimbabwe and further afield have made their homes. In May of 2008 a wave of anti-immigrant violence swept these townships, lasting for three weeks and leaving 62 dead, 670 wounded and 100,000 displaced (see Misago et al., 2010; Steinberg, 2008).
These attacks can be viewed as examples of communal riots, as they are: (1) a form of collective violence lasting hours, days or weeks; (2) incidents where violence is perpetrated by ordinary people, that is, not regular or irregular members of the armed forces; and (3) events in which the targets are some other social, national, ethnic, racial or religious group. As this definition suggests, communal riots are more or less synonymous with “deadly ethnic riots”, as described in Horowitz’s (2001) encyclopaedic book of the same name.
A number of major studies—Horowitz’s included—have investigated the causes of communal riots. Scholars have typically treated riots as events, explaining their occurrence as an extension of competition, either between groups (Dancygier, 2010; Olzak, 1992) or group leaders (Brass, 1997; Wilkinson, 2004). The most rigorous study of the 2008 anti-immigrants riots (Misago et al., 2010) echoes this latter thread in the literature, finding that the attacks were instigated at township community policing meetings, often with the involvement of the leaders of these informal institutions.
Participation in communal violence: who and how many?
Although the bulk of the existing scholarly effort has been expended on explaining why communal riots occur, some scholars have also turned their attention to the participants who make up the mobs. Horowitz’s (2001) exhaustive review of secondary sources concludes that participants are working class and “overwhelmingly male” (258) with ages ranging “from the teens to the thirties, with the median toward the low end” (259). Tishkov’s (1995) analysis of a sample of individuals arrested after the 1990 Osh riots in Kyrgyzstan finds that all but one of the accused were male, a majority were from 25 to 30 years of age with few older than 40 and most had completed high school. Historical research on the European food riots of the 18th and 19th centuries, in contrast, notes the participation of women, older men and children (Gailus, 1994; Thompson, 1971).
These conclusions regarding participants in communal riots—contradictory as they are—are limited by the unreliable sources of data on which they rest: convenience samples and impressionistic accounts. Far preferable as a research method is a public opinion survey of a representative sample of residents of an affected area, which is the technique I deploy. Surprisingly, there are only two other such surveys, as far as I am aware. The first is by Scacco (2010), and is a probability survey of the riot-prone Nigerian cities of Jos and Kaduna, conducted in 2008. Although Scacco does not sample women, based on the assumption that women did not participate, she finds that 19% of adult males took part in the 2001 riots. She finds, moreover, that participants tended to be poorer and active in community policing organizations. The second is the Los Angeles Riot Study of the neighbourhoods affected by the 1965 Watts riots (Sears and McConahay, 1969). 2 The researchers find that that 22% of the residents of the affected areas took part, 68% of respondents who admitted taking part were under 30, and 62% were male. Indicators of socio-economic status, however, show little or no relationship with participation.
Thus, in sum, the sparse evidence we have regarding numbers of participants suggests that they are a minority, but their absolute number is large. We know even less with respect to the socio-demographic predictors of participation: some sources suggest that rioting is carried out by young men; others note the participation of women and older people. The data on participation and socio-economic status is similarly contradictory.
Data and methods
Data on participation in communal riots is best gathered using a public opinion survey of a probability sample of residents of an area recently affected by such a riot. In April and May 2011, I conducted such a survey of a representative sample of 497 adult South African residents of Alexandra, where the 2008 violence began and where it reached its greatest intensity (Misago et al., 2010).
Sampling
There is no reliable list of addresses in townships like Alexandra, nor are landlines telephones or internet connections common. To arrive at a representative sample. I stratified by the major housing types of government flats, hostels and houses and shacks. Then, using satellite photographs, I divided each stratum into equal-sized clusters and randomly selected clusters from within each stratum. Within each cluster, each interviewer was assigned a direction in which to walk and used a randomly chosen sampling interval to select dwellings (houses, shacks, flats or hostel rooms) for further investigation. The same sampling interval was used to select households from within each dwelling. Finally, a specially constructed random number table was used to select a respondent from the adult South African members of the household. Face-to-face interviews were conducted in or near the respondents’ homes in Alexandra. One call-back was required for non-contact and no substitutions were permitted. The response rate (AAPOR #3) is 69.2%. 3
Some 8% of the sample (N = 45) were not present in Alexandra at the time of the 2008 attacks. These respondents were excluded from the analysis that follows, leaving a final sample size of 452. 4
Measuring participation
The outcome of interest is individual participation in the attacks of 2008. Respondents may be reluctant to disclose such potentially incriminating information, but researchers such as Misago et al. (2010) and Steinberg (2008)—who have asked similar questions of Alexandra residents—have reported success, suggesting that social desirability biases may in fact be quite minimal.
Nevertheless, in an effort to reduce response bias as much as possible, I used a variation of the Gallup secret ballot technique—first adapted for riot participation by Scacco (2010)—when asking respondents about their participation in the 2008 riots. Five questions were asked: whether the respondent had (1) joined in one of the protests that preceded some of the attacks, (2) threatened or intimidated anyone, (3) looted, (4) harmed anyone, or (5) destroyed any shacks during the attacks of 2008. Respondents received a small card with five rows of the letters “A”, “B” and “C”, and were asked to circle the letter that corresponded to the correct answer for each question. 5 When all five questions had been completed, respondents were then asked to seal the card in an envelope that had been provided, ensuring that their responses remained hidden from the interviewer.
The survey was conducted three years after the riots. Although such an interval would render many, if not most kinds of memories vague and unreliable, Alexandra residents were very unlikely to have forgotten their participation (or non-participation) by the time of the survey. The attacks of 2008 are branded in the public imagination in Alexandra. 6 Moreover, immediately before gathering the measures of participation, I asked respondents if they remembered the attacks. Although there may be some social desirability bias in answering in the affirmative, it is revealing that not one respondent claimed to have no knowledge of the attacks. 7
Producing estimates from complex survey samples
Describing participants in communal riots requires making inferences from a sample to a population. Given that my sample is complex—featuring both stratification and clustering—this inference is somewhat complicated. I use various functions available in the survey library in R (Lumley, 2010), which (1) adjust estimates by the inverse of the probability of selection into the sample, (2) post-stratify the estimates, 8 (3) calculate variances taking stratification, clustering and post-stratification into account, (4) estimate confidence intervals using a beta-binomial distribution, which Korn and Graubard (1998) recommend for small proportions and (5) combine estimates from the five multiply-imputed datasets.
Results and discussion
I begin with the results regarding numbers of participants. Figure 1 displays my estimates of the proportion of the population of Alexandra who took part in various ways in the 2008 attacks. In particular, I find that 8.5% of adult South African residents of Alexandra report some form of participation in the riots of 2008, with 11.6% of men taking part and 5.3% of women. Moreover, 3.6% of Alexandra residents took part in one of the more aggressive behaviours: destroying immigrants’ shacks or engaging in physical assault.

Proportion participating in each riot behaviour.
Next, I turn to bivariate comparisons of participants with non-participants across 11 demographic, social and political factors. Note that while participation is measured as a recollection of behaviours conducted in 2008, the other covariates were measured at their 2011 levels. Although this makes little difference for exogenous factors such as gender, home language and age, factors such as party support and meeting attendance are potentially endogenous to earlier riot participation. Causal interpretations of the effects of these latter variables may not be warranted.
Figure 2 displays the bivariate cross-tabulations. Each plot corresponds with the cross-tabulation of participation and one of the 11 socio-demographic variables. This exploratory analysis reveals that levels of participation in the 2008 anti-immigrant riot in Alexandra vary considerably by socio-demographic subgroup. Among some subgroups (such as those who live in hostels, support an opposition party or attended two or three community meetings in the last year), more than 15% participated. In other subgroups (such as being Tswana-speaking, living in a government flat or being older than 50), few individuals took part.
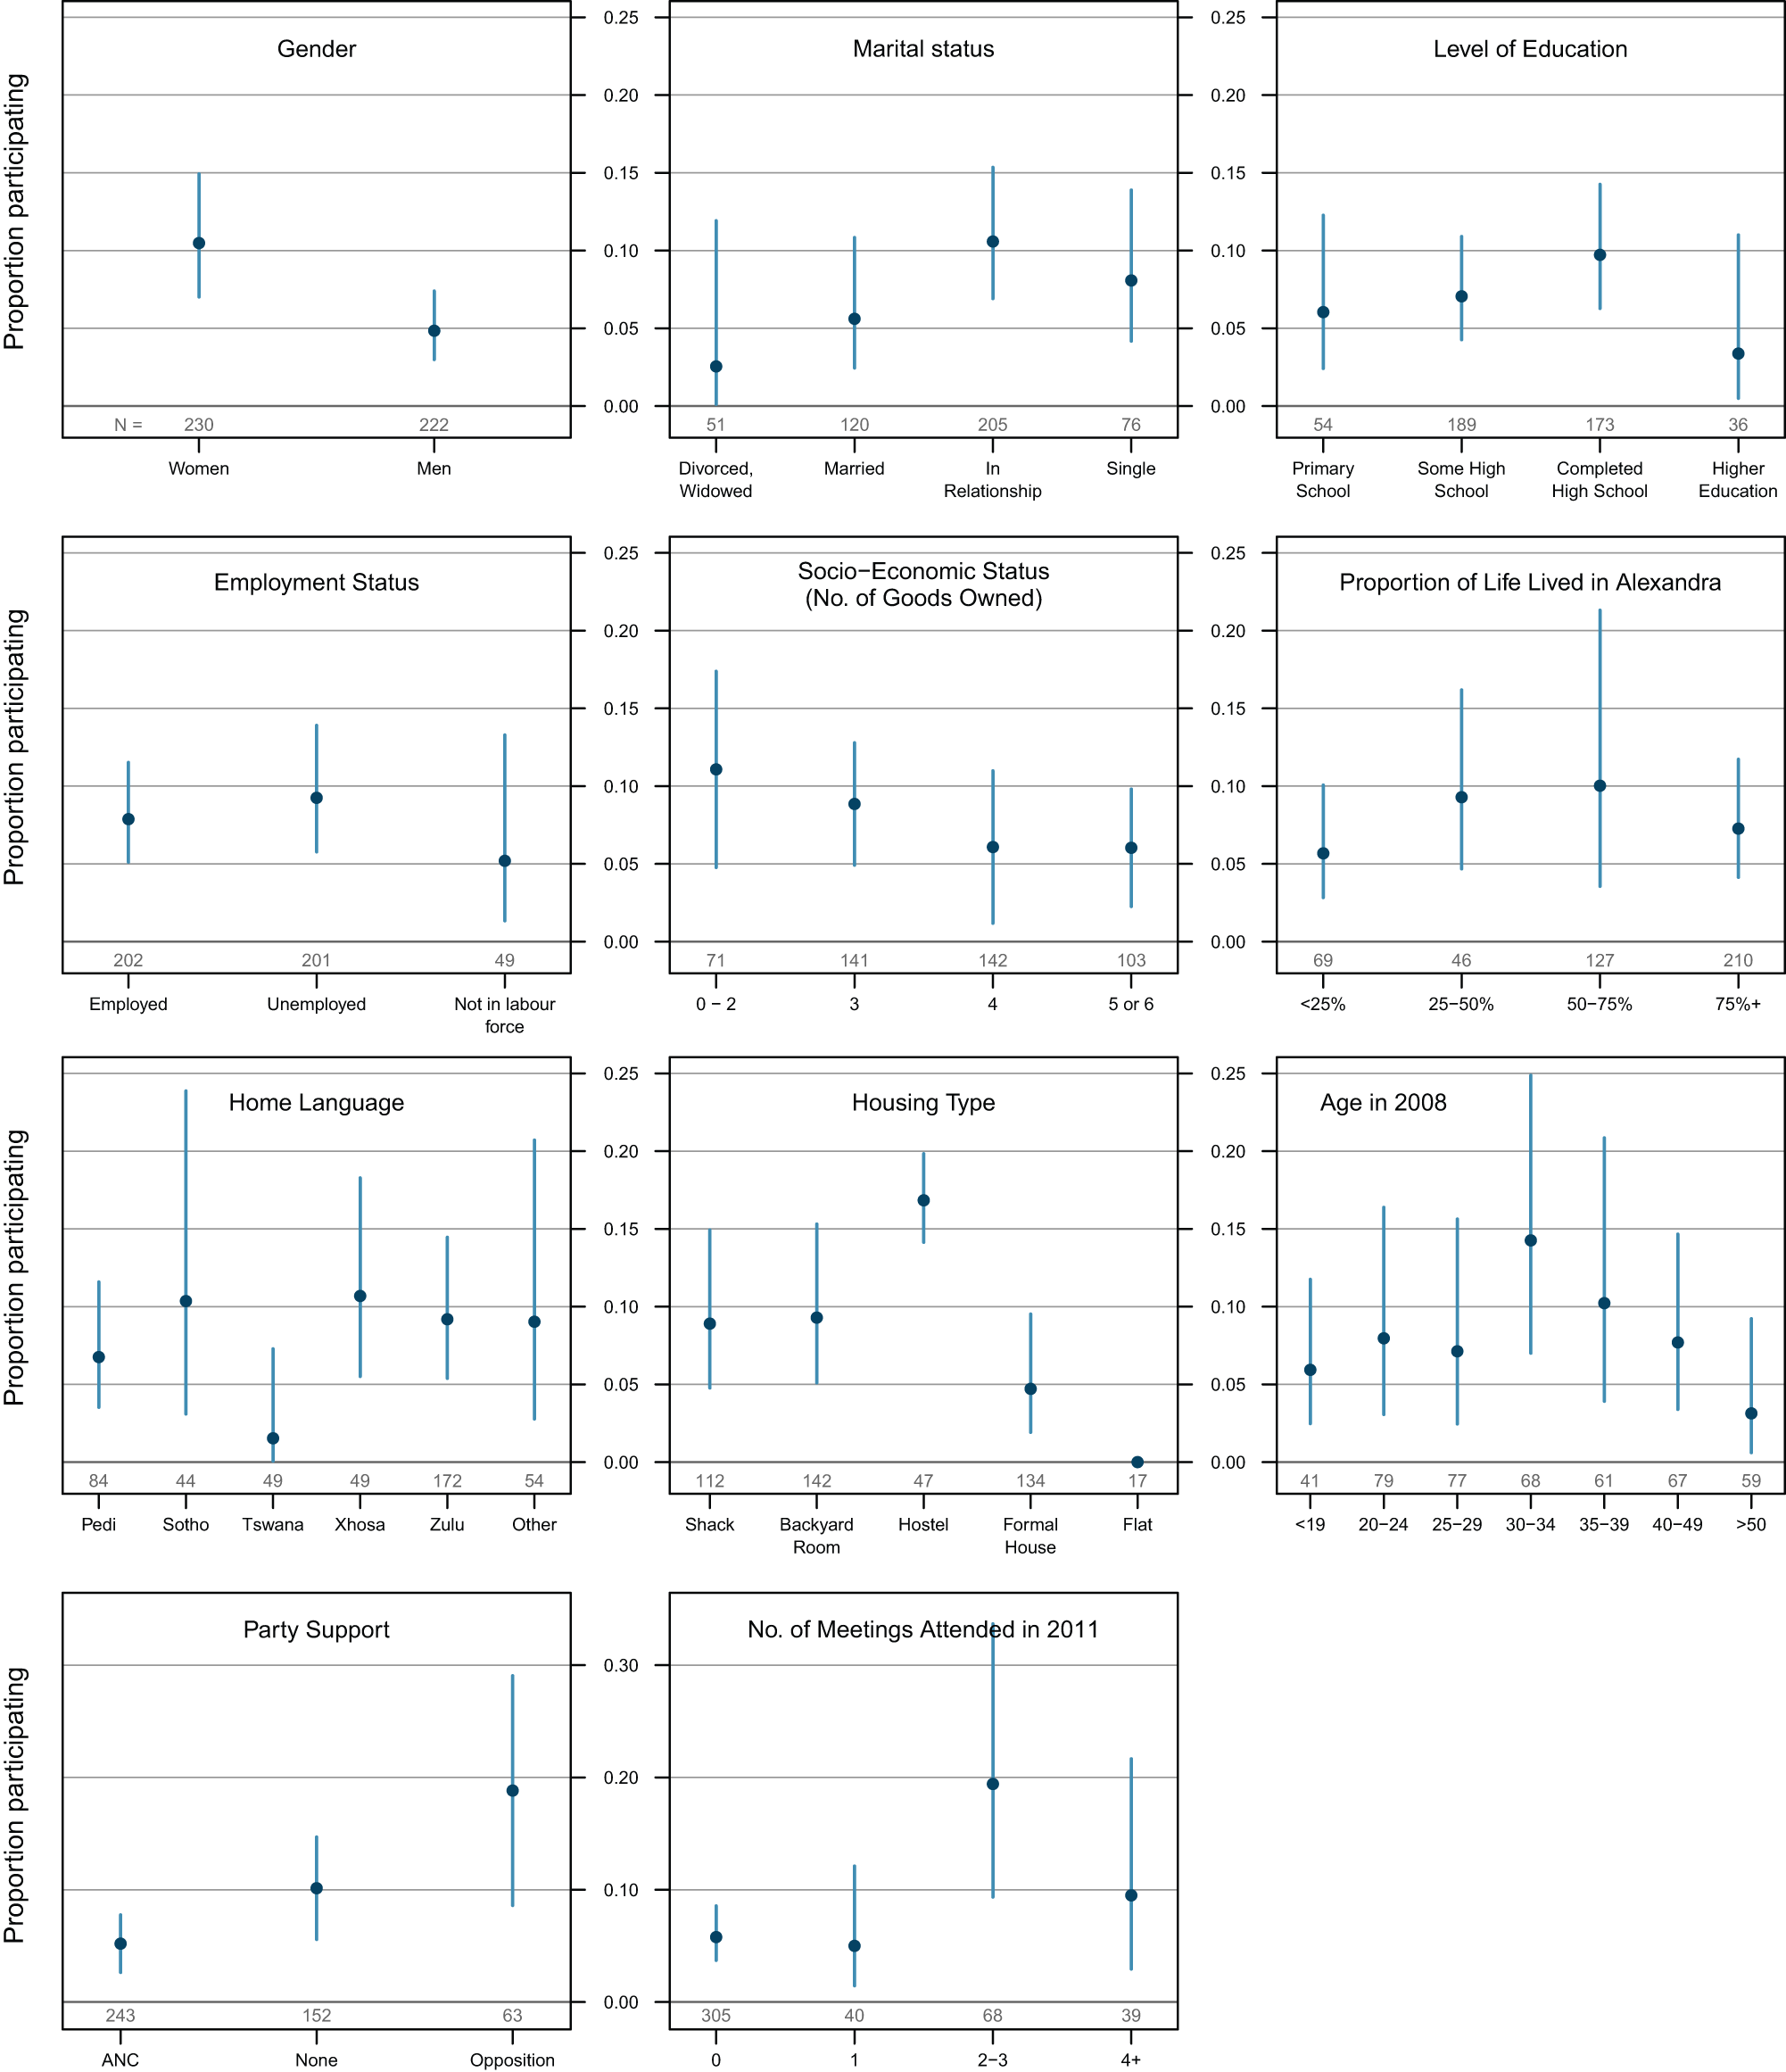
Participation in communal violence, by socio-demographic variables.
I then include all the covariates in three logit models of participation, the first using the whole sample, and the second and third utilizing just the male and female subsamples. 9 The results are presented in Table 1.
Logistic regression analysis of participation in 2008.

p < .01, **P < .05, *P < .10.
Omitted category is African National Congress (ANC) support.
Omitted category is employed.
Omitted category is formal house or flat.
Omitted category is higher education.
Estimates are post-stratified by home language, employment status and age. Design-based standard errors in parentheses.
Party support and age emerge as significant correlates of participation, with gender, meeting attendance and having a high-school—compared to higher—education significant at the 90% level. The use of logit coefficients, dummy variable contrasts and quadratic terms (for age) suggest that a graphical display of predicted probabilities would be useful for interpreting the results of these regressions (see Gelman and Pardoe, 2007). Thus, in Figure 3, I plot the predicted effects of all variables that show a significant effect (at the 90% confidence level) in Table 1. These five plots show the predicted probabilities of having taken part (y-axis) when varying each of the five significant covariates (x-axis), while holding all other variables at their means.
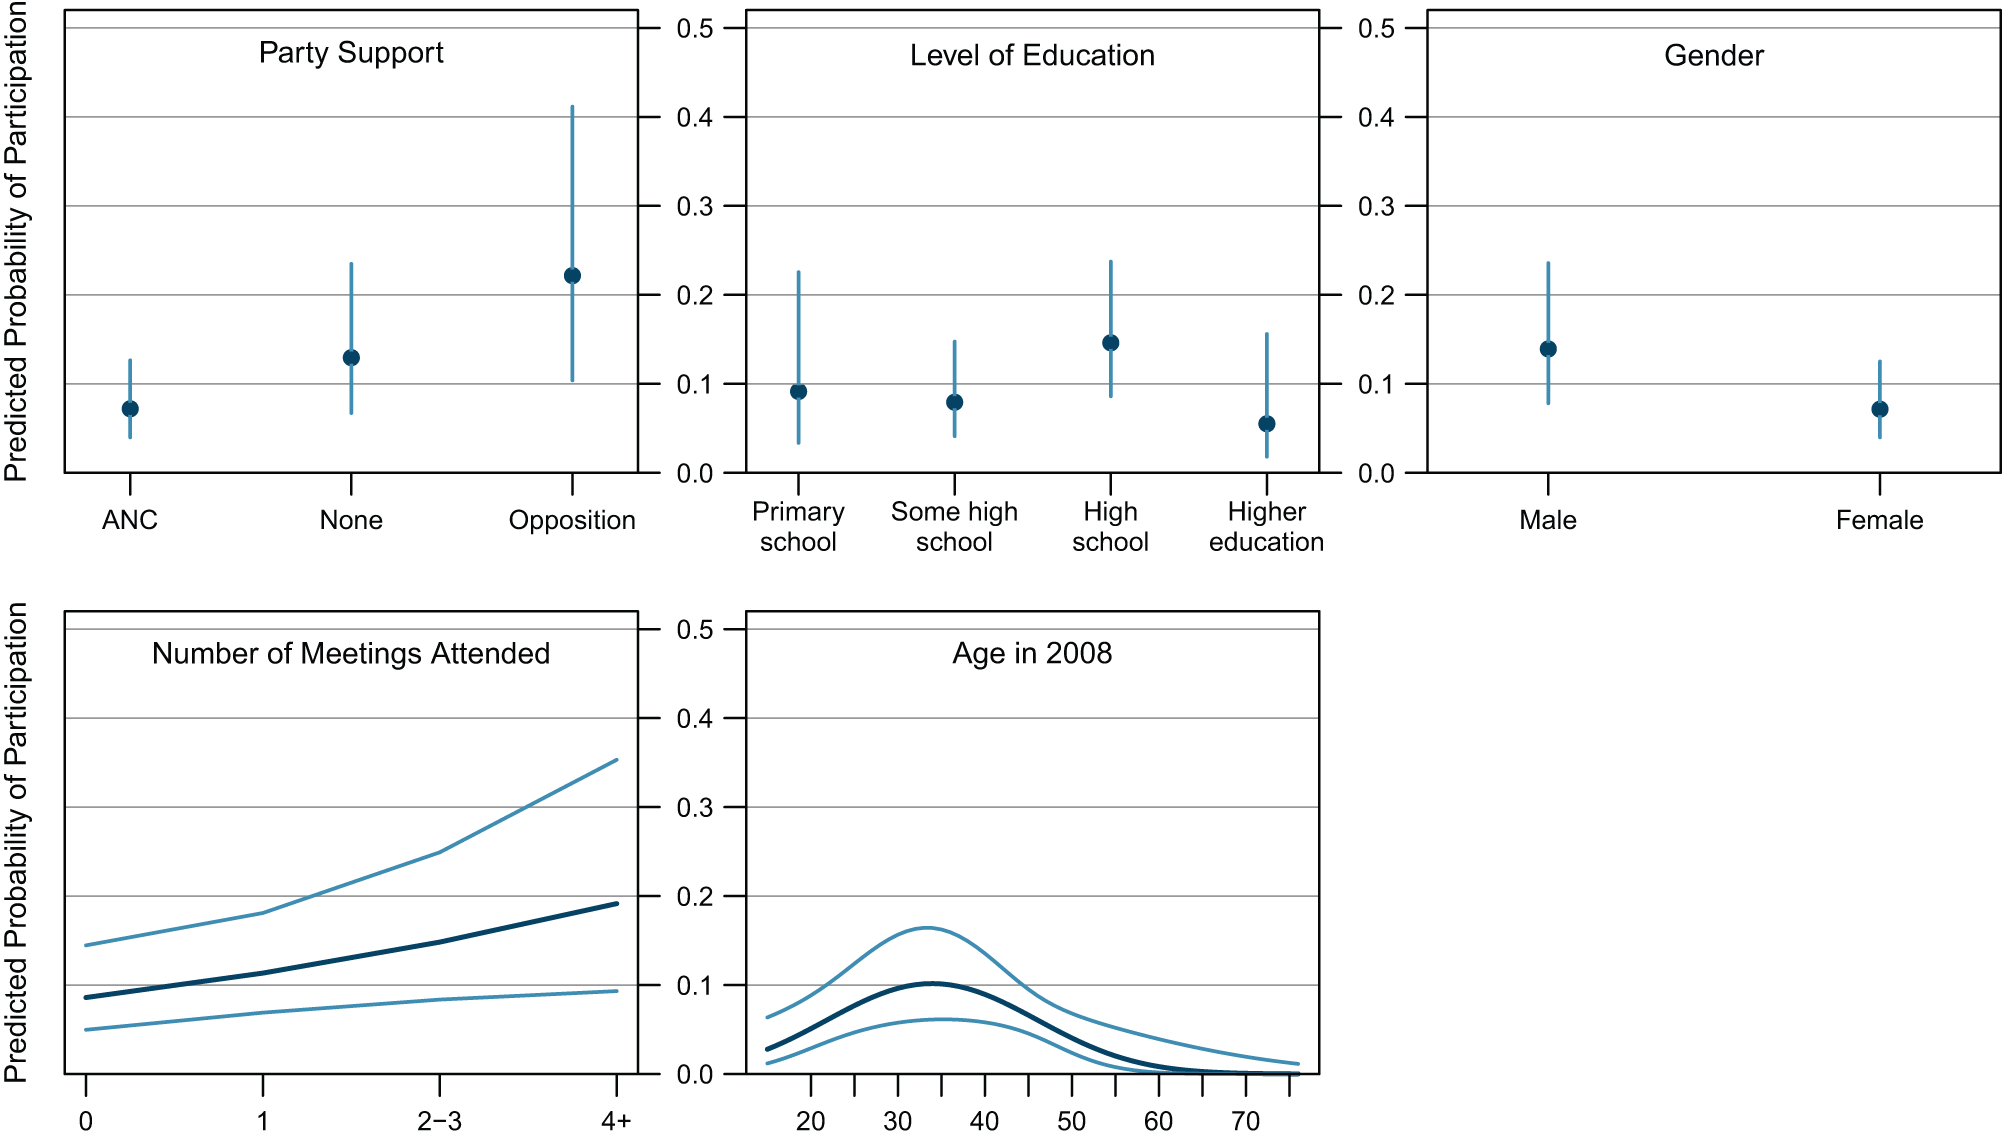
Predicted effects of significant covariates of participation.
Returning to the regression results, one of the strongest findings that emerges from this analysis is the relationship between opposition party support and having participated in the 2008 riots. This association is even stronger in the male subsample. The first plot in Figure 3 shows the effect clearly: Alexandra residents who support the ANC, with all other variables held constant, are estimated to have about a 7% probability of having taken part. This predicted probability rises threefold to over 22% for residents who support an opposition party.
A second finding of note is the effect of age. The quadratic term is negative and significant—both in the whole sample and the male subsample—indicating a concave slope. Figure 3 then provides a much clearer picture of how age is related to the probability of participation. This plot, the fifth in Figure 3, shows this concave quadratic effect of age on probability of participation. The respondents most likely to have participated are those who were around 34 years old in 2008. This is quite different to the angry young men who are typically regarded as the protagonists of both protest and communal riots (Horowitz, 2001). Indeed, the model estimates that respondents who were 20 years old in 2008 had only half the likelihood of taking part in the attacks of respondents who were 34—5% versus 10%.
Thirdly, I find that the probability of participation in the 2008 riots is associated with attendance at community policing meetings. This correlation between participation and meeting attendance is strongest in the female subsample. Although the meeting attendance survey item asked respondents to report their attendance in 2011, existing research suggests that participants in the 2008 riots were probably drawn from attendees at policing meetings. As Misago et al. (2010) describe, these meetings were the organizing venues for the attacks on foreigners. 10
The results are also interesting for socio-demographics that are not significant covariates. In contrast to Scacco (2010), I find that participation is not a function of poverty, with socio-economic status showing only a weak and insignificant relationship. In addition, in contrast to previous qualitative research on the anti-immigrant violence of 2008 (Misago et al., 2010; Nieftagodien, 2012), I find that neither being a long-term resident of the area nor being Zulu-speaking is an important correlate of having participated.
Conclusion
This paper presents estimates for two unanswered questions regarding communal riots: firstly, the question of how many people participate in such violence; secondly, the question of who takes part. The evidence is obtained from a survey of a probability sample of residents from an urban slum in South Africa where anti-immigrant violence occurred in 2008. The advantages of this dataset for the questions at hand are its representative sample and the measurement of participation using the privacy-enhancing Gallup secret ballot technique.
There are six main findings. Firstly, like Scacco (2010), I find that around 9% of local residents of the affected area took part in the violence of 2008. Secondly and thirdly, in contrast to the conclusions of existing research (Horowitz, 2001; Scacco, 2010; Tishkov, 1995) regarding the age and gender of participants, I find that although male participants predominate, a significant number of women also join in attacks on another group. Neither were the participants especially young, having a median age of 34. Finally, participants are more likely to attend community policing meetings, be opposition party supporters and have a high-school (rather than tertiary) education.
Despite its novelty, this dataset has a number of limitations. Firstly, there is a three-year gap between the riots in question and the survey fieldwork. Emigrants are also not sampled. Most importantly, the covariates of participation are measured contemporaneously to the survey, while participation is measured retrospectively, limiting the causal interpretations of many of the findings presented here. Our understanding of participants, and thus our understanding of communal riots, would benefit from a future study that is designed to overcome such limitations.
Footnotes
Acknowledgements
Many thanks to James L Gibson for advice and support throughout this project. Harry Nakeng, Khathu Mathava, Ntombi Simelane, Keoagile Balatseng, Thabo Rakgwadi and Albert Moleme assisted me in carrying out the fieldwork.
Declaration of conflicting interest
The author declares that there is no conflict of interest.
Funding
The survey was funded in part by a grant from the Center for New Institutional Social Sciences at Washington University in St. Louis. Ethical approval for the fieldwork was obtained from the human subjects review boards at Washington University in St. Louis and the University of the Witwatersrand in Johannesburg. Replication data and files are located at the author’s website (![]() ).
).