
Abstract
The formalisation of the Anthropocene as a subdivision of the Geological Time Scale has been under debate. Its stratigraphic boundary has been proposed as a precise Global boundary Stratotype Section and Point (GSSP) in the mid-20th century, but it is part of an episode of human-induced changes to the Earth System that have unfolded over millennia. Here we attempt to identify stratigraphical patterns of the Anthropocene from a previously well studied lake sedimentary archive from the English Midlands, located in one of the most heavily human-modified landscapes in the UK, and the birthplace of the Industrial Revolution. Our analysis is predicated on the sedimentary succession of Groby Pool, a small lake situated to the immediate northwest of Leicester. We have found that whilst proxy signals for biotic change are indicative of significant landscape and consequent ecological changes prior to the 20th century, the signal from radiogenic fallout and rapid increase in spheroidal carbonaceous particles indicative of fossil-fuel combustion yield a clear mid and later 20th century stratigraphical signature that corresponds with the Great Acceleration of the post-WWII period. We therefore demonstrate clear stratigraphical signatures in the oldest Industrial Revolution landscape on Earth that are consistent with a mid-20th century start point for the Anthropocene.
Introduction
The idea that humans have fundamentally modified the Earth System has roots in the scientific ideas of the 18th and 19th centuries (Luciano and Zanoni, 2023). More than a century later, Crutzen and Stoermer (2000) and Crutzen (2002) proposed the name ‘Anthropocene’, to denote a new ‘era’ of geological time in which humans have become an overwhelming force of planetary change. Crutzen (2002) suggested a beginning of the Anthropocene in the late 18th century, coinciding with the rise of global carbon dioxide emissions and with the development of James Watt’s steam engine in 1784 CE. Subsequently, the Anthropocene Working Group (AWG) of the Subcommission on Quaternary Stratigraphy proposed a start date for the Anthropocene in 1952 CE, linked to the unprecedented acceleration and scale of anthropogenic impacts on the planet in the post WWII period, for example global climate change (Steffen et al., 2015; Waters et al., 2023, 2024a, 2024b; Zalasiewicz et al., 2019), although that proposal was subsequently rejected by the International Union of Geological Sciences (see Turner et al., 2024).
The formal stratigraphical definition for the Holocene-Anthropocene boundary was proposed based on the analysis of 12 sites distributed globally (Waters et al., 2023). From those sites, Crawford Lake, Ontario, Canada was selected to host the Global boundary Stratotype Section and Point (GSSP) (McCarthy et al., 2023). The annually laminated Crawford Lake uses the mid-20th century start point for the Anthropocene and the plutonium (239+240Pu) signal from the radiogenic fallout of nuclear weapons testing as the key marker (McCarthy et al., 2023). The increase from 1952 CE in the plutonium record produces a distinct marker which can be correlated across sites throughout the world, including other candidate GSSPs (Waters et al., 2024a, 2024b; Waters and Turner, 2022). Another global human-made signal linked to nuclear bomb fallout is caesium (137Cs) which, despite its short half-life (of ~30 years), also shows an increase in the 1950s with a sharp peak at 1963–1964 CE (Fiałkiewicz-Kozieł et al., 2023; Foucher et al., 2021; Han et al., 2023; Kuwae et al., 2023; Stegner et al., 2023; Zalasiewicz et al., 2015). Other mid-20th century Anthropocene markers include the rapid increase in spheroidal carbonaceous fly-ash particles (SCPs) produced by high-temperature combustion of fossil fuels, whose abundance in sedimentary deposits can also be used to provide chronologies (Rose, 2015; Rose and Appleby, 2005; Swindles et al., 2015). The Anthropocene is also recorded in stable nitrogen isotope records resulting from the transformation of the global nitrogen cycle, caused by the atmospheric deposition of fossil fuel combustion products and the extensive use of nitrogen-based fertilisers in the 20th century (Dean et al., 2014; Gruber and Galloway, 2008; Holtgrieve et al., 2011; Mason et al., 2022; Steffen et al., 2015), and by the fossil record of rapidly transferred non-native species in the mid and late-20th century (Williams et al., 2022).
Other authors have suggested a different approach to the Anthropocene, recognising it as an extended interval of variable anthropogenic change that does not require a formal chronostratigraphic definition and referencing as an informal geological event (Gibbard et al., 2022). Both longer ‘episodes’ of change and short duration ‘events’ embedded within those ‘episodes’ are useful in thinking about anthropogenic influence and the definition of the Anthropocene respectively, as well as the spatial scale of impact such as global, regional and local signals (Head et al., 2022; Waters et al., 2022). In this context we seek to examine the stratigraphical signature of the Anthropocene in one of the oldest Industrial Revolution landscapes on Earth, the English Midlands of the UK. We note that such targeted studies are quite rare, especially those based on existing datasets, and we have deliberately chosen an area where the long history of human impacts leaves complex stratigraphical patterns over hundreds of years.
The county of Leicestershire and the city of Leicester are part of the industrial landscape of the English Midlands. The UK’s Industrial Revolution involved rapid technological advancements in the use of coal powered industrial processes, and expansion and intensification of agriculture and urbanisation, which had a very significant impact on the surrounding environment (Chester et al., 2019; Kennedy, 2020). Leicestershire’s industrial development in the 18th and 19th centuries was mainly focussed on textiles, such as woollen hosiery (Stobart, 2001), and is associated with rapid population growth in the city of Leicester itself (McKinley, 1958). Coalfields were active over eight centuries in the northwest of Leicestershire from the 13th century to 1991 CE, with deep coal mining present from the 1820s (Smith and Colls, 1996). Leicestershire is also proximal to the other major industrial centres in the Midlands, notably the large industrial region of the West Midlands, with the city of Birmingham at its centre (Figure 1). Coalbrookdale, which is widely regarded as the global birthplace of the Industrial Revolution (Evans, 2017), lies about 20 km to the west of the northwest tip of the West Midlands and is where industrial blast-furnace smelting of iron began in 1709 CE (Figure 1). Other English industrial hotspots are found in northern England, with a ring of cities (such as Liverpool, Manchester, Bradford, Leeds, and Sheffield) which collectively form a metropolitan area with a similar population (over 7 million) to Greater London (O’Neill, 2014).
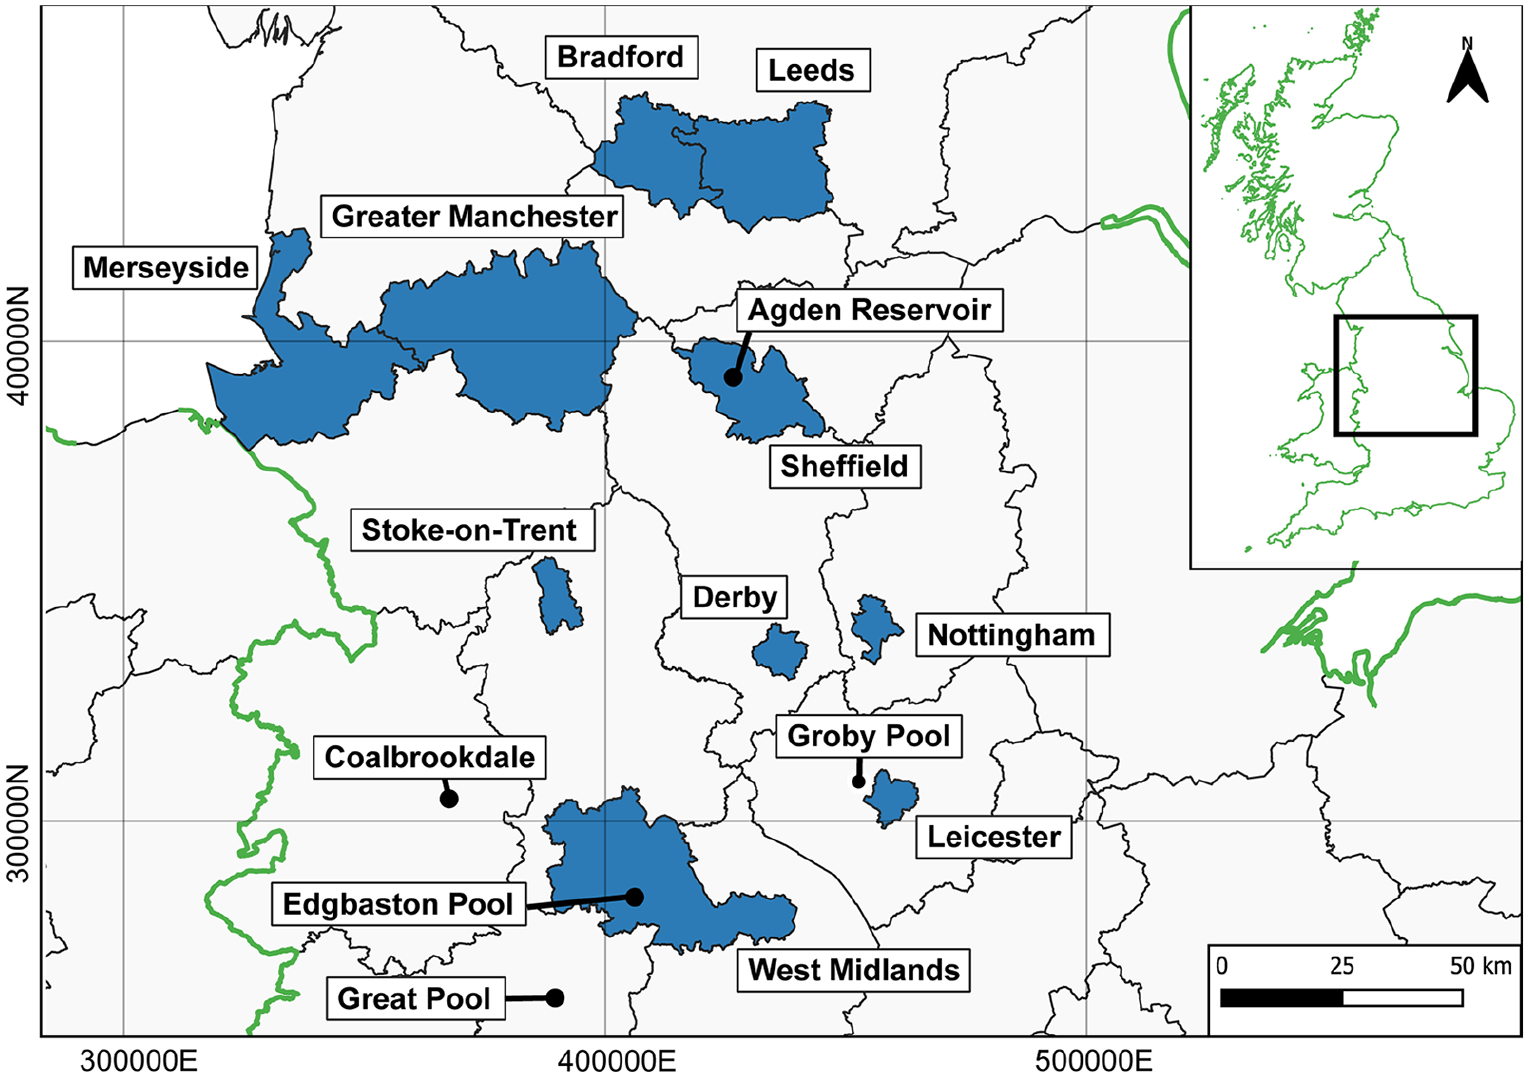
Major industrial regions (blue polygons) in the English Midlands and north of England. Also shown is the UNESCO world heritage site of Coalbrookdale where the first industrial-scale iron smelting using a coke furnace began in 1709 CE, and the Groby Pool study site. Note that Merseyside incorporates the city of Liverpool, and West Midlands the cities of Birmingham, Wolverhampton and Coventry. Green line denotes the boundaries of England, Wales and Scotland. Edgbaston Pool, Agden Reservoir and Great Pool are comparative sites mentioned in the text. Contains Ordnance Survey data © Crown copyright and database right 2022. Coordinates in British National Grid (OSGB36).
As a county, Leicestershire has few potential sites that have accumulated long sedimentary records, these being Groby Pool (David, 1991) and Narborough Bog (Brown, 1999). Here we examine the former, because it has a detailed sedimentary record of change from at least the 17th to late 20th centuries (Bennion et al., 2015; David et al., 1998; David and Roberts, 1991; Davidson et al., 2005; Sayer, 2001; Sayer et al., 1999; Yang and Rose, 2005a).
The published and stratigraphically well-constrained proxy datasets from Groby Pool have identified physical and biological changes in the area’s landscape and in the lake itself, incorporating the period of major industrialisation in this region (Bennion et al., 2015; David, 1991; Davidson et al., 2005; Sayer, 1997; Yang and Rose, 2005a). We aim to address the following questions: are discrete mid-20th century signals of the Anthropocene identifiable in a sedimentary succession closely reflecting intensive and early industrialisation and agricultural intensification of the surrounding landscape; and does Groby Pool provide a useful comparative site for correlating the Anthropocene sensu Waters et al. (2023, 2024a, 2024b), locally (lake catchment area) regionally (East Midlands) and globally into the birth-area of the Industrial Revolution, even if such a stratigraphical unit is informally defined?
Data sources and methodology
Site location
Groby Pool (52°40’09”N 1°13’48”W) is an artificial, shallow lake (~1.8 m depth) with an area of 12 ha (Figure 2). The exact origin of the pool is unknown but it is estimated to date to at least the early 13th century following damming of the Slate Brook (David, 1991). Groby Pool has been designated as a Biological Site of Special Scientific Interest since 1956 CE. The lake has no record of being drained and is surrounded by arable fields with wet woodland dominated by Alnus glutinosa and Salix spp. enclosing the lake to the northwest, and quarries to the northeast that previously extracted igneous rocks but now focus on concrete and asphalt production. The village of Groby lies to the south and is downstream of the lake. Changes in land-use and environmental changes surrounding Groby Pool have been previously reconstructed back to at least the 14th century through fossil pollen (David, 1991), though this paper focuses on the past 400 years. These demonstrate modification to the landscape associated with farming practices since the 18th century, with managed mixed oak woodlands being deforested in the 20th century (David and Roberts, 1991). The ecological history of Groby Pool itself has been explored using palaeoecological indicators from multiple components of the food-web including diatoms, aquatic plants, zooplankton, chironomids, bryozoans, Mollusca and fish (Bennion et al., 2015; Sayer et al., 1999). However, the anthropogenic disturbances of Groby Pool and the surrounding areas have not been considered in the context of the Anthropocene concept and the questions that it stimulates.
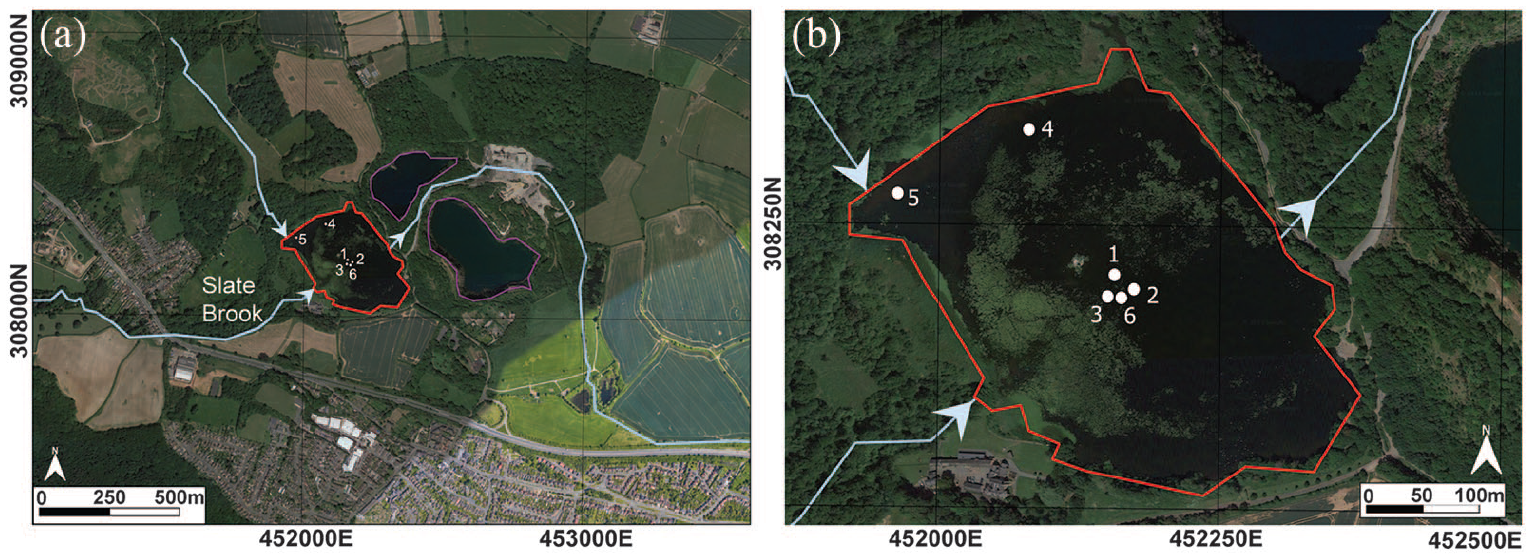
(a) Map of Groby Pool (red outline) and its surrounding area. Stream inflows and outflows (blue lines and arrows) are also marked. Quarries to the east have been submerged (purple outline) and Groby village is downstream to the south/southeast. (b) Close-up view of Groby Pool. Published cores with locations have been plotted (1, Core 24; 2, Core 31; 3, Core GR95b; 4, GROB2; 5, GROB4; and 6, GROB5). No precise location was provided for GROB1. Satellite imagery from Google Maps © 2023. Coordinates in British National Grid (OSGB36).
Data sources
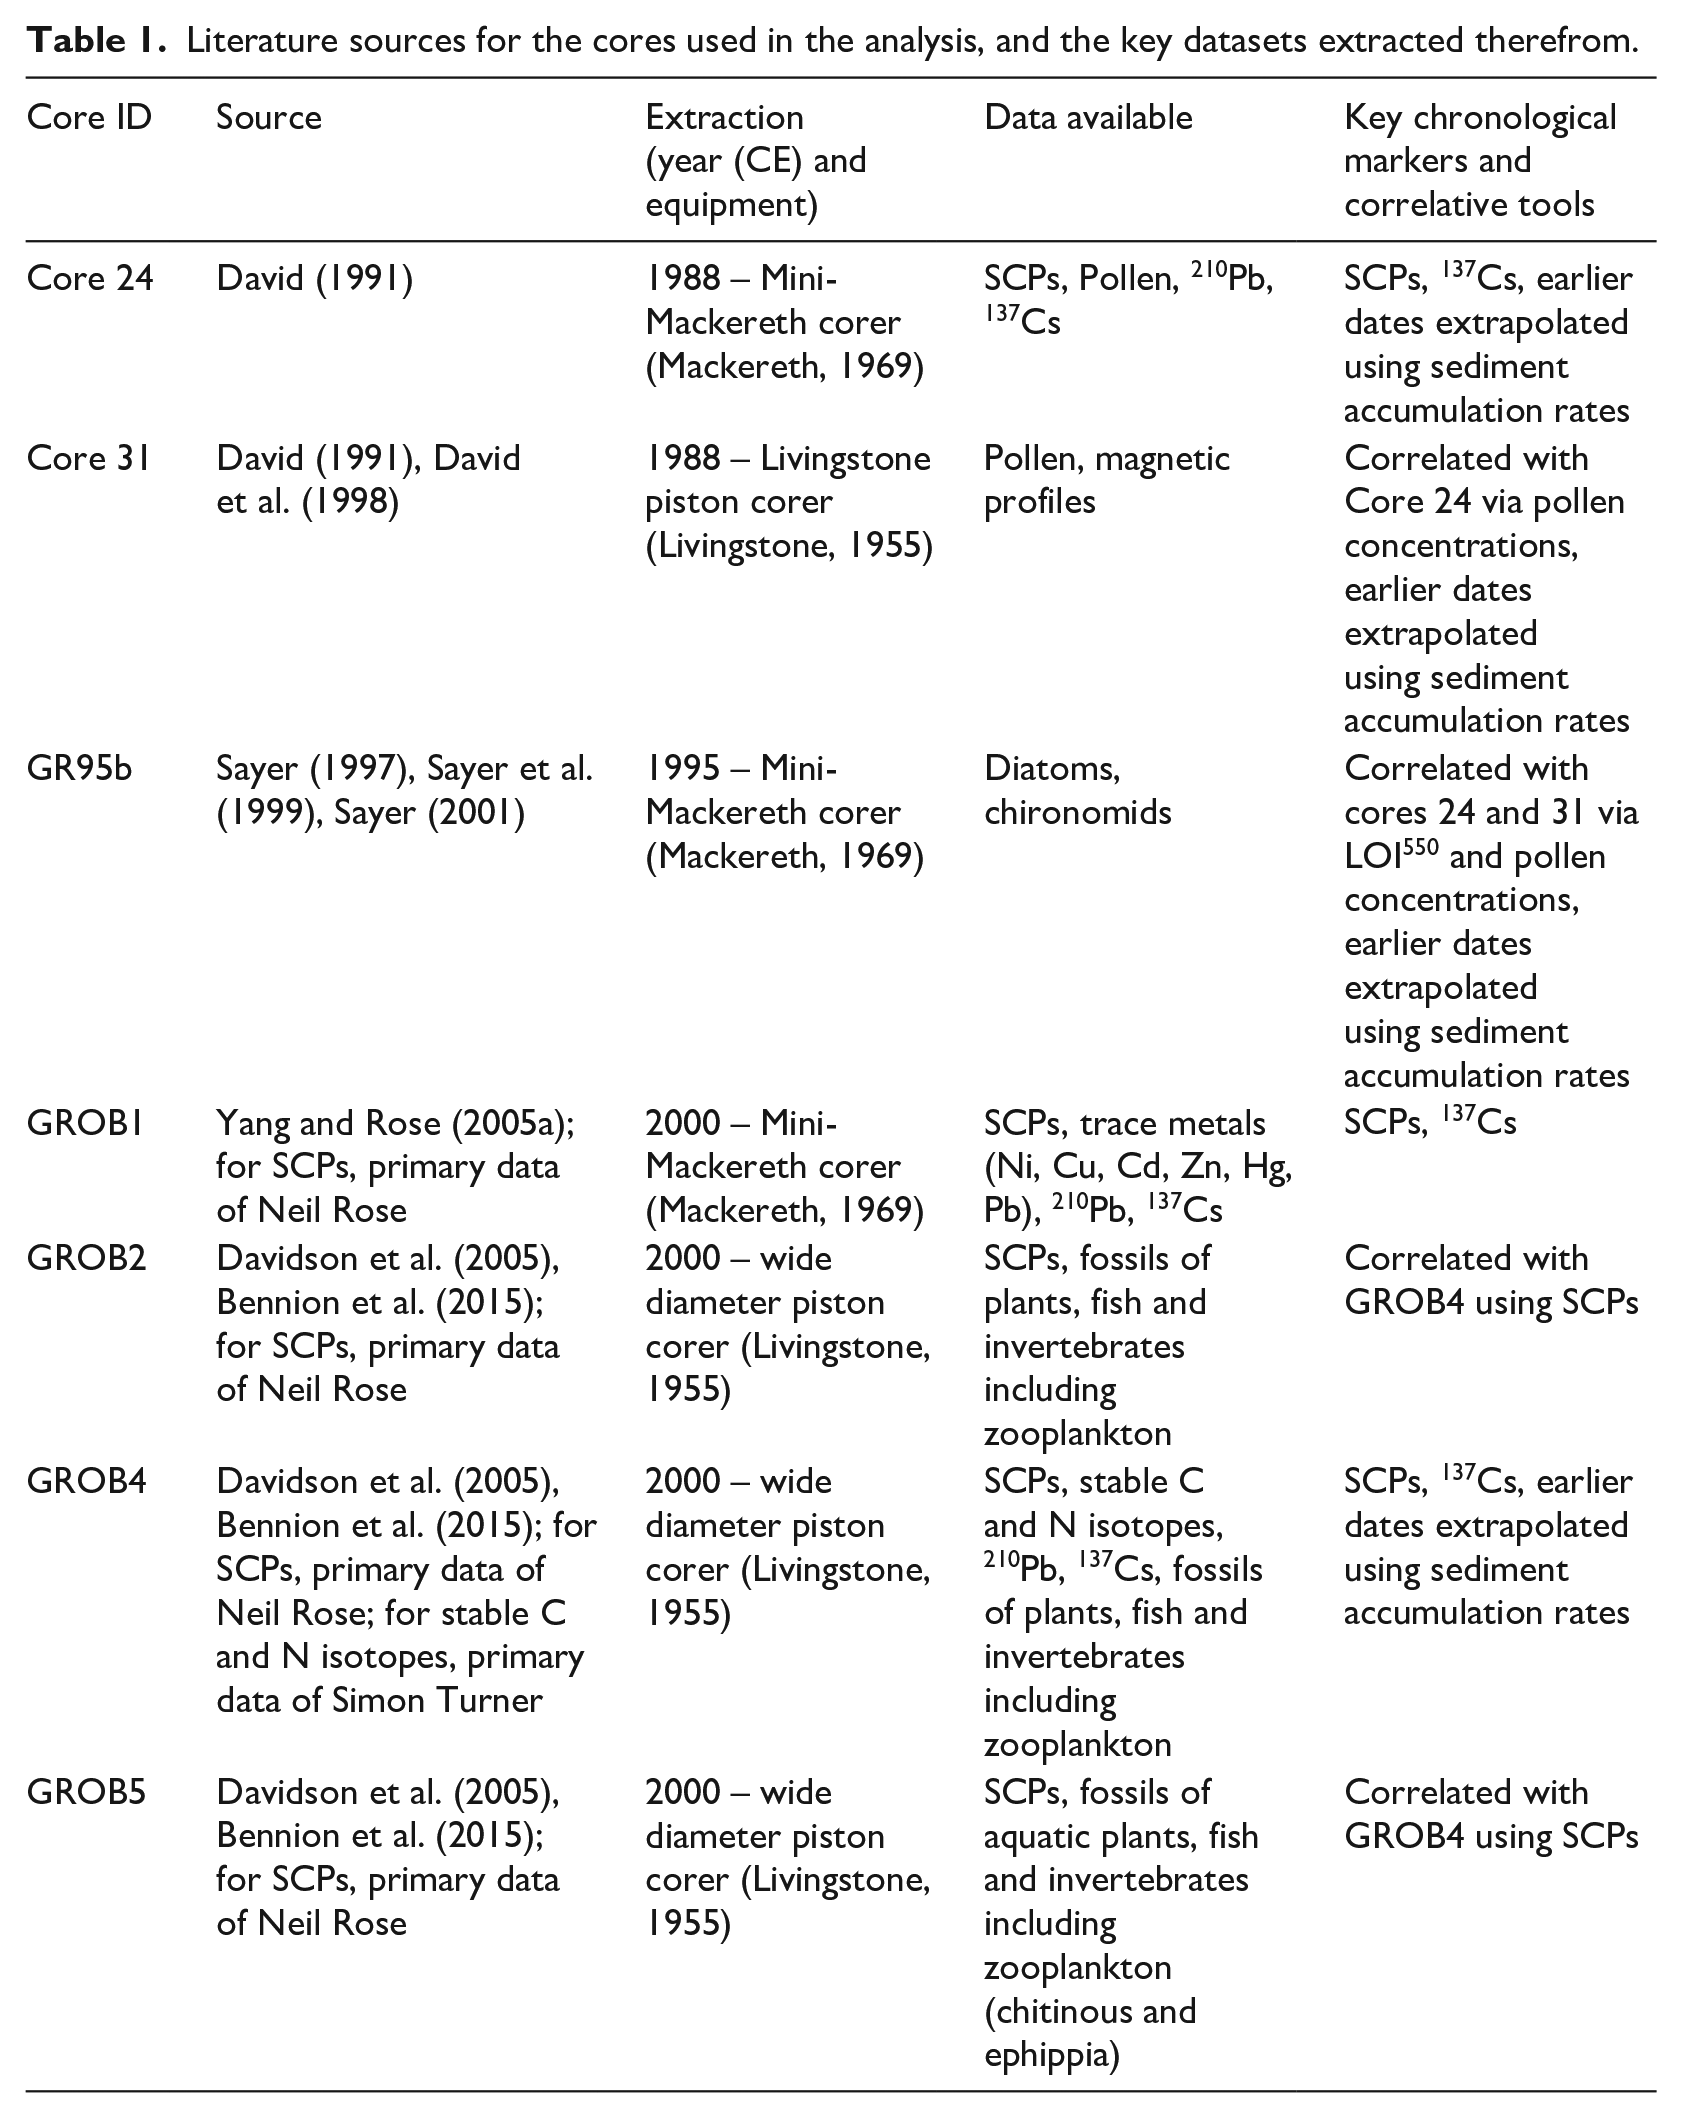
The data for this paper have been collated through a review of published and unpublished literature, focussed on seven cores taken from Groby Pool between 1988 and 2000 CE (Table 1 and Figure 2). The chronological markers analysed between the different cores include the concentration of 137Cs and 210Pb, and the abundance of SCPs when compared with the Rose and Appleby (2005) model. Correlation between cores utilises percentage organic matter (loss-on-ignition 550°C, (LOI550), see Heiri et al., 2001), pollen concentrations, SCPs stratigraphy, and where possible the profiles of concentrations of 137Cs (Table 1).
Literature sources for the cores used in the analysis, and the key datasets extracted therefrom.
Chronology
Here we collate existing published data on the various chronological markers that were used for dating the Groby Pool cores, and thereby demonstrate how stratigraphical datasets from earlier studies can be used for identifying a mid-20th century start point for the Anthropocene, sensu Waters et al. (2023, 2024a, 2024b). 137Cs and SCP profiles are used as primary chronological markers (Table 1). The record of Pb trace metal concentrations supplements this chronology in core GROB1. In those cores without such records, correlation to the chronology is achieved using LOI550 and pollen concentration profile data (see David, 1991; Sayer, 1997).
Radiometric signatures
In previous studies, sediment samples from three Groby Pool cores (Table 1, cores 24, GROB1 and GROB4) were 210Pb dated through direct gamma assay, however the dating precision of each 210Pb record was relatively low (see David, 1991; Davidson et al., 2005). The chronology of GROB1 using Plum (Aquino-López et al., 2018), which is a Bayesian model specially built for 210Pb, shows the uncertainty of the record (Supplemental Figure 1). 137Cs concentrations are recorded in the cores and, despite the short half-life of this radiogenic isotope (~30 years), the profile of the curves proves useful for dating as the cores were taken before 2000 CE, with relatively high sediment accumulation rates. Although 137Cs can be mobile under certain conditions (Crusius and Anderson, 1995), we have been careful to combine 137Cs stratigraphical records with supporting evidence from the rapid mid-20th century rise in SCPs. The 137Cs record shows onset or rapid rise in the 1950s and a peak in 1963–1964 CE (Ferreira et al., 2016; Fiałkiewicz-Kozieł et al., 2023; Gałuszka et al., 2017; Han et al., 2023; Kuwae et al., 2023; Pennington et al., 1973; Stegner et al., 2023). In Groby Pool, there is also a second 137Cs peak attributable to fallout from the Chernobyl disaster in 1986 CE (Appleby, 2002; Li et al., 2017). The estimate for the pre-1850 CE dating in the pollen and diatom data have been extrapolated from the SCP 1850 CE level, using the average sediment accumulation rate calculated from the 137Cs and SCP profiles (Jeter, 2000). However, given that there is a change in sedimentary motif from gyttja to silty clay in the cores below the well-dated levels (i.e. below 1850 CE), and therefore likely a change in mode of sedimentation, the earlier dates should be viewed as approximations only.
Spheroidal carbonaceous particles (SCPs)
For Core 24 and GROB1, a chronology was inferred by comparing the SCPs record in the lake to the model for South and Central England established by Rose and Appleby (2005), which indicates that SCPs start to accumulate ~1850 CE ± 25 years in central England, with the peak at ~1970 CE ± 5 years. The SCP record provides a good match with the chronology inferred from the peak 137Cs record in this core. The chronologies for cores GROB2, GROB4 and GROB5 were also based on the SCP model of Rose and Appleby (2005), as used in the original publication (Davidson et al., 2005). Cores with both SCP records and 210Pb-derived dates have been used from two nearby comparison sites: Agden Reservoir, Sheffield and Edgbaston Pool, Birmingham (Figure 1) (Rippey et al., 2008; Turner et al., 2013).
Lead (Pb)
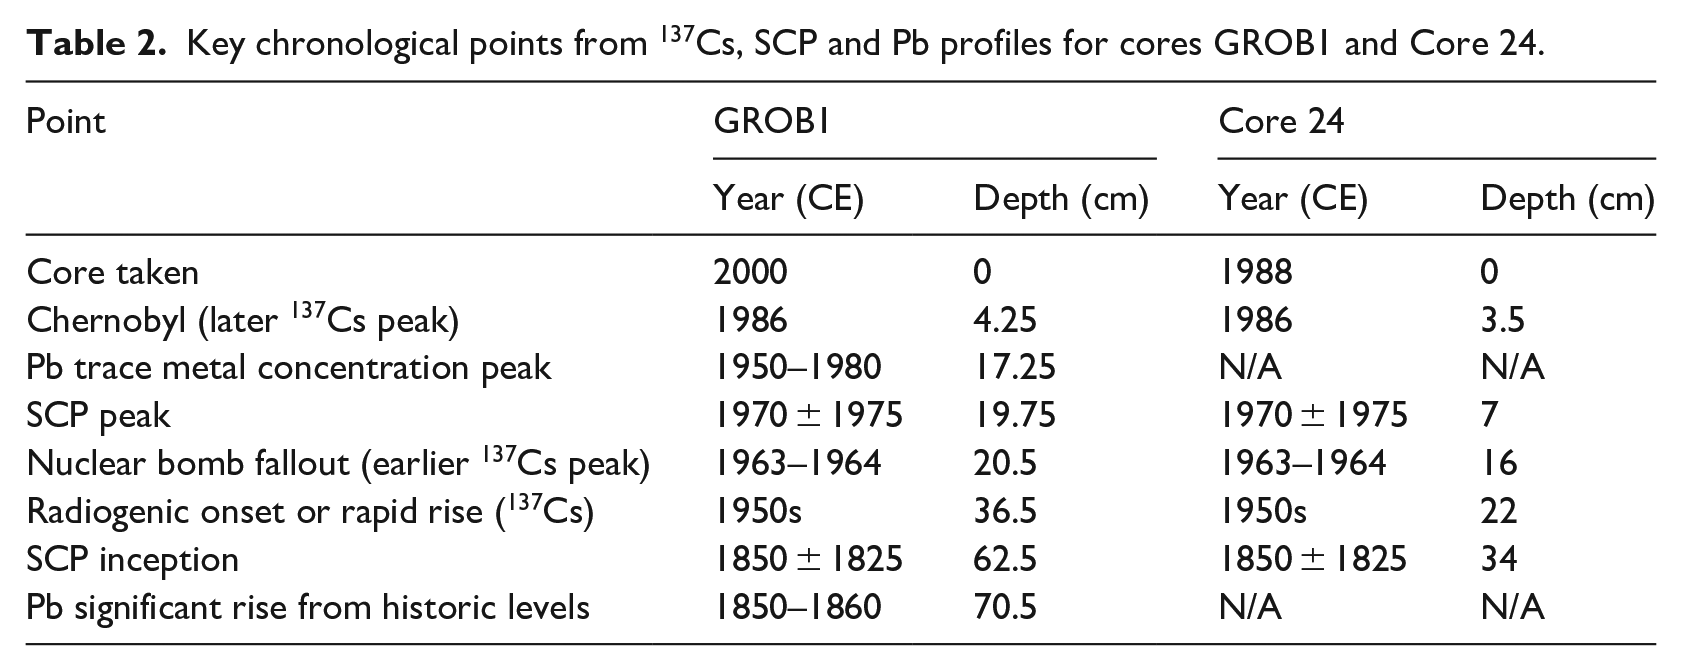
There has been a long history of anthropogenic lead (Pb) contamination in the UK, mainly from fossil fuel combustion and metal production (Rauch and Pacyna, 2009). The recognised pattern of this contamination can be used to support the core chronology from 137Cs and SCP records in core GROB1. There is a sharp rise in Pb from ~1850 to 1890 CE (UK mostly 1850–1860 CE) which could be linked to coal burning (Price et al., 2011), with a peak at ~1950 to 1980 CE (focussed around 1970 CE) probably linked to increased use of Pb additives in petrol, thereafter declining, which can be seen in other sites in the UK and Europe (Marx et al., 2016; Schwikowski et al., 2004; Yang et al., 2007; Yang and Rose, 2005b).
Biological markers
Pollen records and observational surveys were interrogated to identify the arrival of non-native taxa that could provide datable introduction records, as utilised in other Anthropocene studies (e.g. Fiałkiewicz-Kozieł et al., 2023; Himson et al., 2023), though some non-native taxa, such as cultivars of cereals, are typically poorly represented in fossil pollen records (Hall, 1989). Because the first decades of the 21st century are not recorded in the cores (which were sampled in the late 20th century), new cores and greater taxonomic detail would be needed to examine more recent biotic changes in the local landscape, such as more recently introduced non-native species.
Available datasets recording environmental change
Palaeoecological and geological records
Existing published palaeoecological data, namely pollen, diatoms, chironomids, plants, fish, and invertebrates including zooplankton (Bennion et al., 2015; David, 1991; Davidson et al., 2005; Sayer, 1997), have been examined to identify environmental changes in and around Groby Pool, and to investigate whether these have anthropogenic causes. Available trace metals data, such as Pb, nickel (Ni), copper (Cu), cadmium (Cd), zinc (Zn) and mercury (Hg) (Yang and Rose, 2005a) have also been examined as signatures of environmental changes where their concentrations can be linked to anthropogenic sources, such as agriculture, industrial waste and air pollutant fallout from increased industrialisation and fossil fuel combustion (Renberg, 1986). Given that Groby Pool records a history of human-induced change spanning several centuries, we evaluate the various signals of anthropogenic influence from both an ‘episodes’ (here at the centennial scale) and ‘events’ (decade/sub-decadal scale) context, following Waters et al. (2022).
Stable carbon and nitrogen isotopes
Total carbon, nitrogen, and their stable isotope ratios (δ13C and δ15N) were measured at four depths from GROB4 sediment samples covering a timescale from the late-18th century to the late-20th century, based on 137Cs and SCP dating. These measurements were conducted for the NERC Macronutrients project (Turner and Rose, 2015). Low-temporal resolution core records from a greater number of sites were collated across the UK to investigate landscape/catchment scale fluxes in carbon and nitrogen through the Holocene (Turner and Rose, 2015).
Cluster analysis of biological datasets
Constrained hierarchical clustering was used to identify biozones for the macrofossil and pollen data. The clustering of the macrofossil samples in GROB2, GROB4 and GROB5 was undertaken using constrained clustering analysis (CONISS) (Bennion et al., 2015), and the major assemblage zones were collated for each biological group to highlight timing of compositional changes. Pollen diagrams were created using the ‘rioja’ package in RStudio (Juggins, 2023), where hierarchical clustering was undertaken, and exaggeration curves were added to the pollen signals through silhouettes to highlight changes when the pollen is present in low quantities. We also used fuzzy c-means clustering for the original pollen data (Core 31) to identify a soft boundary for assemblage zone transitions, compared to the hard boundary produced by hierarchical clustering.
Results
Here we examine the chronological markers and proxies from all the Groby Pool cores (Figure 3). The original publications provide further lithological details (Bennion et al., 2015; David, 1991; David et al., 1998; Davidson et al., 2005; Sayer, 2001; Sayer et al., 1999; Yang and Rose, 2005a).
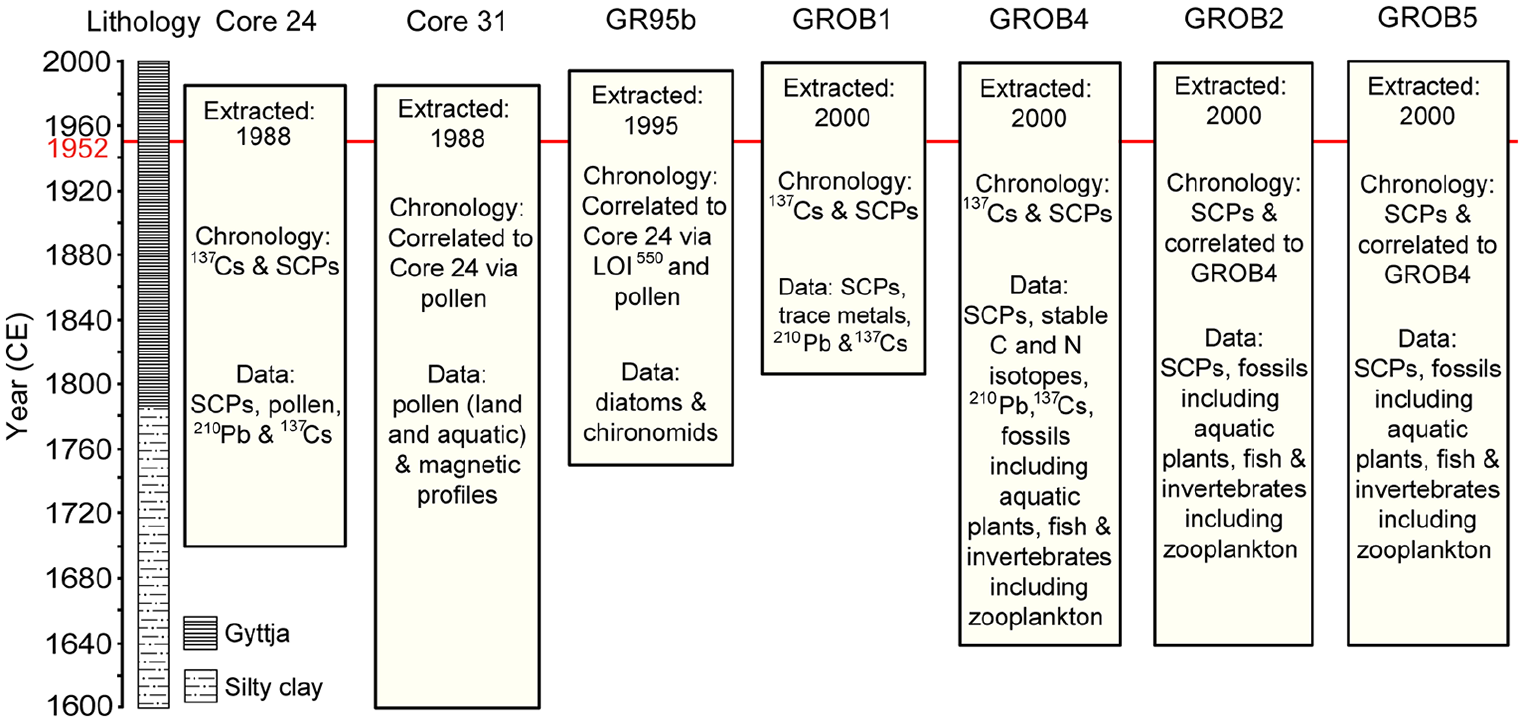
Summary of cores used in this study in graphical form (see Table 1), including generalised lithology (left) and how the chronology was established using combined evidence from the profile of 137Cs, SCPs (when compared to data in Rose and Appleby (2005), and the signature from Pb contamination compared with Yang and Rose (2005b) and Marx et al. (2016).The red line approximates the inferred stratigraphic level of the 1952 CE boundary for the base of an Anthropocene series proposed by Waters et al. (2023, 2024a, 2024b). Pre-1850 CE dates are estimated by extrapolating from the 1850 CE SCP level using sediment accumulation rates calculated from 137Cs and SCP profiles. Pollen signatures and percentage organic content were also used to correlate between some cores. The main proxies for environmental change, especially lake fauna and flora, have been listed.
Description and chronology of cores
GROB1 core (88 cm) was one of the series extracted in 2000 CE. No sediment description is provided. Several cores from Groby Pool have poor 210Pb dating, including GROB1. Hence profiles of 137Cs, SCPs and trace metal concentration of Pb were analysed to provide a chronology (Table 2 and Figure 4). The 137Cs profile in GROB1 compares well to that from the Sihailongwan Maar Lake succession in China (Han et al., 2023), one of the three proposed standard auxiliary boundary stratotype sites for the Anthropocene, and we interpret the rapid rise of 137Cs to be in the early 1950s with a 1963–1964 CE peak (Figure 5); this is supported by the Groby Pool SCP and Pb stratigraphical signatures (see next section). Through a chain of correlation that involves the 137Cs and 239+240Pu signatures at Sihailongwan Maar Lake, we correlate GROB1 with an accuracy of circa ± 5 years to the proposed Crawford Lake GSSP site for the base of the Anthropocene series (Han et al., 2023; McCarthy et al., 2023; Waters et al., 2024a, 2024b). The trace metals (Pb, Ni, Cu, Zn, Cd and Hg) signatures were also analysed to examine anthropogenic impacts. We use this core for the master chronology in the lake as it exhibits clear concentrations of 137Cs, SCPs and Pb that provide an integrated timeline. See following section for detailed description of peaks.
Key chronological points from 137Cs, SCP and Pb profiles for cores GROB1 and Core 24.
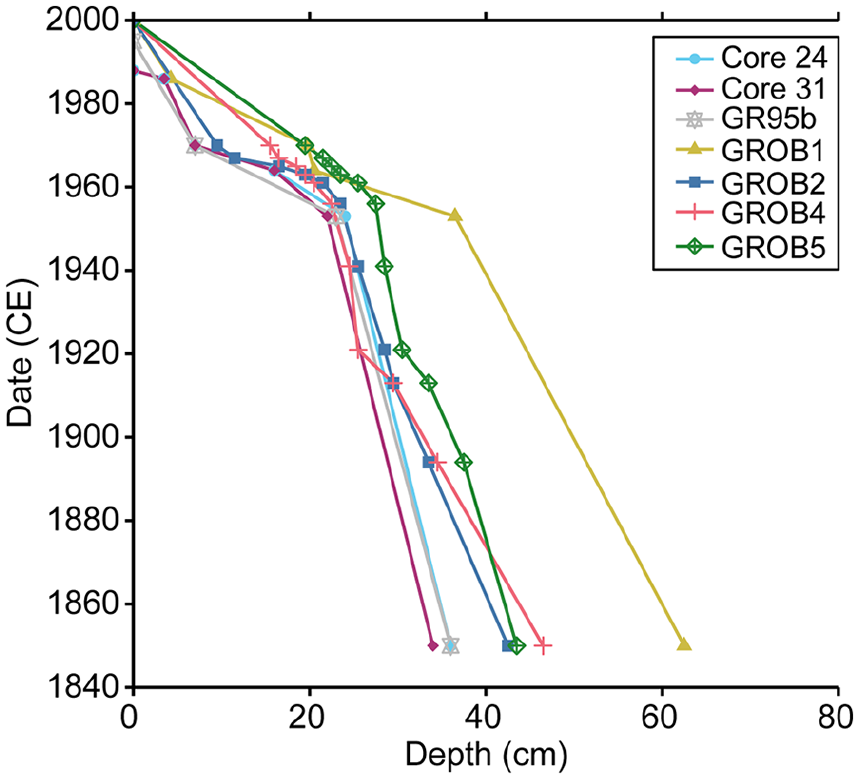
Age-depth models of all the Groby Pool cores and the chronologies used in this study. Core 24, Core 31, GR95b and GROB4 chronologies are derived from 137Cs and SCPs, GROB1 is from 137Cs, SCPs and Pb concentrations and GROB2 and GROB5 are derived from SCPs. Dates prior to 1850 CE used in the rest of this study have been extrapolated from these models using sedimentation rates for each core.
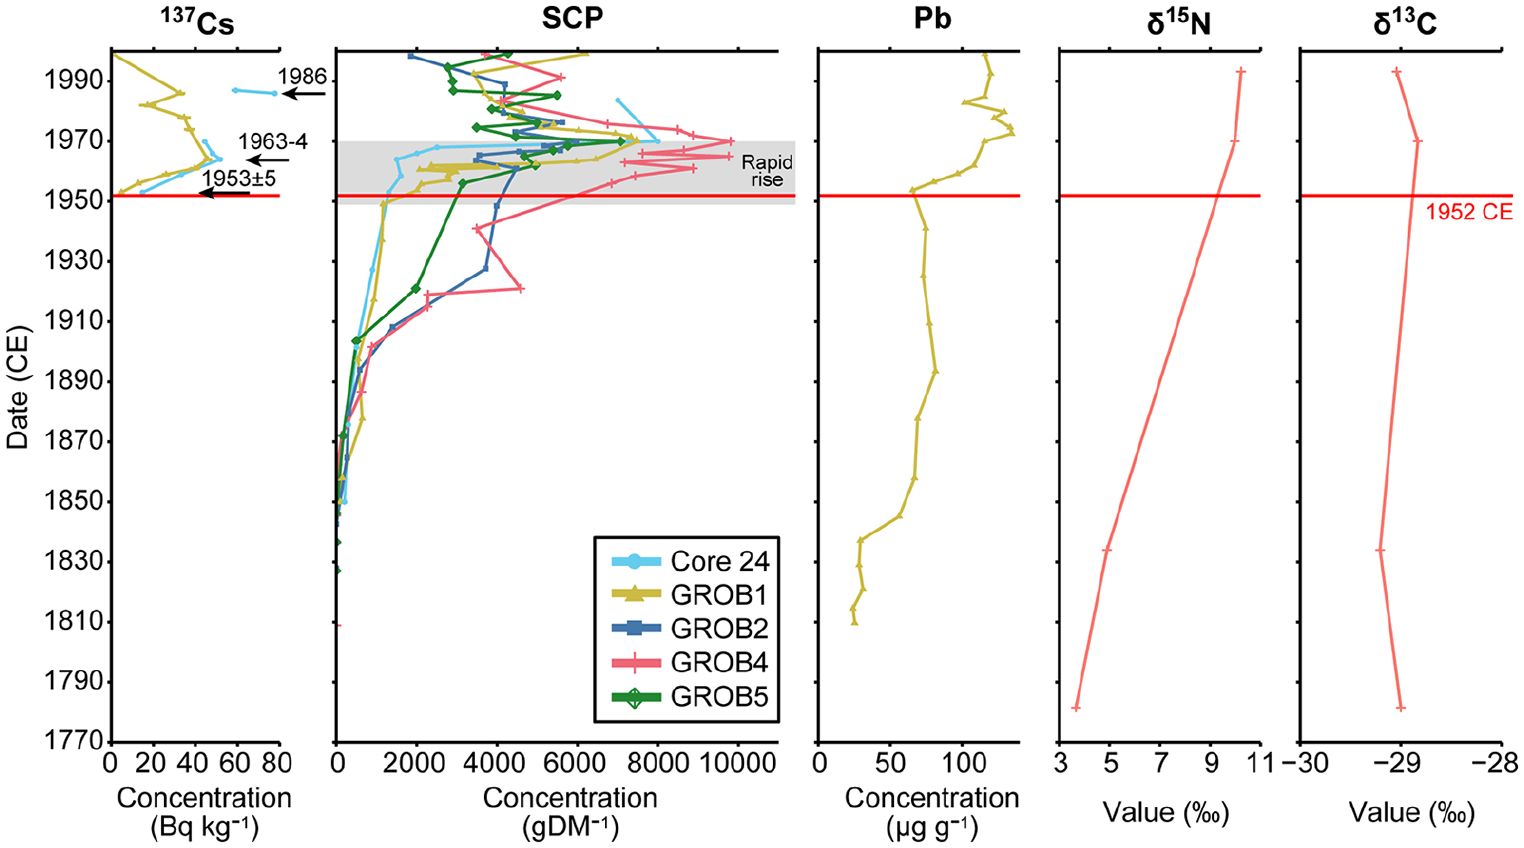
Profiles of key Anthropocene markers from several Groby Pool cores. Caesium (137Cs) from GROB1 and Core 24 (data gap between 1970 and 1986) shows the rapid rise from the mid-20th century, and peaks relating to the 1963–1964 CE fallout maximum and Chernobyl nuclear reactor disaster in 1986 CE. The SCP profiles of five Groby Pool cores shows inception at ~1850 ± 25 CE. The high resolution GROB1 dataset shows rapid SCP rise from ~1950 CE (grey shaded area), which is consistent with Core 24. GROB2, GROB4 and GROB5 are low resolution records, showing less well-constrained increases from the mid-20th century. The Pb profile from GROB1 shows an increase from ~1850 CE with a peak at ~1970 CE, followed by a decline. Although low-resolution, the δ15N profiles from GROB4 appears to show an increase over ~100 years, whereas the δ13C shows no overall direction of change. Note different scales on x-axes. The red line approximates the inferred stratigraphic level of the 1952 CE boundary for the base of an Anthropocene series proposed by Waters et al. (2023, 2024a, 2024b). The pre-1850 CE dates were extrapolated using sedimentation rates for each core as indicated in Figure 4.
Core 24 (1 m) was collected in 1988 CE from the centre of Groby Pool. Only the upper 80 cm was used for palynological analysis, SCPs and radiometric dating. The 210Pb age-depth model is of low resolution and therefore evidence from the peaks in 137Cs and SCPs were used to build a chronology (Table 2 and Figure 4). Similar to GROB1, the profile of the 137Cs record can be compared to that of the Sihailongwan Maar Lake succession, and thus to the proposed Crawford Lake GSSP through the chain of correlation we note above. For dates before 1850 CE, sedimentation rates were calculated for each point and the average sedimentation rate (0.826 cm yr−1) was used to extrapolate from the SCP 1850 level to estimate earlier dates.
Core 31 (4 m) was taken adjacent to Core 24 in 1988 CE. It was used to infer local landscape change via pollen analysis, focussing on the top 180 cm from approximately the late 1600s–1988 CE. No sedimentary lamination is evident in the core, with the upper part being black homogeneous organic-rich sediment (gyttja) and a transition to silty clay lower in the core at ~90 cm (David et al., 1998). The chronology of Core 31 was established by correlation to Core 24 via pollen (Figure 4) (see David, 1991 for correlation profile) and extrapolated for earlier core levels before 1850 CE using sediment accumulation rates calculated from the 137Cs and SCP profiles.
Core GR95b (1.04 m) was extracted in 1995 CE. The top of the core is made of dark organic gyttja and changes at ~77 cm to brown silty clay. Diatoms and chironomids were analysed in this core to assess environmental change (Sayer, 1997; Sayer et al., 1999). Diatom-inferred total phosphorus was also analysed; however, it is not included in this study as it has been shown previously that it is inconsistent with the eutrophication history of the pool (Sayer, 2001). The age model for this core is based on extrapolation with cores 24 and 31, established by correlating percentage organic matter (see Sayer, 1997 for correlation profile).
GROB2 (73 cm), GROB4 (92 cm) and GROB5 (85 cm) cores were extracted in 2000 CE. The cores show a boundary between an upper interval of homogeneous gyttja to a lower silty clay at ~60 cm. GROB4 is reported as having a poor 210Pb record, so the SCP and 137Cs profiles were used for dating (Davidson et al., 2005). For GROB2 and GROB5, SCPs were counted to provide a chronology based on the Rose and Appleby (2005) model, and for correlation with other core records (Davidson et al., 2005). Fossils of aquatic plants, invertebrates, zooplankton and fish were examined in GROB2, GROB4 and GROB5 cores, and correlated to each other using the SCP-derived model in Bennion et al. (2015) to provide a larger dataset to identify systematic change in the ecological communities. Stable carbon and nitrogen isotopes were measured for GROB4 on freeze-dried archived sediments in 2013 CE.
Markers consistent with a mid-20th century Anthropocene definition
The 137Cs profiles from GROB1 and Core 24 show a global signal, including inception, rapid rise and peaks (Figure 5). The rapid rise of 137Cs, estimated to be in the 1950s, can be seen in both GROB1 and Core 24 and is supported by the Groby Pool SCP rise which is a well-established chronology (Rose and Appleby, 2005). This is followed by a 137Cs peak likely linked to the 1963–1964 CE fallout maximum from nuclear weapons testing. Using the comparison with Sihailongwan Maar Lake, the rapid rise of 137Cs does not correlate to the exact proposed 1952 CE base of the Anthropocene horizon in Crawford Lake, but is within a few years of resolution of that, and is consistent with rapid increase in the 1950s seen at other sites globally (Waters et al., 2023, 2024a, 2024b). A second more pronounced 137Cs peak is present in Core 24, with a lesser defined secondary peak in GROB1, deemed to be ~1986 CE, and indicative of the Chernobyl disaster (Appleby, 2002). This Chernobyl peak is not present in Crawford Lake, showing that it is a regional (e.g. European) signal.
In addition, the SCP profile between five Groby Pool cores (Core 24, GROB1, GROB2, GROB4 and GROB5) show a signal in the mid-20th century (Figure 5). The inception of SCPs is estimated to be ~1850 CE ± 25 and peaks in ~1970 CE, by reference to the Rose and Appleby (2005) model. With a high-resolution dataset, GROB1 shows the rapid SCP acceleration from ~1950 CE. This is consistent with the rise in Core 24 and GROB5 after the mid-20th century, whereas GROB2 and GROB4 show a less well constrained increase which is likely due to the low-resolution datasets and the different coring locations with varying sediment accumulation rates. For both GROB1 and Core 24, this is consistent with the 137Cs record, showing a rapid increase after the mid-20th century. The Pb concentrations in GROB1 also support this chronological interpretation, which show a rise ~1850 to 1860 CE, likely linked to increased burning of coal (Price et al., 2011), with a peak in ~1970 CE from leaded petrol use, before decreasing (Figure 5), in agreement with other lakes in Europe (Marx et al., 2016; Yang and Rose, 2005b).
When comparing the GROB1 records to the nearest UK sites with equivalent data, the SCP profile pattern is similar. A core from Edgbaston Pool in Birmingham (EDGB2, see Figure 1), a site close to the epicentre of the Industrial Revolution, shows a record from the 1940s with an increase in SCP concentration from ~1951 CE, and a peak in the late 1970s (Figure 6). An increase is seen in a core from another UK site, Agden Reservoir (AG2, Figure 1) from 1940 CE with another rapid acceleration evident from 1963 CE. Cores EDGB2 and AG2 both have higher SCPs concentrations than GROB1, likely due to their closer proximity to the heavy industrial areas of Birmingham and Sheffield/Manchester, respectively. The corresponding increase in SCP concentrations around the mid-20th century is a stratigraphical marker seen globally (Rose, 2015).
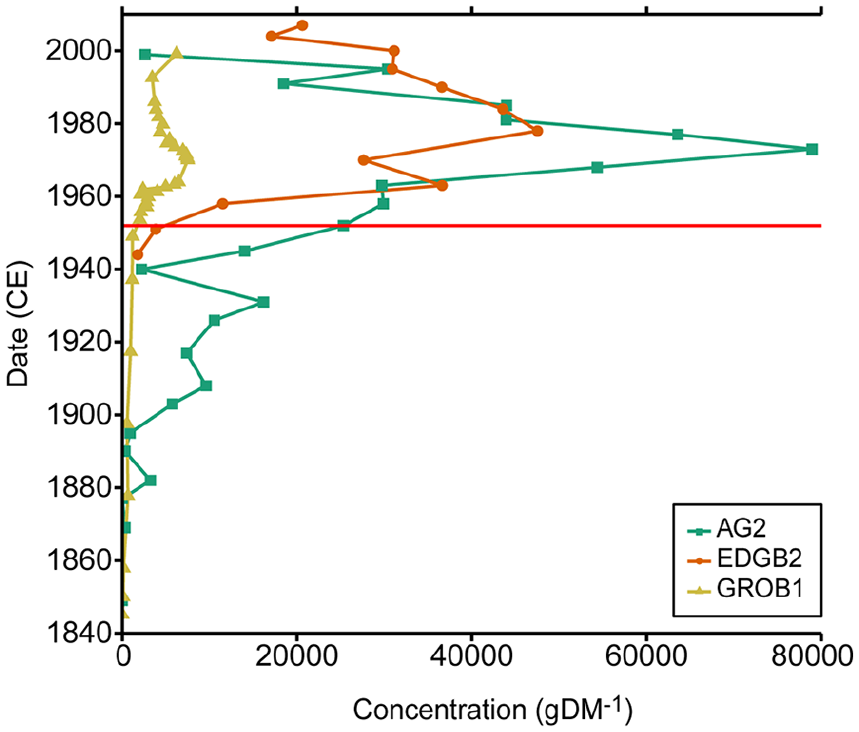
SCP concentration for GROB1 core and two comparison sites: Agden Reservoir, Sheffield (AG2) and Edgbaston Pool, Birmingham (EDGB2). The records show the SCP acceleration after the mid-20th century in these industrial landscapes. The red line approximates the inferred stratigraphic level of the 1952 CE boundary for the base of an Anthropocene series proposed by Waters et al. (2023, 2024a, 2024b).
The low-resolution nitrogen isotope record from Groby Pool shows a large positive difference in δ15N values between the early 1800s CE and the late 1990s; from 3.66‰ to 10.23‰ (Figure 5). Total carbon and nitrogen values also triple over the same period (C 0.033–0.1017 g g−1 DW, N 0.004–0.0113 g g−1 DW). Such a positive change (>6‰) of bulk sediment δ15N values and an increase in organic matter accumulation is consistent with the known eutrophication history of Groby Pool (Sayer, 2001).
All the trace metals, except Ni, show an overall increase in concentration above ~75 cm in GROB1 (estimated mid-19th century) with varying levels of fluctuation (Figure 7). Magnetic profiles of Core 31 show an increase in subsoil input into the lake in the ~1830s (based on the 137Cs and SCP extrapolated chronology) (David et al., 1998). This change and the increase of trace metals, particularly Cd and Hg, coincides with granite quarrying in Groby, which is closely linked to the development of the railway network that opened in 1832 CE (Woodward, 1984). Cu, Pb and Zn are the main indicators used for identifying anthropogenic pollution in sediments, as patterns of increased atmospheric emission rate can be identified in the first half of the 20th century, linked to mine production and industrial emissions, followed by a decrease from the 1970s (Birch et al., 2015; Callender, 2014; Rippey et al., 2004, 2008). Pb increased since the mid-20th century linked to petroleum combustion in Europe until it was banned as an additive to fuel in the 1990s (Barbante et al., 2017). Cu and Pb show a steady increase from the 1950s until the 1970s where they stay constant, whereas Zn shows little variation through the mid-20th century. Increasing Cd concentrations in Groby Pool, especially since the mid-20th century, are likely due to fossil fuel use, the greater demand for products containing Cd, such as batteries and plastics, as well as an expansion in the alloy industry through mining, smelting and electroplating (Granmo et al., 2020).
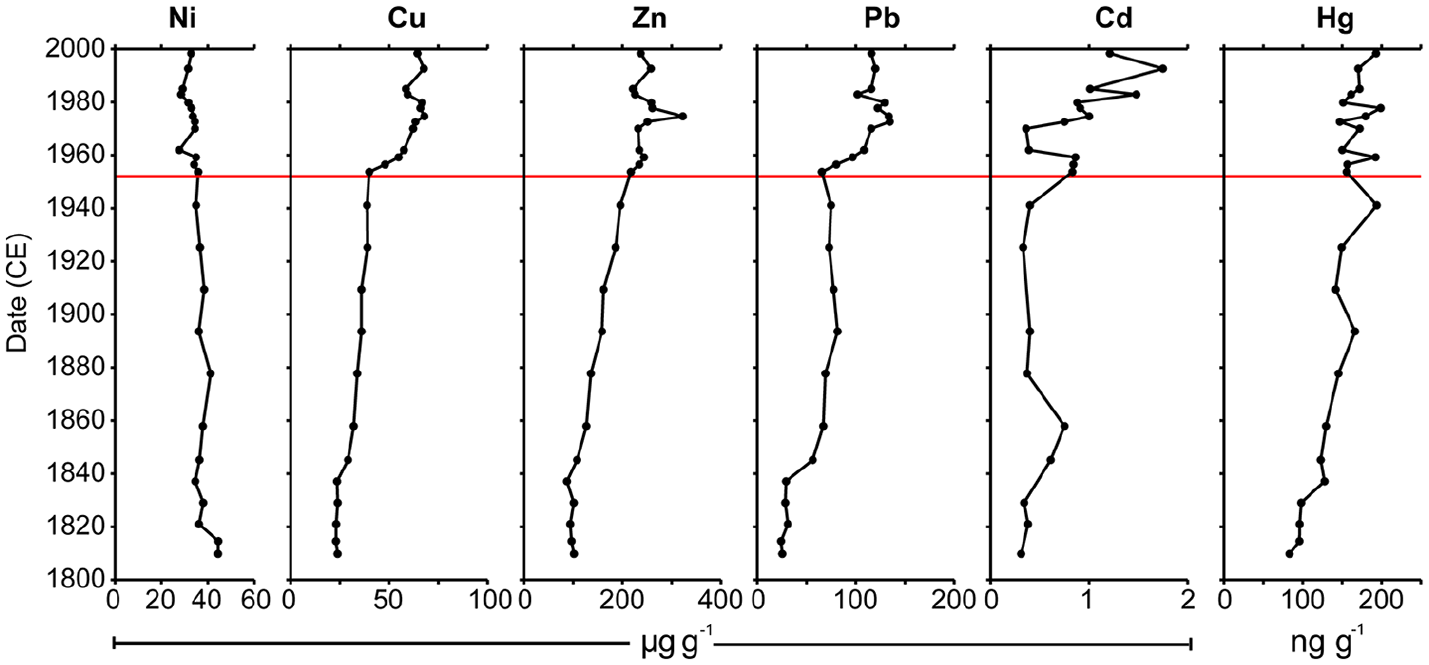
Trace metal concentrations from GROB1 core (re-drawn from data in Yang and Rose, 2005a). The red line approximates the inferred stratigraphic level of the 1952 CE boundary for the base of an Anthropocene series proposed by Waters et al. (2023, 2024a, 2024b). The pre-1850 CE dates in the core were extrapolated using the average sedimentation rate indicated in Figure 4. Note the different scales and units on the x-axes.
Many trace metals reflect more local and regional impacts rather than global effects (Dong et al., 2021; Gałuszka and Migaszewski, 2018). Cu can be linked to industrial and municipal wastewater (Gałuszka et al., 2019), and it is documented that a new sewage treatment area was constructed upstream of Groby Pool in 1935 CE (Sayer, 1997). This could be a contributor to an increase in Cu seen from the mid-20th century in GROB1. Local quarry processing could also be a contributor through fossil fuel combustion, especially coal. The Hg record increases overall from 75 cm (estimated mid-19th century), which could be linked to coal combustion in the region. However, while there was a reduction in Hg emissions in the UK since the 1970s (Yang et al., 2016), this cannot be seen in the Groby Pool record likely due to legacy Hg in the catchment feeding into the lake or potentially contributions from a long-range source as Hg has a long atmospheric lifetime (Lindberg et al., 2007). Hg, Pb, Cu, Zn and Cd all show early pollution before 1950 CE, when compared to other records in the UK and globally (Yang and Rose, 2005b), as probably linked to local early industrialisation.
Biotic signal
Here we synthesise patterns of biological change from several cores resulting from the CONISS and fuzzy clustering analysis (see Table 1 and Figure 3).
Core 31, pollen record
The pollen record (Figure 8a) shows a steady decrease in Quercus (oak) from the late 1600s to the late 1700s, with an increase in Poaceae on the same timescale. Magnetic profiles of Core 31 reflect a temporary peak in topsoil erosion in the 1780s (based on extrapolated dates), which correlates with Parliamentary Enclosure in the late 18th century when agricultural activity increased (David et al., 1998; Woodward, 1984). Fraxinus (ash), Alnus (alder) and Corylus (hazel) pollen remained constant until Alnus increased in the mid-1800s. At 58 cm hierarchical clustering shows a pollen assemblage zone change that is estimated to be in the early 1800s with an increase in tree cover including Betula, Pinus, Ulmus, Taxus and Populus. This change is thought to relate to the planting of small woodlands in surrounding estates for income through timber production, hunting and shooting (David and Roberts, 1991; Woodward, 1984). However, this is more transitional rather than an instant change, as shown in the fuzzy clustering (Figure 8a; Supplemental Figure 2) which confirms the significance of the increase in tree pollen between 57 and 39 cm. There is evidence of anthropogenic influence likely due to local agricultural activity with a constant low signal from Cerealia pollen and other pastoral taxa indicators including Asteraceae, Plantago and Rumex. The aquatic plant pollen record (Figure 8b) has three assemblage zones, compared to two in the land pollen. From the late 1600s, there is a decrease in Potamogeton with an increase in Myriophyllum until the mid-1700s when Typha starts to increase as Myriophyllum decreases slightly. In the mid-1800s, the second pollen zone change occurs as Myriophyllum decreases further, while Typha and Callitriche increase significantly, suggesting nutrient enrichment (Sayer, 1997).
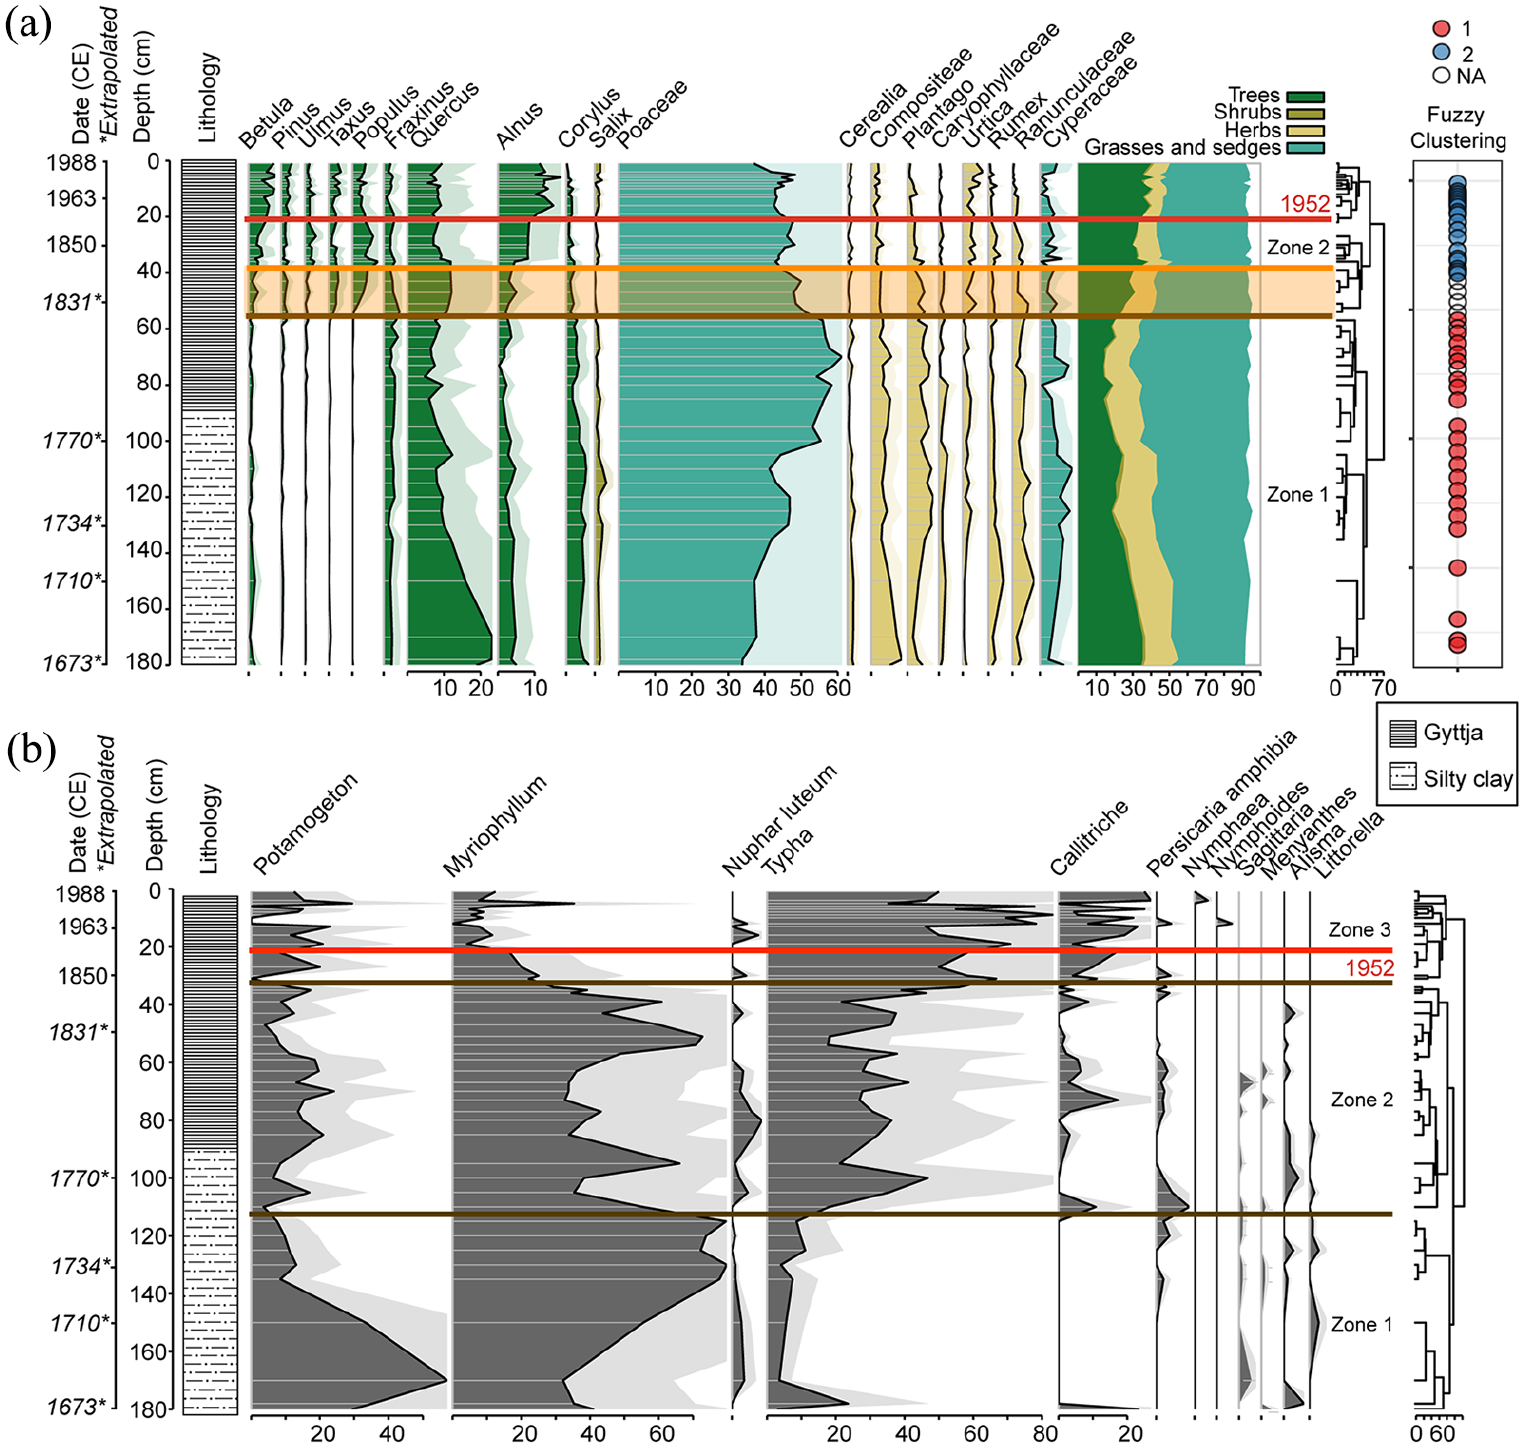
(a) Land plant pollen diagram from Core 31 (re-drawn from David, 1991) showing the top 180 cm of the core with taxa greater than 2% total land pollen (TLP). Brown horizontal line (57 cm) shows pollen assemblage zone change through hierarchical clustering. Orange shaded horizontal bar and line (37 cm) shows a soft boundary of pollen assemblage change produced by fuzzy clustering. (b) Aquatic plant pollen diagram from Core 31 showing the top 180 cm of the core (re-drawn from David, 1991) with brown lines showing pollen assemblage zone change based on CONISS clustering. For both (a) and (b), the dating is correlated from Core 24 to Core 31 via pollen, and further extrapolated through the core using sediment accumulation rates (David, 1991). The red line approximates the inferred stratigraphic level of the 1952 CE boundary for the base of an Anthropocene series proposed by Waters et al. (2023, 2024a, 2024b). Exaggeration curves have been added with silhouettes to highlight changes.
Core GR95b, diatoms and chironomids
The diatom record shows changes in species composition (Figure 9) linked to the progression of eutrophication (Sayer, 2001). The lower section of the core is dominated by benthic Fragilaria species as commonly found in shallow, alkaline, plant-filled lakes. At 44 cm (mid-1800s) there is a decrease in Fragilaria and a marked increase in planktonic diatoms, namely Cyclostephanos dubius and Stephanodiscus parvus. The rise of the plankton and of these two species in particular is a clear indication of eutrophication (e.g. Bradshaw and Anderson, 2003; Reavie and Cai, 2019), likely linked to agricultural fertiliser use in the catchment (Sayer et al., 1999). This change in diatom assembly also coincides with an increase in δ15N values from the early 1800s to the 20th century (Figure 5), providing further evidence of nutrient-enrichment from the mid-19th century onwards.
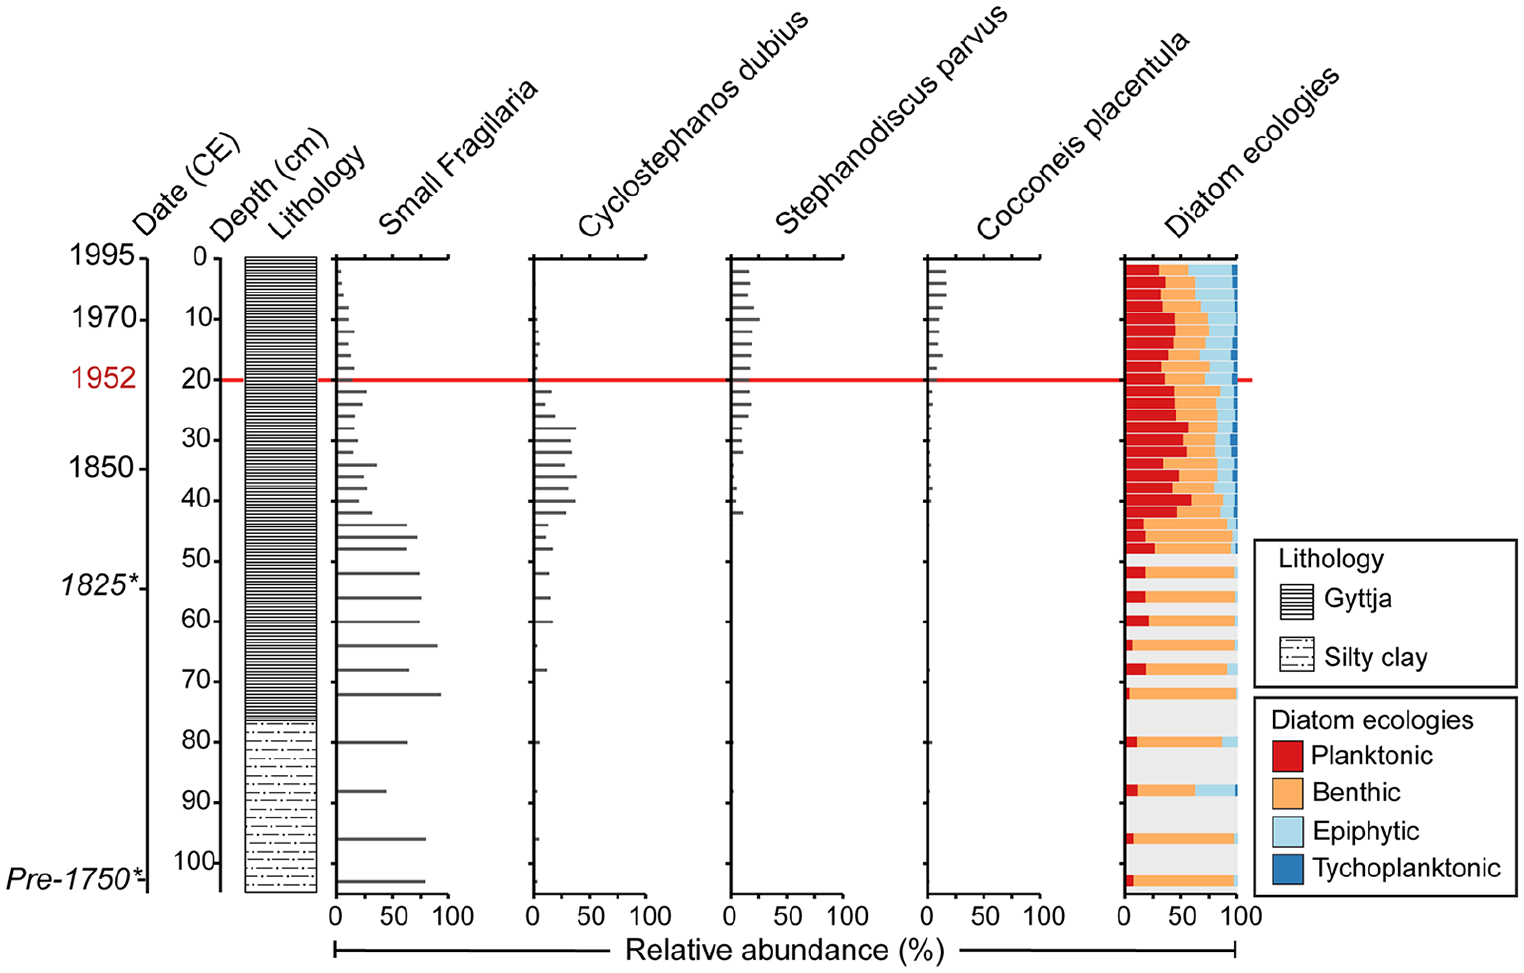
Diatom stratigraphy from core GR95b, including lithology to show sediment change (re-drawn from Sayer, 1997). The dating is correlated from Core 24 and Core 31 via LOI550 (see Sayer, 1997) and extrapolated using sediment accumulation rates (italics and asterisk). The red line approximates the inferred stratigraphic level of the 1952 CE boundary for the base of an Anthropocene series proposed by Waters et al. (2023, 2024a, 2024b).
Above 29 cm, C. dubius starts to decrease as S. parvus expands, which coincides with the change in aquatic flora found in the pollen record (David, 1991). Cocconeis placentula, an epiphytic diatom, increases above 20 cm (~early 1950s). This has previously been explained by enhanced grazing pressure on plant-periphyton by grazing invertebrates in turn the result of reduced fish predation (Bennion et al., 2015).
Cores GROB2, GROB4 and GROB5 biological signals
From the 1800s onwards, changes can be seen in all biological groups in the GROB cores, signalling the gradual shift towards taxa typically associated with a eutrophic lake environment (Figure 10). Plant fossils indicate a loss of aquatic plant diversity and shifts towards more nutrient-tolerant species, zooplankton and diatoms show a change from benthic dominated taxa to more planktonic forms, and chironomids exhibit a decline in plant-associated taxa, as Groby Pool became progressively more eutrophic. The timing of the initial shifts in the early 1800s (Zone 1 and 2) coincides with the change of lithology from silty clay to gyttja, highlighting land use changes in the Groby Pool catchment, and the increased use of phosphorus fertilisers in agriculture (Sayer, 1997). The second major change across all biological groups occurs at around the 1930–1940s (Zone 2 and 3) and signals a further phase of enrichment (Figure 10). This coincides with the construction of a sewage works at the nearby Markfield Hospital upstream of Groby Pool in 1935 CE, which discharged into the lake (Sayer, 1997). Therefore, over the last 200 years, both diffuse and point sources of nutrients have contributed to the eutrophication of the lake.
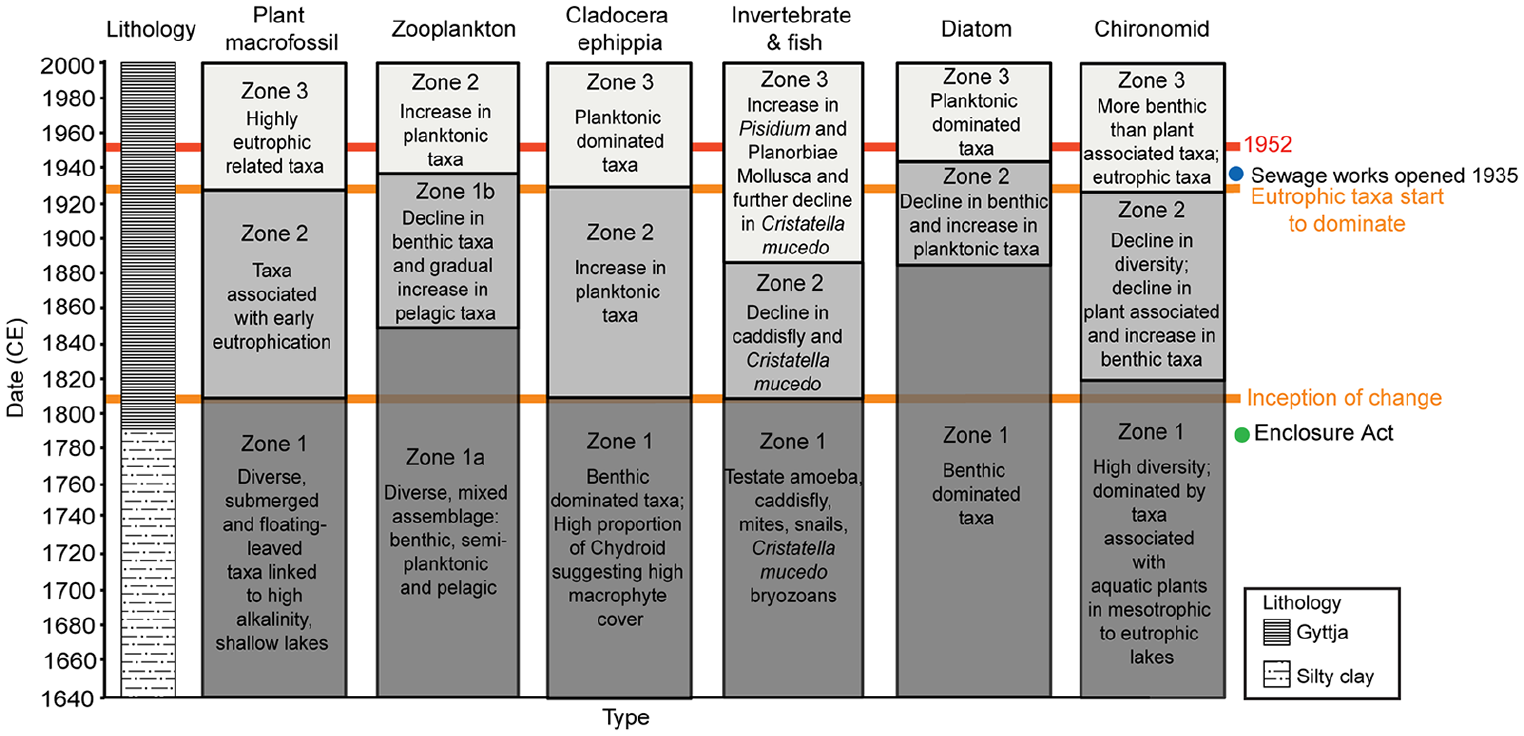
Comparison of biozone changes for different taxa produced by CONISS clustering analysis of GROB2, GROB4 and GROB5 (Bennion et al., 2015). Sediment change (from silty clay to gyttja) approximates the biozone 1–2 transition, linked to changes in catchment land use. The red line approximates the inferred stratigraphic level of the 1952 CE boundary for the base of an Anthropocene series proposed by Waters et al. (2023, 2024a, 2024b). The orange lines indicate general biozone change from inception of change to becoming dominated by eutrophic-related taxa. Dates are SCP-derived from the original study (Bennion et al., 2015).
Non-native species record
Five non-native plant species have been found in fossil pollen and observational plant survey records from Groby Pool and the surrounding area (Figure 11). Castanea (Sweet Chestnut) is present in the Core 31 pollen record in small quantities from approximately the late 16th century, but this species is originally thought to be introduced into Britain by the Romans for food while a study showed that there is no evidence that Castanea was growing in Britain before ~50 CE (Jarman et al., 2019a, 2019b). A row of Castanea trees were planted by Bradgate House (~2.5 km northeast from Groby Pool) at the end of the 16th century, which matches the pollen record, with further planting in walled spinneys in the estate surrounding the house by the 19th century (Forsyth, 1974). Aesculus (Horse Chestnut) appears in the Core 31 pollen record in the mid-18th century, though it is estimated to have been introduced into Britain in the mid-16th century (Howard, 1945). Castanea and Aesculus appear in the description of Abbey Park (~7 km east of Groby Pool) when the park was opened to the public in 1882 CE (Hewitt, 1882). Two non-native Elodea species (E. canadensis and E. nuttalli), which are submerged macrophytes, first appear in Groby Pool plant surveys between 1901 and 1950 CE and were both recorded as abundant between 1951 and 1990 CE. These species are widely associated with eutrophic waters (Søndergaard et al., 2010). These species are not present in the pollen record as they mostly reproduce vegetatively in the UK due to a rarity of male plants (Preston and Croft, 1997). Larix decidua was introduced into Britain in the late 1600s for timber production (Samuel, 2007) and can be found in the Core 31 fossil pollen record from the early-19th century. Its source is likely to be trees further away in the region as the pollen is in small quantities and a Larix plantation (with Pinus sylvestris) was not established near to Groby Pool until the mid-20th century (David, 1991).
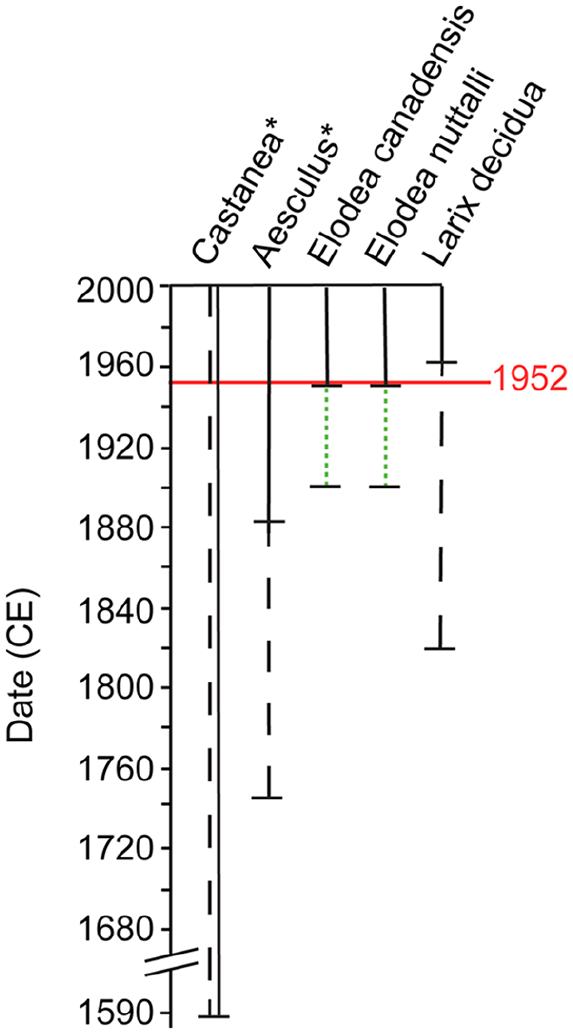
Chronology of observational records of non-native species are plotted with solid black lines and the dotted green lines in the Elodea species show a 50-year period of first appearance as the exact year is unknown (Hewitt, 1882; Leicestershire and Rutland Environmental Records Centre (LRERC), 2023; Sayer, 1997). Dashed lines indicate presence in the Groby Pool Core 31 fossil pollen record (David, 1991) extending the record from observational data. Asterisked names show plant observational records (solid lines) from Bradgate Park (~2.5 km northeast of Groby Pool) for Castanea (which coincides with the timing of the appearance of this pollen in the Groby Pool record) and Abbey Park (~7 km east of Groby Pool) for Aesculus with pollen records from Groby Pool (dashed lines). Non-asterisked names appear in plant surveys surrounding Groby Pool. The red line approximates the inferred stratigraphic level of the 1952 CE boundary for the base of an Anthropocene series proposed by Waters et al. (2023, 2024a, 2024b). The dating for the pollen record is correlated from Core 24 to Core 31 via pollen, and further extrapolated through the core using sediment accumulation rates (David, 1991).
Discussion
The stratigraphical signature of change in Groby Pool is complex and records sustained landscape evolution over several centuries and a series of local and global events therein. Here we examine these in the context of defining the stratigraphical Anthropocene.
The episode of local landscape evolution and its impacts on the lake
Pastoral and arable indicators are constant in the Leicestershire landscape, even prior to the mid-17th century, which highlights continuous human influence over a long period of time. Leases from 1757 CE written by the Earl of Stamford show evidence of the idea of enclosure, followed by the UK Government’s Act of Enclosure becoming official in Leicestershire in ~1789 CE, consolidating land ownership into a small percentage of the population and enabling the intensification of agriculture (Williamson, 2000; Woodward, 1984). The impacts of the Enclosure Acts unfolded over several centuries as part of the episode of local landscape change notable in the decline of woodlands and replacement by open habitat, as seen in the Groby Pool pollen record. From the early 1800s up until the mid-1900s, tree pollen (oak, poplar, pine, birch, yew and alder) increased in the Groby Pool records indicating another ‘episode’ of local change, during which time there was an increase in tree planting in Leicestershire for timber production, as well as game shooting (Squires and Jeeves, 1994). This includes an increase in alder at 20 cm in Core 31 which is linked to the growth of an alder carr woodland near Groby Pool in the 1930s (David and Roberts, 1991).
With respect to the lake ecology, most biotic change occurred prior to the proposed mid-20th century Anthropocene boundary, linked to anthropogenic influence and long-term eutrophication development. A reduction in aquatic plant diversity, and major shifts in several components of the food web towards taxa associated with more nutrient-rich conditions can be seen from the early 1800s, most likely reflecting agricultural change following the Enclosure Acts. The increase in δ15N from the early 1800s CE to the late 1990s also supports the biological data, indicating an early phase of eutrophication driven by an increase in the use of fertiliser. Similar timescales of eutrophication, dating to the early to mid-19th century, have been reported for other lakes in the UK (Bennion et al., 2011; Haworth et al., 1996) and across Europe (Battarbee et al., 2011), particularly linked to agricultural intensification (O’Sullivan, 1992; Ulén et al., 2007). Hence, it could be argued that there is a regional stratigraphical signal, or indeed a global signal of eutrophication in lakes from approximately this time (Battarbee et al., 2011; Hampton et al., 2018; Jenny et al., 2020). However, there is no clear biostratigraphical pattern in the Groby Pool palaeoecological record that defines the mid-20th century concept of the Anthropocene (sensu Waters et al., 2023). There is, for example, no clear biotic signal of non-native species, which has been used to bracket a mid-20th century Anthropocene in other regions (e.g. Williams et al., 2022), including in several of the sites studied by the AWG (Waters et al., 2023 and references therein). There is also no clear mid-20th century signal of the global changes to lakes resulting from the intensification of hinterland agriculture and eutrophication that is documented elsewhere (Hampton et al., 2018). In the case of Groby Pool, changes to the Leicestershire landscape and rapid population growth had largely occurred prior to the Great Acceleration of the 20th century (Steffen et al., 2015).
While the Groby Pool palaeoecological record reflects an episode of change in the Leicestershire landscape over a century and more, some of the changes are indicative of local, shorter timescale events. Aquatic plants, diatoms and zooplankton show assemblage change after the sewage works near Markfield Hospital became operational upstream in 1935 CE, providing evidence for a second phase of eutrophication derived from a nutrient point source (Sayer, 2001). Notably, after ~1930 CE, planktonic taxa (e.g. for diatoms and cladocerans) further increase in the lake as eutrophication progressed. This shift from predominantly benthic to planktonic pathways in lakes is typically seen with shallow lake enrichment (Vadeboncoeur et al., 2003).
Regional and global events identifying stratigraphical markers
There is regional variation in the appearance of SCPs in the stratigraphical record (Rose, 2015; Rose and Appleby, 2005), but when combined with other stratigraphical data, SCPs are highly useful in helping to characterise mid-20th century deposits (Waters et al., 2023 and references therein). The high-resolution of the GROB1 record shows an increase in SCP concentrations from the mid-20th century, with peaks in the ~1970s, similar to Core 24. The low-resolution record of GROB2, GROB4 and GROB5 show less well constrained mid-20th century rises and highlights the importance of a high-resolution record to capture the increase. The signature compares with data from other English sites near industrial areas. Edgbaston Pool in Birmingham, with a long industrial history, has an acceleration in SCPs from 1944 CE and peaks in the 1970s. Agden Reservoir, nearby to the industrial cities of Sheffield and Manchester also has a similar SCP profile with the acceleration from the mid-20th century, as also seen in other reservoirs in the Pennines (Shotbolt et al., 2006). This is consistent with other lakes in the UK and worldwide, which, like Groby Pool, record the SCP acceleration from ~1950 CE driven by the introduction of fuel-oil combustion to meet the growing demand for electricity (Rose, 2015).
The mid-20th century rapid increase in SCP concentrations is useful for stratigraphies at sites across the world while other features of SCP profiles show regional variation from the local history of industrialisation (Rose, 2015). GSSP candidate sites studied by the AWG show a similar pattern with a rapid increase from the mid-20th century, such as the Śnieżka peatland in Poland, Silhailongwan Maar Lake in China, and Crawford Lake in Canada (Fiałkiewicz-Kozieł et al., 2023; Han et al., 2023; McCarthy et al., 2023). Groby Pool is analogous to these sites by showing the mid-20th century acceleration.
As the half-life of 137Cs is ~30 years, its record is a useful mid-20th century marker in core analyses in sediments taken in earlier studies, and when sediment accumulation rates are relatively high. In Groby Pool, the rapid rise of 137Cs is interpreted to be in the 1950s in Core 24 and GROB1, which aligns with the SCP and Pb signatures, followed by peaks in 137Cs indicating the 1963–1964 CE nuclear weapons fallout maximum, and a later peak from the Chernobyl disaster of 1986 CE. The profile of the 137Cs curve and its early peak is most similar to that of Sihailongwan Maar Lake, China, which provides a chain of correlation to the proposed Crawford Lake GSSP (Han et al., 2023; McCarthy et al., 2023) and thereby to other sites studied by the AWG (e.g. Fiałkiewicz-Kozieł et al., 2023; Stegner et al., 2023). The 1986 CE 137Cs peak, linked to the Chernobyl disaster, shows a regional ‘event’ as it can be found in other European sites (Röllin et al., 2022), including Śnieżka peatland (Fiałkiewicz-Kozieł et al., 2023).
At Groby Pool, there is an increase in Pb from the mid to late 20th century, which may be linked to fossil fuel combustion and industrial processes nearby as recorded in other sites in Europe, such as the Śnieżka peatland with Pb concentrations increasing from 1950 CE (Fiałkiewicz-Kozieł et al., 2023; Gałuszka et al., 2019; Marx et al., 2016). Cd shows a significant increase in GROB1 from the mid-1960s to a peak towards the top of the core around the late 1990s. Great Pool in Droitwich (Figure 1) shows a rise in Cd in the 1970s, with a sharp increase in the mid-1990s, similar to Groby Pool which is likely linked to local industry, such as non-ferrous metal production and waste treatment (Pacyna and Pacyna, 2001; Yang and Rose, 2005b).
Conclusion
The palaeoecological, sedimentological and geochemical record of Groby Pool records a prolonged ‘episode’ of landscape evolution over several centuries, together with a long-lived record of industrialisation over more than 150 years in the birth-area of the Industrial Revolution. Despite a range of complex stratigraphical signals and variable quality 210Pb dating, mid-20th century stratigraphical signals are clear in the historical 137Cs data and the SCPs record, which enable identification and global correlation of an Anthropocene succession in Groby Pool with numerous sites around the world. This study highlights how global signatures can be identified alongside and be separated from regional and local signals and supports those of Rose (2015) and Swindles et al. (2015) in identifying SCPs as a key marker of the Anthropocene. This paper also demonstrates that existing multi-proxy datasets can be re-examined in the context of the Anthropocene. We note that Groby Pool provides independent support for the wider recognition and utility of an Anthropocene interval beginning in the mid-20th century (Waters et al., 2023, 2024a, 2024b), even if it is used as an informal chronostratigraphical unit.
Supplemental Material
sj-docx-1-anr-10.1177_20530196241306407 – Supplemental material for A mid-20th century stratigraphical Anthropocene is recognisable in the birth-area of the industrial revolution
Supplemental material, sj-docx-1-anr-10.1177_20530196241306407 for A mid-20th century stratigraphical Anthropocene is recognisable in the birth-area of the industrial revolution by Hannah Sellers, Mark Williams, Juan Carlos Berrio, Stef De Sabbata, Neil L Rose, Simon D Turner, Handong Yang, Helen Bennion, Carl D Sayer, Neil Roberts, Amy Wrisdale and Marco A Aquino-Lopez in The Anthropocene Review
Footnotes
Acknowledgements
We thank Thomas Davidson (Aarhus University) for providing palaeoecological data from published studies. We also wish to acknowledge the detailed and rigorous work of Carol David (formerly Loughborough University) at Groby Pool in the late 1980s and early 1990s. Mark Williams, Neil Rose and Simon Turner are members of the Anthropocene Working Group.
Funding
The author(s) disclosed receipt of the following financial support for the research, authorship, and/or publication of this article: This work is funded through a University of Leicester College of Science and Engineering PhD studentship to Hannah Sellers.
Supplemental material
Supplemental material for this article is available online.
References
Supplementary Material
Please find the following supplemental material available below.
For Open Access articles published under a Creative Commons License, all supplemental material carries the same license as the article it is associated with.
For non-Open Access articles published, all supplemental material carries a non-exclusive license, and permission requests for re-use of supplemental material or any part of supplemental material shall be sent directly to the copyright owner as specified in the copyright notice associated with the article.