
Abstract
This paper conducts a detailed quantitative study of the indicated long-term levels, nature and dynamics of sustainability at the global spatial scale over time, within the context of the vulnerability of the environment-human relationship and system. In this study, the Sustainability Dynamics Framework is applied to the results of the Notre Dame Global Adaptation Initiative index for the period 1995–2018. The study indicates that the obtained
Keywords
Introduction
Overview
The Earth System consists of the two fundamental planetary spheres of the environment/ecosphere and the anthroposphere (human society, activities and needs). These operates as a complex coupled dynamic system and relationship at all spatial-temporal scales. This simply means that the environment and the anthroposphere at all spatial-temporal scales interacts, influences and impacts within themselves and upon one another to differing degrees of significance, intensity and magnitude.
The Earth System is currently in the geological epoch of the Anthropocene (Crutzen, 2002; Crutzen and Stoermer, 2000; Steffen et al., 2007; Waters et al., 2016; Zalasiewicz et al., 2008). This epoch reflects the fundamental impacts and influences that the anthroposphere at all spatial-temporal scales have had, and are having, upon the operations and processes of the environment/ecosphere at all spatial-temporal scales.
The nature and operation of the Earth System, both conceptually and in reality, is a mainstream theme of current research and literature. Therefore, in order to have a fundamental understanding of the Earth System, it is necessary and appropriate to have an understanding of what is meant by the environment/ecosphere and the anthroposphere.
Defining the environment
The components of the environment (aka the ecosphere) are generally agreed as consisting of the primary planetary sub-spheres of the atmosphere, biosphere, hydrosphere, 1 and the lithosphere (e.g. Boumans et al., 2002; Gaffney and Steffen, 2017; Lovelock, 1972, 1988, 2009, 2016; Lovelock and Margulis, 1974; NASA, 1986; Phillips, 2010, 2020; Rockström et al., 2009; Rotmans et al., 1990; Schellnhuber, 1998, 1999, 2001; Smith et al., 2020). Within these four primary planetary sub-spheres are sub-systems of various levels of complexity—for example, plate tectonics, hydrological cycle, glaciers; climatic zones, erosion and weathering, carbon cycle, nitrogen, cycle, soil formation, ecological niches etc. Critically, all of the four primary sub-spheres and their component sub-systems are interconnected and interdependent upon each other for their operation and well-being. Disruptions, degradation and/or destruction within a sub-system can and often results in impacts and feedbacks upon the other environmental sub-systems and reciprocal impacts upon the anthroposphere.
Defining the Anthroposphere
The anthroposphere can be defined as the part of the Earth System which has been made or modified by humans (Kuhn and Heckelei, 2010). Therefore, it fundamentally represented all of human society, activities and needs at all spatial-temporal scales. As a result, the anthroposphere is multi-faceted reflecting the different aspects and stages of development of humans over time. However, the anthroposphere tends to be represented within the literature by a specific component or combination of components in defining and evaluating human-based activities and/or behaviours, and their influence and impacts. This is dependent upon whether a reductionist or holistic perspective is adopted. It should also be noted that unlike in the case of other species, humans tend to be more individualistic in nature and character, as noted for example by Quilley (2011), Sturm (2020), Bossel (1996), Morrow (2017), Gumilev (1973) and Muntean (2020). This is influenced by their upbringing, life experiences, societal norms and characteristics etc., and based upon the human characteristics of, for example: free will; desire to progress and thrive; the ability to innovate, develop and advance; and the ability to communicate and choose through rational and sophisticated means. It is therefore commonplace within the literature for the anthroposphere to be conceived, assessed, or modelled in respect to specific activities, behaviours and/or needs.
The anthroposphere can consequently be considered as any and all aspects of human society, activities and needs at any specified spatial-temporal scale, including its outcomes, influences and impacts upon itself or on the environment. The components of the anthroposphere would therefore include: population; economic activities and needs; resource extraction & use; production & consumption (societal and economic); politics & governance; equity and equality; energy production and consumption; pollution; housing; welfare; degradation and destruction (environmental and anthropospheric); culture & heritage; employment; science and technology; poverty; infrastructure; transportation; norms, behaviours and attitudes (individual and collective); waste generation, storage and recycling; agriculture; war and conflicts; education; law and justice; peace; quality of life; health and well-being (physical, mental, emotional and spiritual) etc. (e.g. Alcamo, 1994; Boumans et al., 2002; Donges et al., 2017a, 2017b; Forrester, 1971; Gaffney and Steffen, 2017; Meadows et al., 1972, 1992, 2004; Pearce and Atkinson, 1998; Phillips, 2010, 2020; Schellnhuber, 1998, 1999, 2001; United Nations, 2015; World Commission on Environment and Development [WCED], 1987).
Defining the earth system
The Earth System has been referred to within the literature by the following alternate terms: (i). ‘coupled human-environment systems’ (CHES) or ‘coupled human and natural system(s)’ (CHANS) (e.g. An et al., 2014; Ferraro et al., 2019; Liu et al., 2007; Wang et al., 2018); (ii). ‘socio-ecological system(s)’ (SES) (e.g. Banos-González et al., 2016; Domptail and Easdale, 2013; Gotts et al., 2019; Martínez-Fernández et al., 2021; Ostrom, 2009); (iii). ‘human-environment systems’ (e.g. Bauch et al., 2016; Manson, 2008; Mehren et al., 2018; Stokols et al., 2013; Turner et al., 2003; or (iv). ‘environment-human system(s)’ (e.g. Gechter and Fass, 2018; Kassaye et al., 2022; Phillips, 2020; Verstraete et al., 2011; Vladimirovna-Bakaeva et al., 2017). Irrespective of how the Earth System may be referred to, it is fundamentally the coupled dynamic system and relationship between the environment and the anthroposphere.
The fundamental definitions of the Earth System and its component sub-systems outlined are extremely abstract in nature, and which does belie its true complexities as a coupled dynamic system and the co-evolutionary relationship between the environment and the anthroposphere. Defining the dynamics of the Earth System in order to understand the interactions and relationship between the environment and the anthroposphere has been a major theme within the literature, particularly in respect to the Anthropocene. At the most fundamental level, both Schellnhuber (1998) and Gaffney and Steffen (2017) have sought to mathematically define the changing and current dynamics of the Earth System over time. In respect to Schellnhuber (1998) and his work on Earth System Analysis theory, he describes the present-day dynamic relationship as follows:


The ecosphere (
Gaffney and Steffen (2017), also influenced by Schellnhuber’s work, were more direct in expressing the dynamic relationship of the Earth System in the Anthropocene, which they stated as follows:
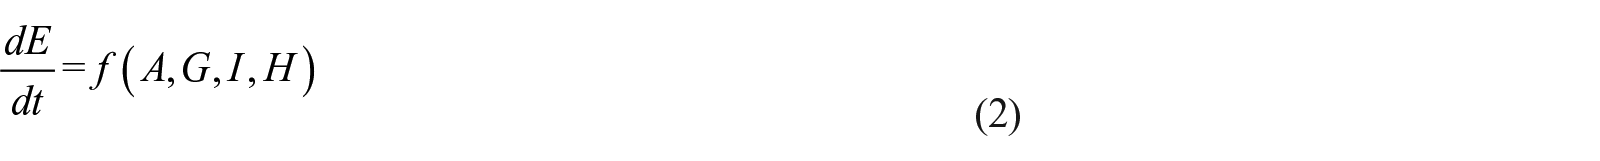
(i). The rate of change of the Earth System (dE/dt) before and upto the Anthropocene, (E) was:
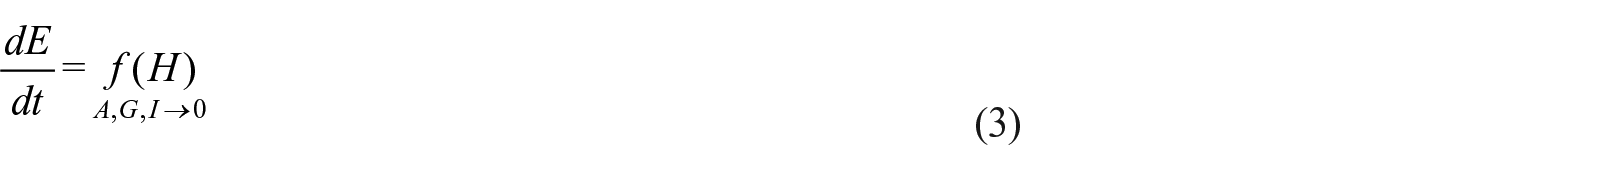
(ii). dE/dt since the beginning of the Anthropocene has been:
Where H, based on Hibbard et al. (2006) can be defined as:

and

I – Internal dynamics of the Earth system; H - Human activity; P - Population; C - Consumption; T – Technology; En - Energy; K - Knowledge; Pe - Political Economy
Gaffney and Steffen (2017) stated that in respect to equation (3) which can be termed as the ‘Anthropocene Equation’, H has become the dominant driving force in the rate of change of the Earth System (dE/dt), succeeding the natural forces of A, G, I as shown in equation (2). The relevance and importance of these equations of Schellnhuber (1998) and Gaffney and Steffen (2017) shall become clear later in the paper, in respect to the Sustainability Dynamics Framework (re: Phillips, 2020).
Another common approach in Earth System conceptualization is the use of adaptive system theory, typically in respect to the use of cycles and loops to illustrate and demonstrate the operational processes, influences, impacts and feedbacks occurring (e.g. Abram and Dyke, 2018; Donges et al., 2017a, 2021a, 2021b; Holling, 2001; Wang et al., 2018). A simple example of a feedback loop between two Earth System subsystems was provided by Donges et al. (2021a) as A → B and B → A, and which can be consequently described as A ↻ B. A more complex interaction loop between subsystems was exemplified by Donges et al. (2021a) as A → B → C → A, which results in 11 possible feedback loops occurring. These two examples are relatively simplistic in nature, but do adequately illustrate the basic principles of adaptive system theory in relation to the conceptualization and evaluation of the Earth System. And yet, it is not only the conceptualization of the nature and dynamics of the Earth System which is a main theme of the current literature. It is also how the current nature and dynamics of the Earth System influences, impacts and assessed in respect to vulnerability and sustainability.
Evaluating vulnerability
Vulnerability was defined by Turner et al. (2003) as the degree to which the environment–human system is harmed due to its exposure to hazard(s). Turner (2010) states there is a synergy between vulnerability and sustainability, climate change and global environmental change. This is because vulnerability reflects the sensitivity and coping capabilities of either the environment or anthroposphere, and consequently the environment-human system as a whole (Turner, 2010). The literature on vulnerability of environment-human system at a specified spatial-temporal scale is abundant in breadth and scope of approach. Some examples include: the spatial distribution of vulnerability in Liupan mountain region, China (Han et al., 2020); index of social system’s vulnerability to ecosystem services changes at the local scale (Berrouet et al., 2019); country-based index assessment of social-ecological status (Estoque and Murayama, 2017); and vulnerability assessment of ecosystem services to changes in land use (Metzger et al., 2006).
Conceptualizing and evaluating sustainability
In respect to sustainability, then it can be stated the potential issues are more challenging, as there is a multitude of definitions, conceptualizations and applications within the current literature. These are dependent upon whether a reductionist or holistic perspective is adopted, and whether it is qualitative (i.e. word-based/indicators), or quantitative (i.e. mathematical/numerical) in nature. Therefore, this potentially gives four basic categories of how sustainability can be conceptualized and assessed – Reductionist-Qualitative; Reductionist-Quantitative; Holistic-Qualitative; and Holistic-Quantitative. With this in mind, Table 1 shows some examples of the current literature using the four categories stated.
Some categorized examples of the current literature on sustainability concepts and applications.
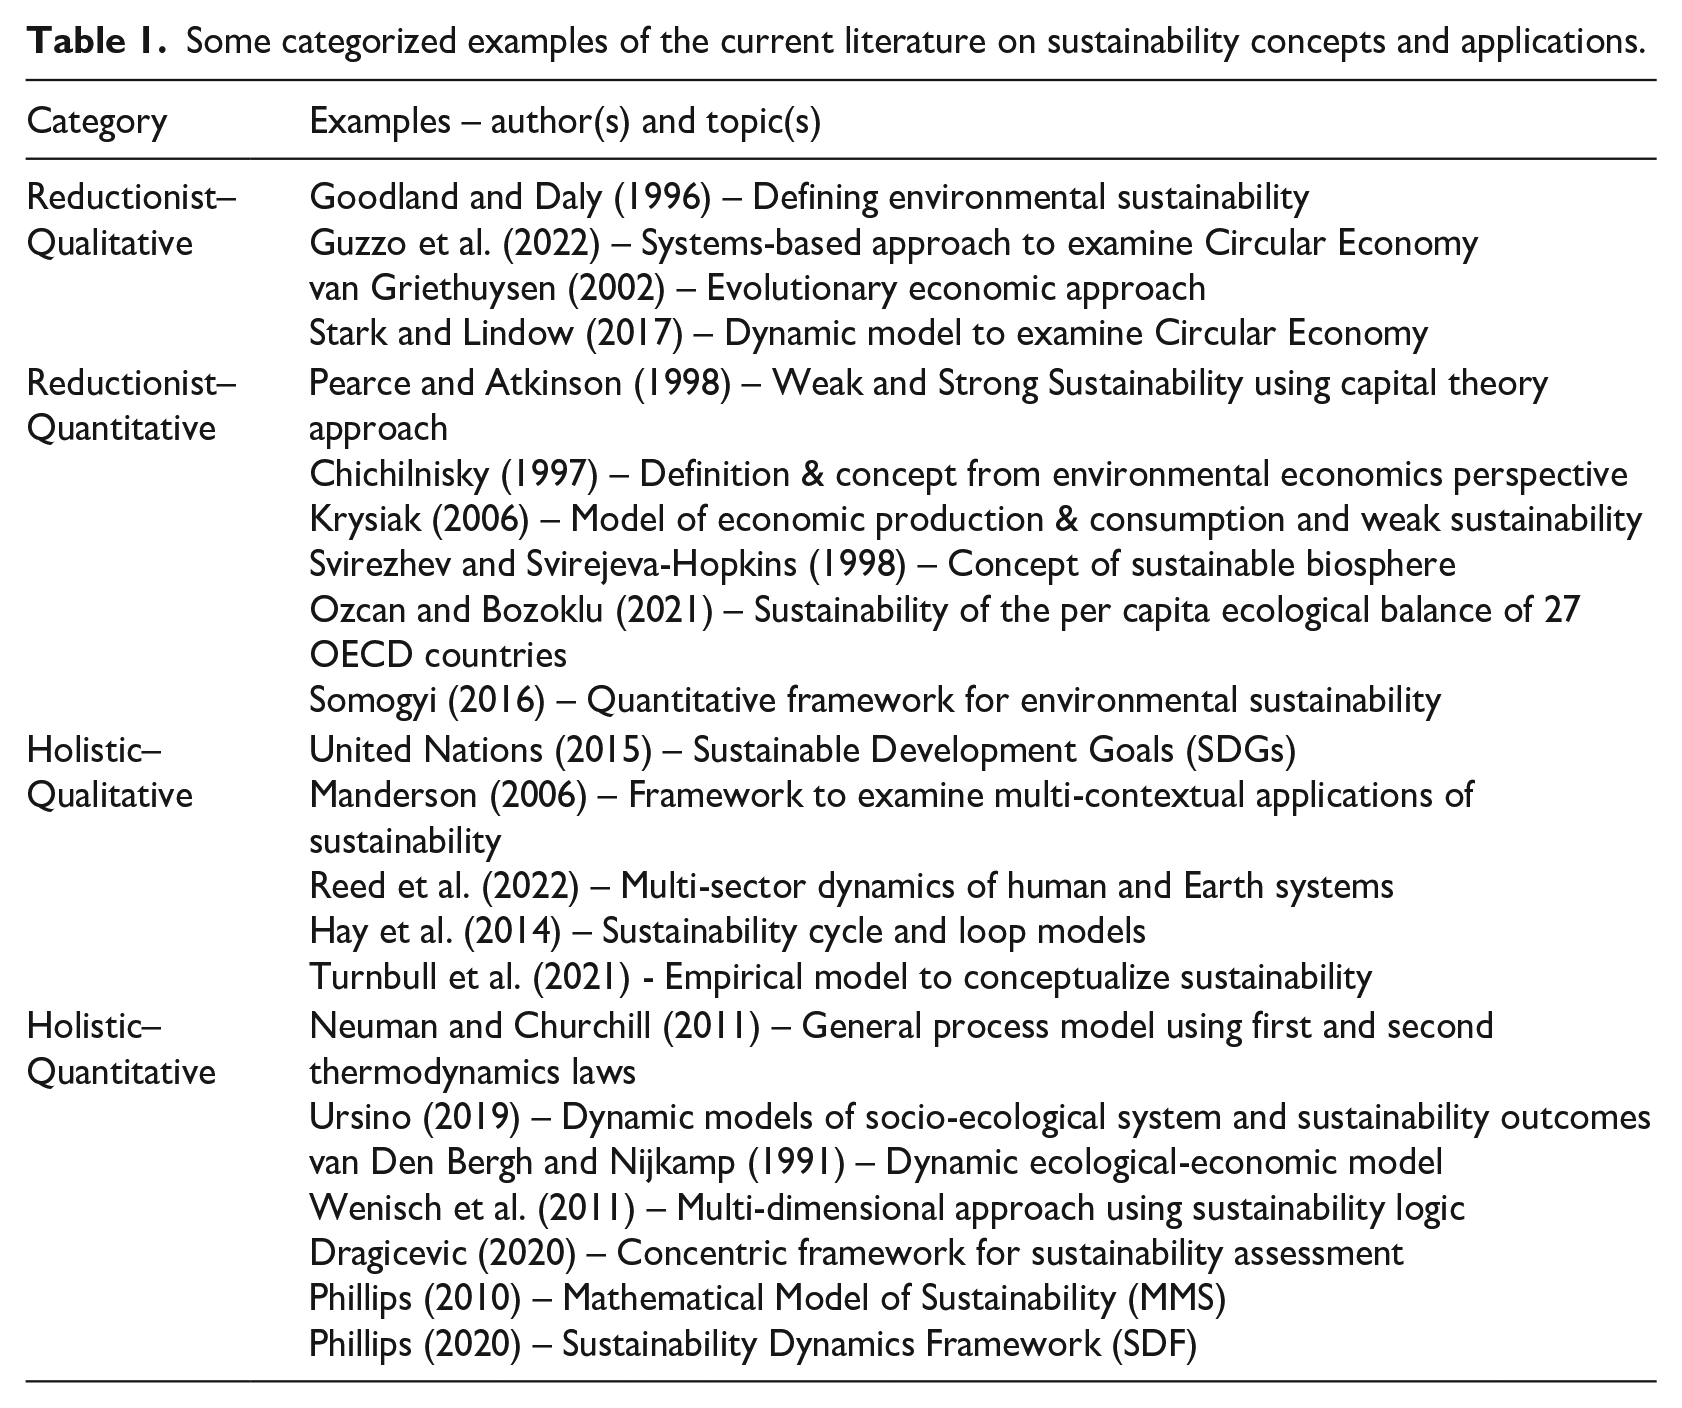
In respect to Table 1, two of the stated concepts are relevant in respect to the later application of the Sustainability Dynamics Framework (SDF) – these are the Rules of Weak and Strong Sustainability (Pearce and Atkinson, 1998) and the Mathematical Model of Sustainability (MMS) (Phillips, 2010, 2015, 2016). In respect to the MMS, this will be addressed in more detail in the Methodology section in specific regard to the operationalization of the SDF. In relation to the Rules of Weak and Strong Sustainability (RWSS) developed by Pearce and Atkinson (1998), these are a set of fundamental mathematical rules to define weak and strong sustainability using the capital theory approach, which originated from the economics-based disciplines.
Total capital (K) consists of two fundamental types: (i). natural; and (ii). anthropogenic. Natural capital (KN) are resources which are either renewable or non-renewable in nature, and which reflects the goods and services produced and consumed, and their by-products necessary to support human life. Anthropogenic capital (KA) was a term developed by Phillips (2020) in developing the Sustainability Dynamics Framework, which assimilates and consists of the three human-based capital components defined by Pearce and Atkinson (1998) – human (KH – i.e. labour), manufactured (KM – i.e. tools, machines, buildings, infrastructure etc.), and social (KS – i.e. education, culture and knowledge etc.).
At the highest level of abstraction, the level of flow from natural capital to anthropogenic capital (KN → KA), in the form of resources and services, consequently determines whether weak or strong sustainability occurs. The mathematical rules of weak and strong sustainability, based on the flow of capital is shown in Figure 1.
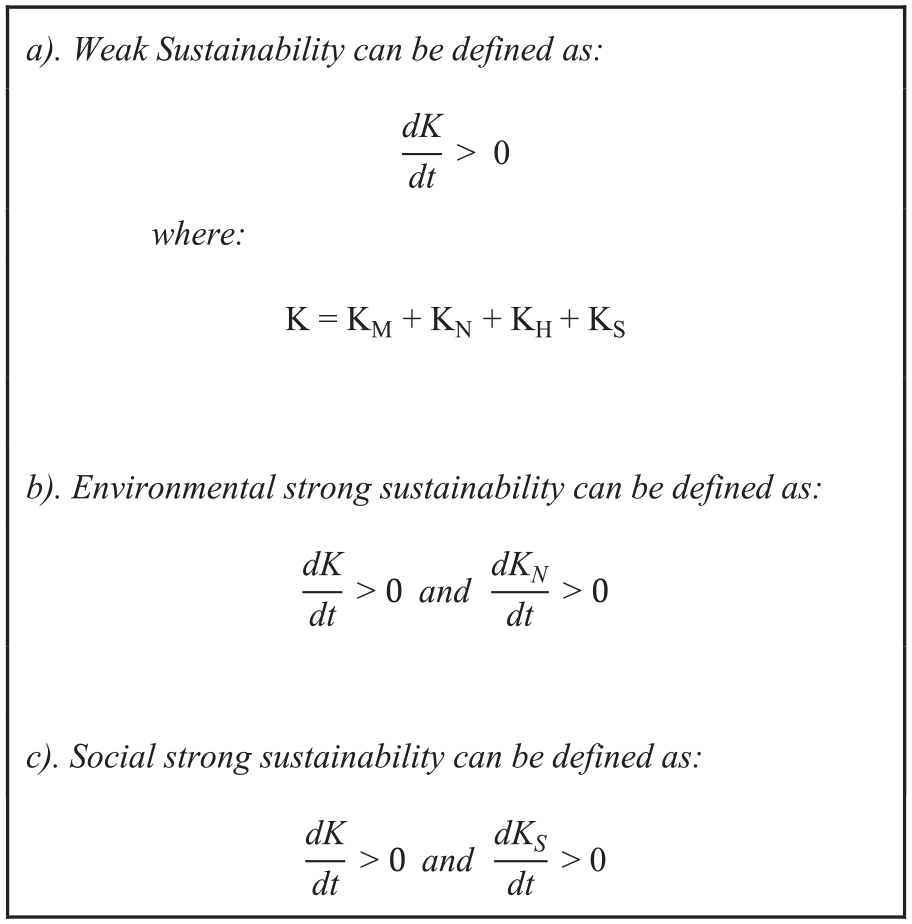
The rules of weak and strong sustainability, after Pearce and Atkinson (1998).
Indicators and modelling
In respect to the assessment of vulnerability and sustainability, as well as the Earth System, the most common approaches used are indicators and/or modelling. In relation to Earth System, there is an abundance of models within the literature from general models to specific systemic models. Some examples of Earth System models include: (i) the Earth3 model (Goluke et al., 2018; Randers et al., 2018, 2019), which evaluates potential future scenario-based outcomes of the implementation of the UN Sustainable Development Goals in respect to the Planetary Boundaries framework (Rockström et al., 2009; United Nations, 2015); (ii) The World3 model (Herrington, 2021; Meadows et al., 1972, 1992, 2004; Pasqualino et al., 2015), which is the basis for the Limits to Growth model; (iii) Integrated modelling of the dynamics of ecosystem services, for example, Multiscale Integrated Model of Ecosystem Services (MIMES) (Boumans and Costanza, 2007; Boumans et al., 2015; Oliveira et al., 2022), and the Global Unified Metamodel of the Biosphere (GUMBO) model (Boumans et al., 2002); (iv) the Human and Nature Dynamics (HANDY) model (Motesharrei et al., 2014); and (v) the Analysis, Integration and Modelling of the Earth System (AIMES) approach (Schimel et al., 2015).
In respect to indicators, the Earth System, vulnerability and sustainability have a plethora of indicator-based frameworks available or being developed. Some of the more well-known examples in respect to indicator-based frameworks include: (i) the UN Sustainable Development Goals (SDGs) United Nations, 2015); (ii) Planetary Boundaries (Dearing et al., 2014; Häyhä et al., 2016; Rockström et al., 2009); (iii) the Notre Dame Global Adaptation Initiative (ND-GAIN) index (Chen et al., 2015; University of Notre Dame, 2021); (iv) The Environmental Vulnerability Index (EVI) (South Pacific Applied Geoscience Commission [SOPAC], 2005). Some other examples include: Cochran et al. (2020), Kavvada et al. (2020) and Lehmann et al. (2022), all of which use an earth observations approach for reporting the success in implementing the SDGs; Usubiaga-Liaño and Ekins (2021) who developed a strong environmental sustainability index (SESI) for countries; and Wu et al. (2021) who proposed a planetary boundaries-based approach for evaluating the environmental footprints.
Context and purpose of paper
What the brief discourse of the conceptualization, application and assessment of the Earth System, vulnerability and sustainability has briefly indicated is that there is currently no singular approach which can potentially represent and evaluate the fundamental level(s), nature and dynamics of the Earth System and the co-evolutionary relationship (aka sustainability / unsustainability) at any specified spatial-temporal scale. Furthermore, how and why the vulnerability of the Earth System and co-evolutionary relationship is potentially influenced and impacted upon over time. The use of separate approaches to the question of the outcomes in respect to the Earth System, vulnerability and sustainability has potential significant consequences for all. Specifically, separate bespoke approaches can lead to disjointed understanding, policy and management occurring, as there is a failure to account for the integrated and complex nature of the environment-human system and relationship at any specified spatial-temporal scale. Therefore, whilst it is generally accepted within the literature that the Earth System, vulnerability and sustainability are dynamically integrated; there is however very little within the literature which directly determines and evaluates all of these adopting a consistent and holistic quantitative approach. It is for the reasons stated that this paper has been developed to potentially contribute towards advancing knowledge on the fundamental and critical questions and issues outlined in respect to the global spatial scale.
Therefore, this paper determines and evaluates the indicated long-term levels, nature and dynamics of sustainability at the global spatial scale. This is contextualized in respect to the vulnerability of the environment-human system. Consequently, the objective of this study to provide a detailed understanding of the indicated long-term nature of the global environment-human relationship, and its potential and actual impacts and consequences. The intended outcome of the study is to advance understanding of the indicated levels, nature and dynamics of the global environment-human system and relationship in the Anthropocene, in respect to long-term sustainability and vulnerability. Furthermore, it is the study’s intention to further advance and contribute towards the development of a conducive and meaningful global co-evolutionary environment-human relationship and system.
By the approach adopted in this study, it is intended to further contribute towards the fulfilment of the observation of Phillips (2010, p127) that: ‘The crux of sustainable development is the understanding of the fundamental dynamic relationships between the environment and human’. Therefore, how humanity influences and impacts upon the environment at the global spatial scale, consequently determines the nature and potential outcomes of the global environment-human relationship over time.
Methodology
Overview
This study adopts a revised methodology based on Phillips (2022), in order to apply the Sustainability Dynamics Framework (SDF) (Figures 2–4; re: Phillips, 2020). The SDF is a holistic conceptual and operational framework which evaluates two fundamental aspects of sustainability at any specified spatial-temporal scale(s). These are: (i). the obtained indicated level(s) and nature of sustainability (S) occurring within a defined S-value range of [−1.000 = S = +1.000]; and (ii). the potential influences and interactions occurring upon sustainability (based on Phillips, 2020, 2022). As Phillips (2020) states, the SDF achieves this by mathematically integrating and expanding upon four environment-human system and relationship theories - These are: (i). Rules of Weak and Strong Sustainability (RWSS) (Pearce and Atkinson, 1998); (ii). Earth System Analysis (ESA) (Schellnhuber, 1998); (iii). the Anthropocene Equation (AE) (Gaffney and Steffen, 2017); and (iv). the Mathematical Model of Sustainability (MMS) (Phillips, 2010, 2015, 2016).
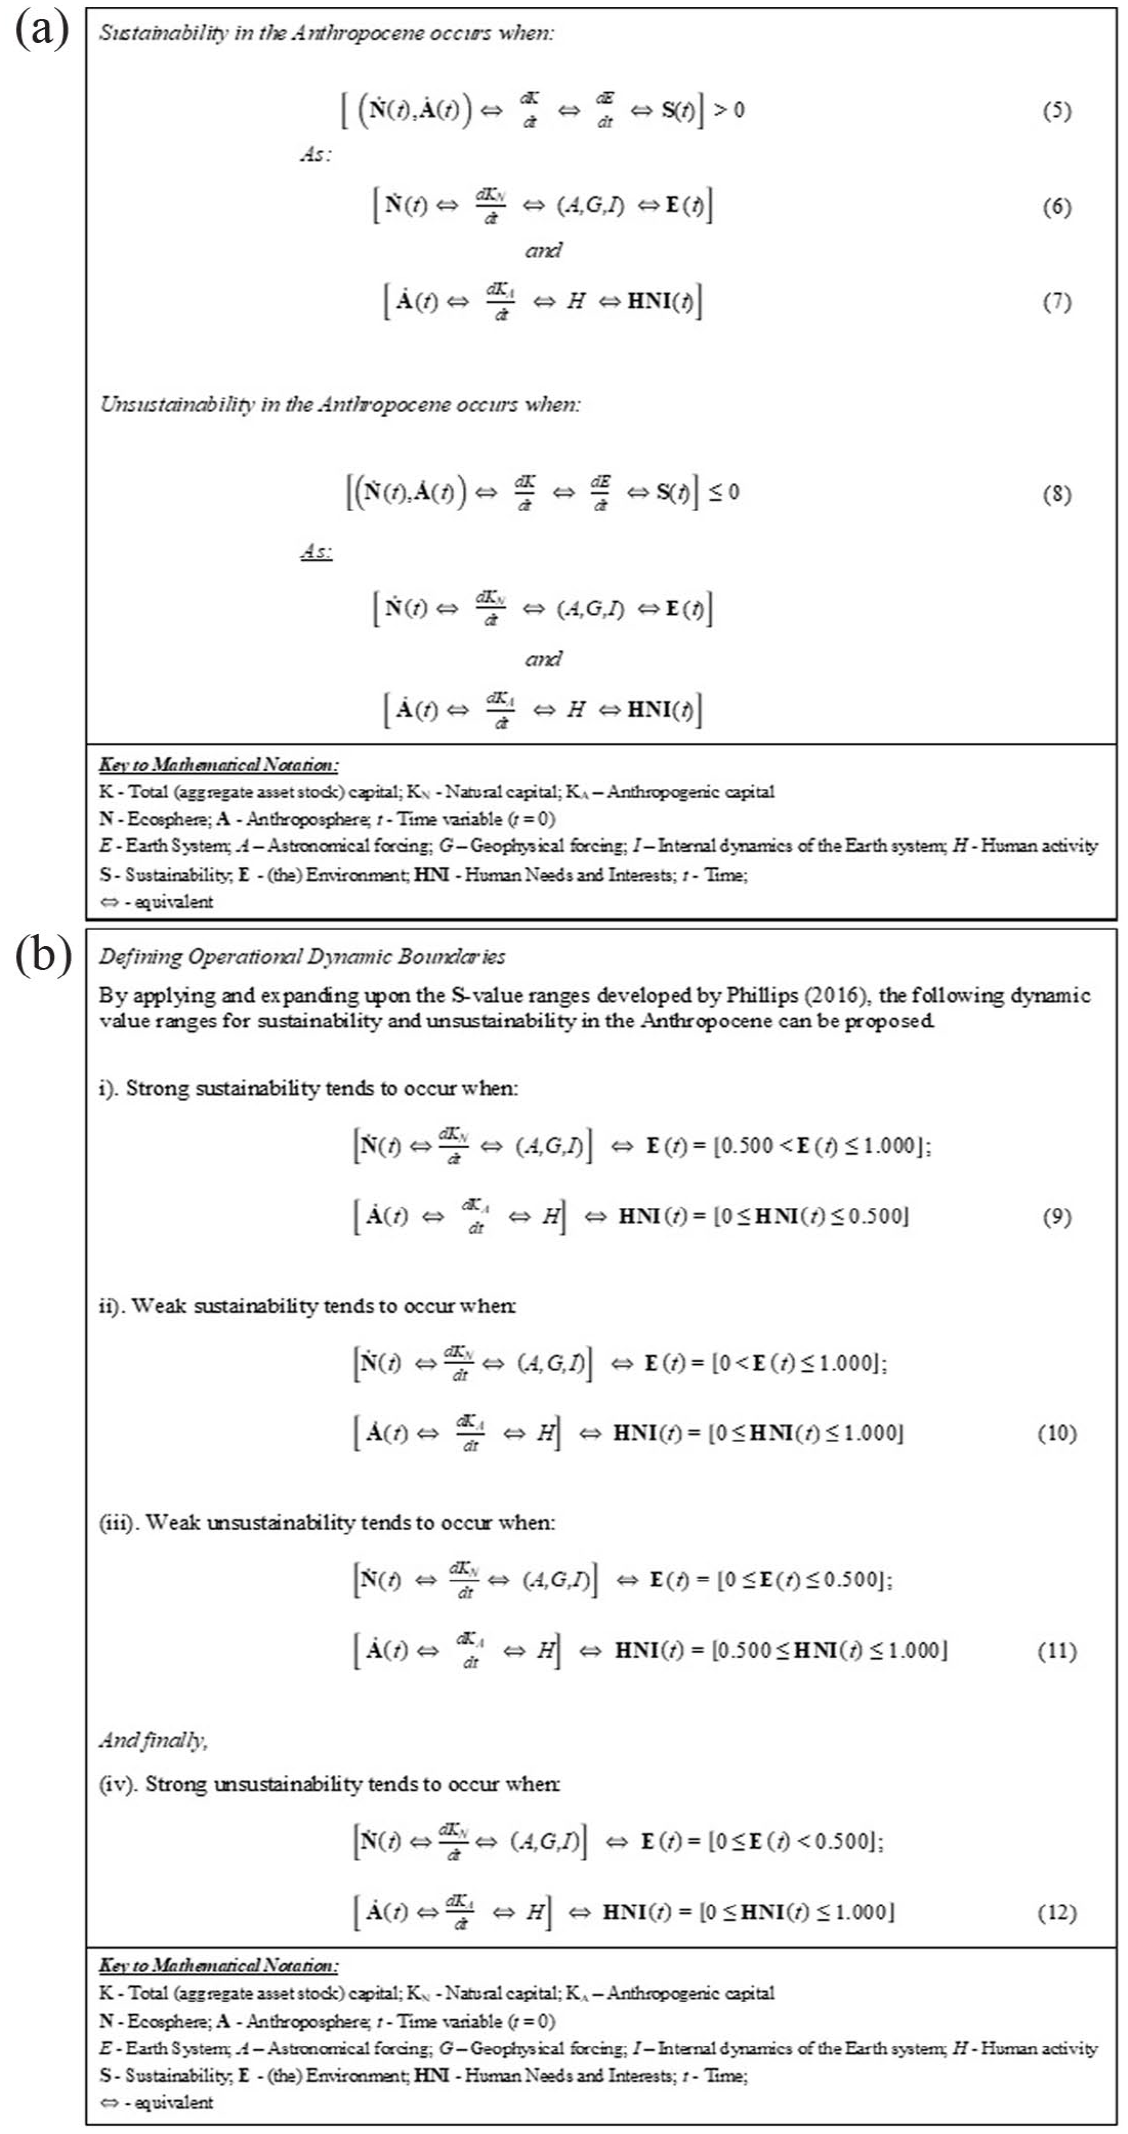
Overview of the finalized sustainability dynamics framework (SDF), after Phillips (2020): (a) shows the dynamics of sustainability and unsustainability; and (b) shows the operational dynamic boundaries of sustainability and unsustainability.
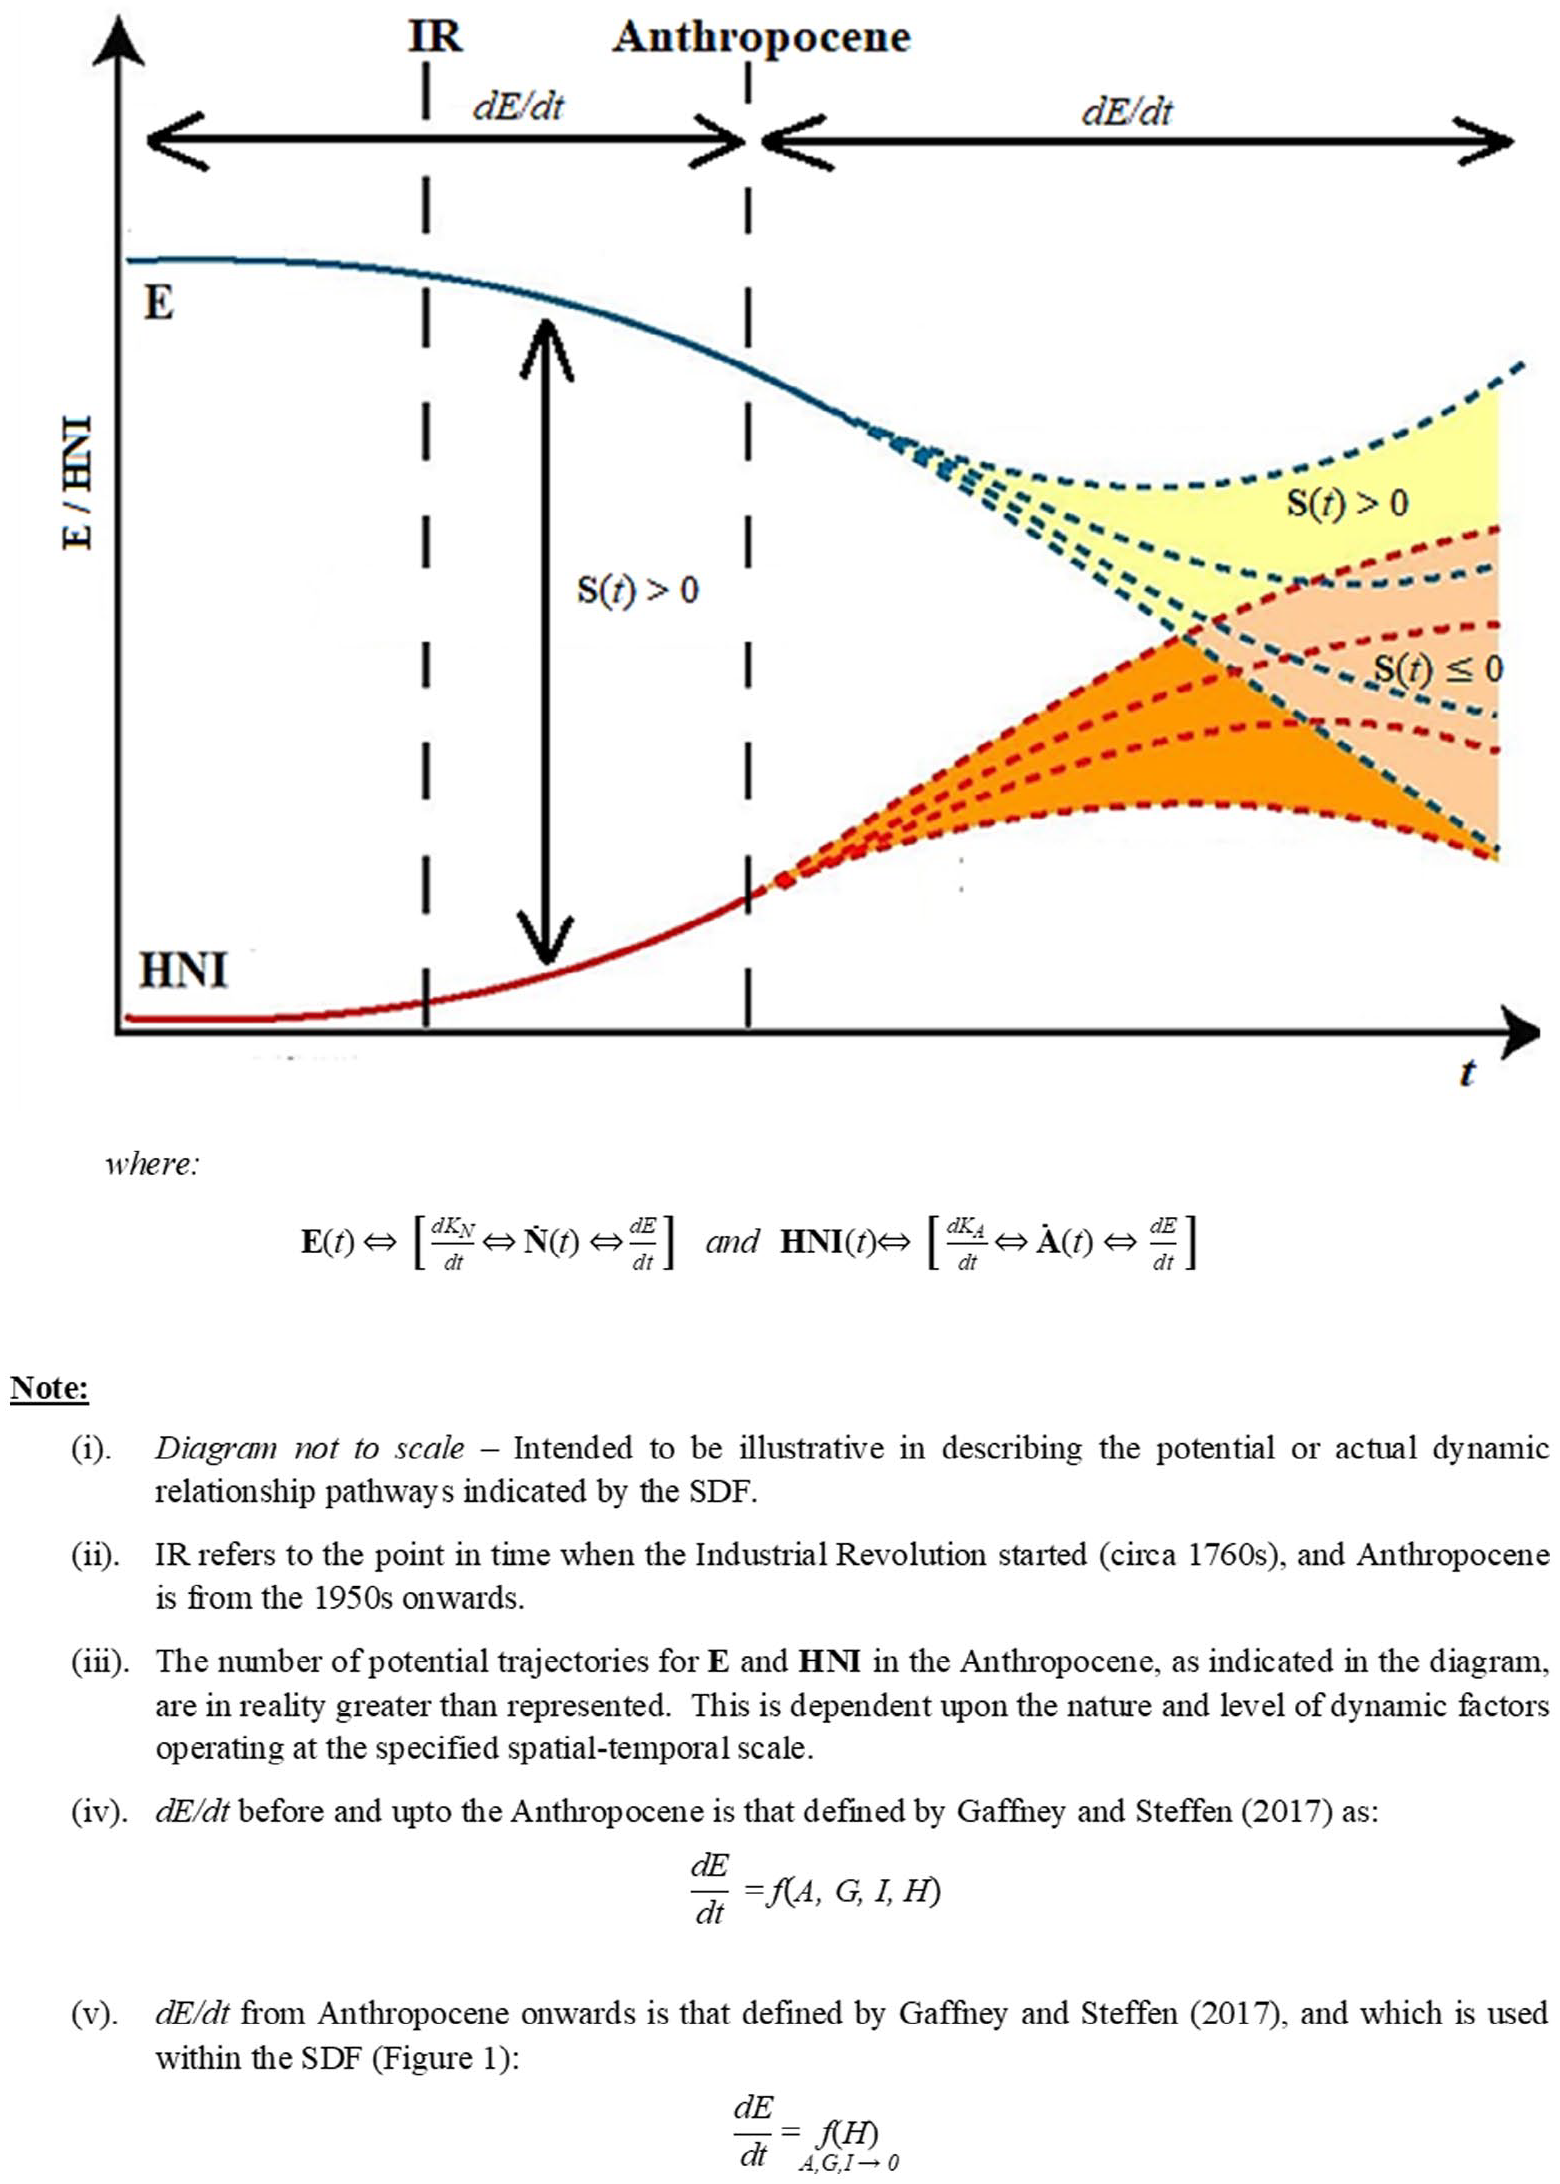
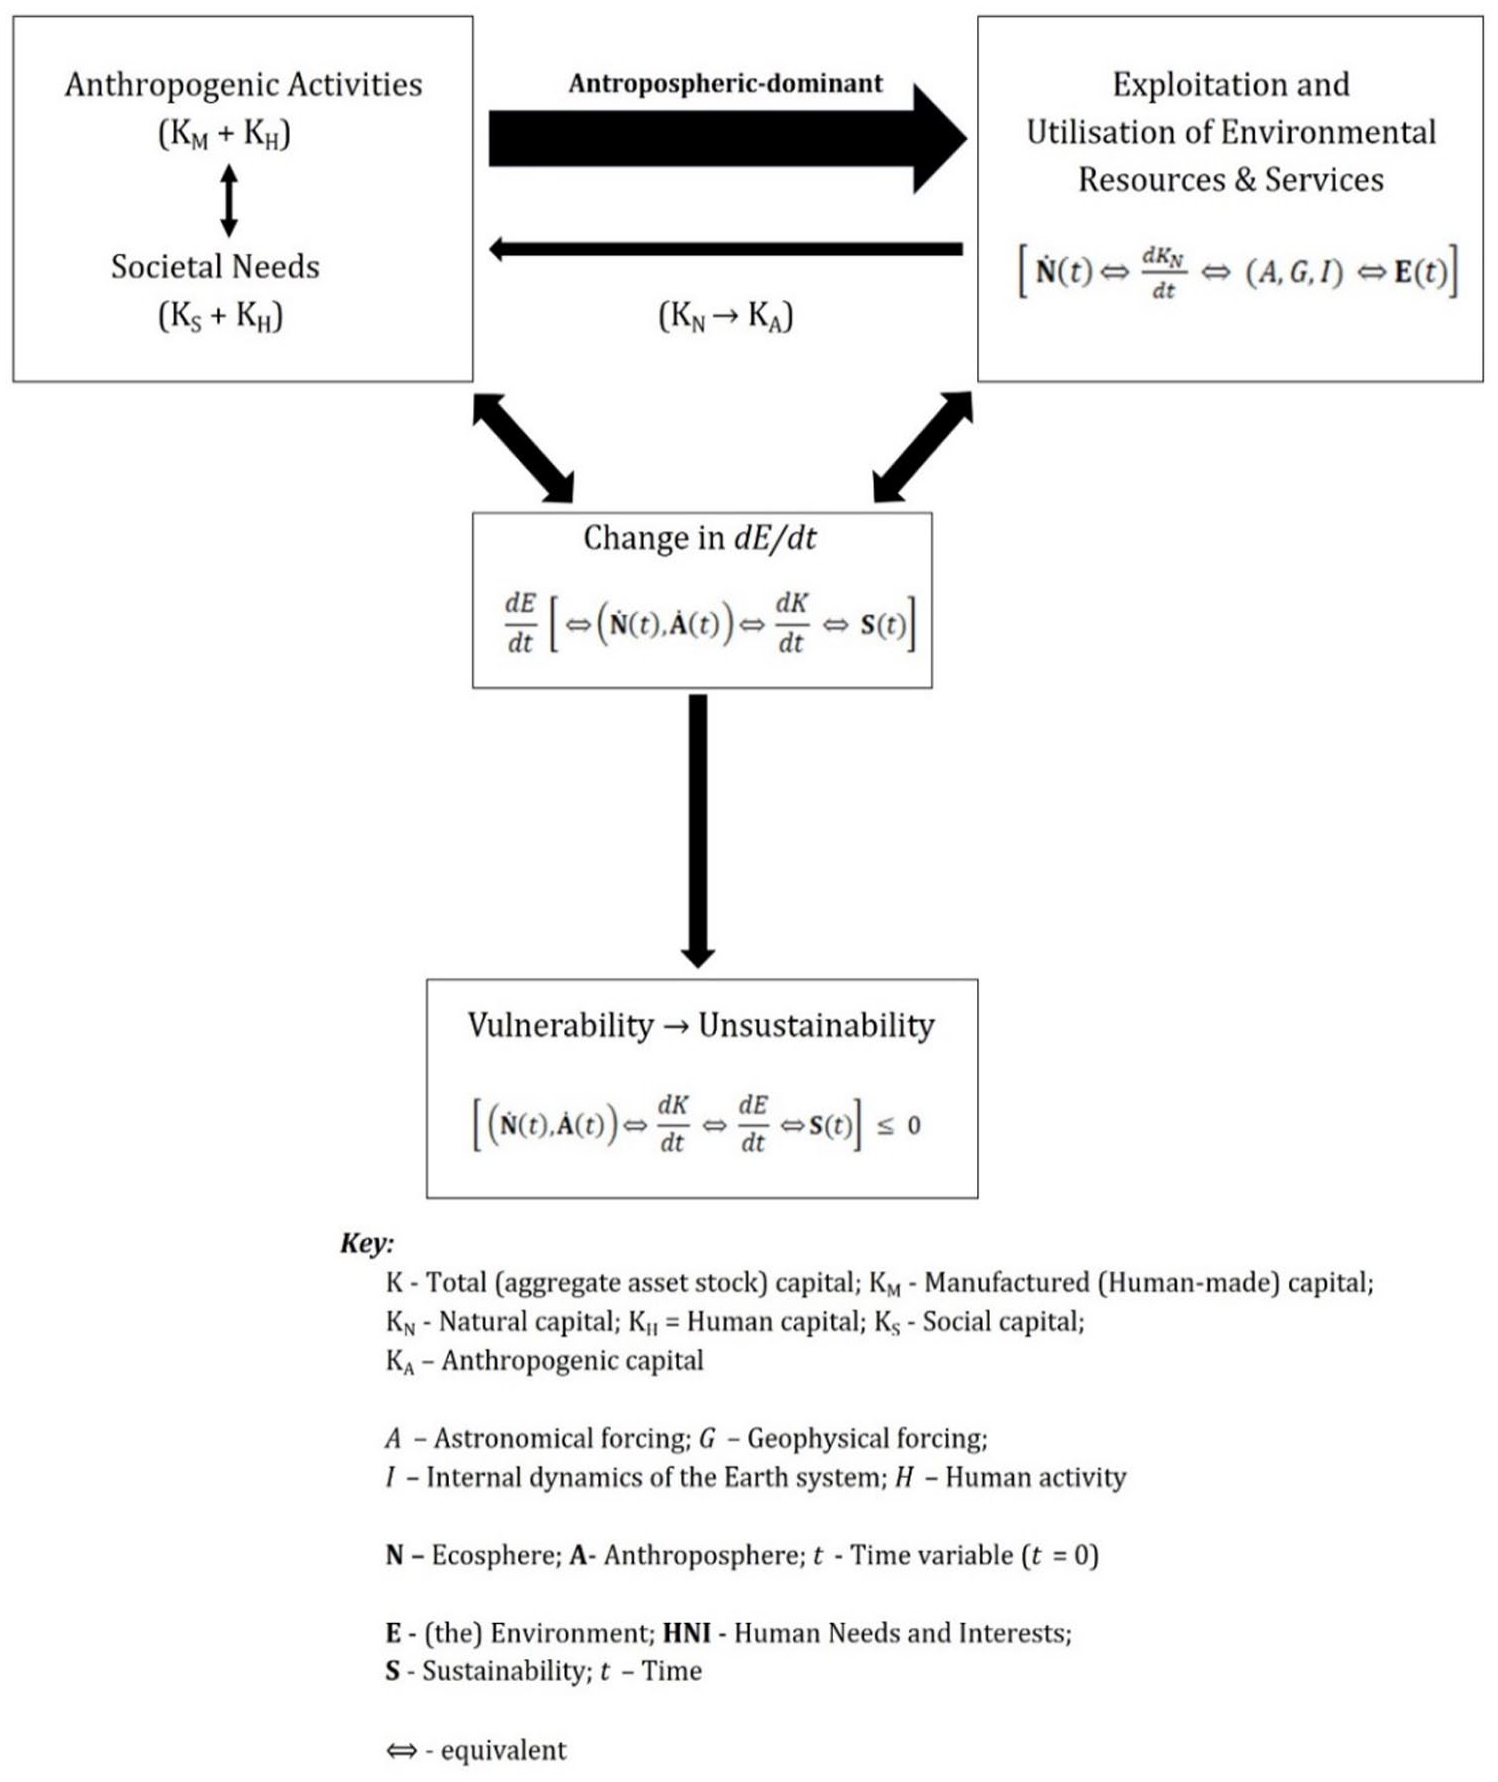
A revised simple conceptualization of the fundamental dynamic relationships of sustainability and unsustainability, as described by the SDF, in terms of E, HNI and S and dE/dt (after and adapting Phillips, 2020).
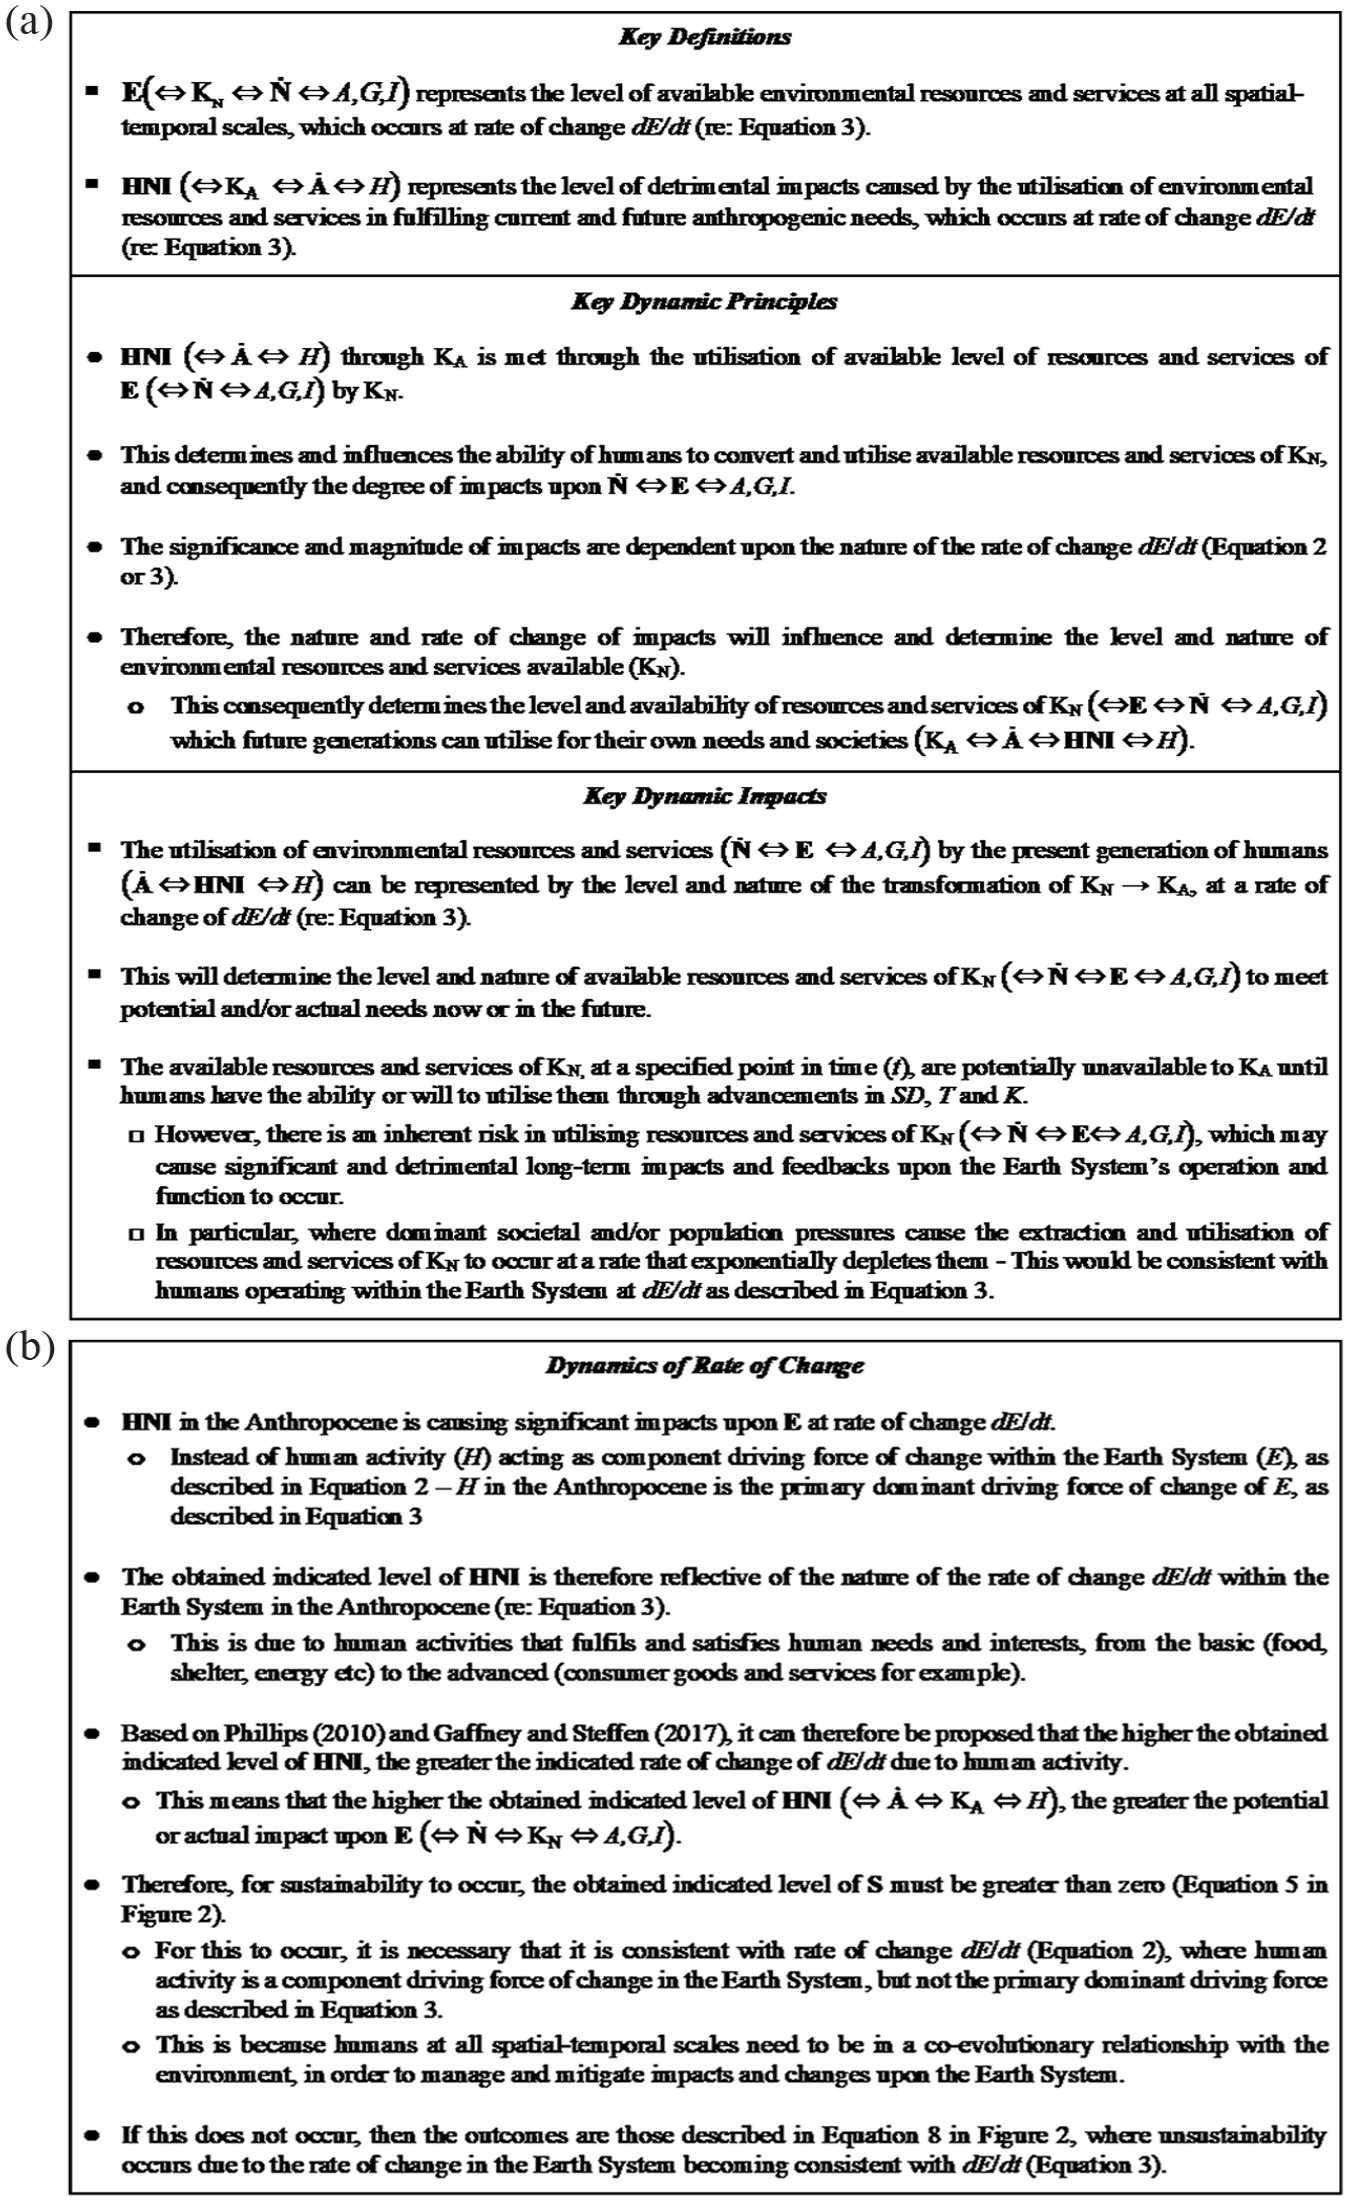
The conceptualization of the key fundamental aspects of the Sustainability Dynamic Framework (SDF), after and adapting Phillips (2020): (a) describes the key dynamic definitions, principles and impacts; (b) describes the key dynamics of rate of change.
In order to apply the SDF and its methodology, a suitable quantitative-based assessment is required. In respect to this study, the results of the Notre Dame Global Adaptation Initiative (ND-GAIN) index (University of Notre Dame, 2021) are used.
The ND-GAIN index is an assessment framework which evaluates the vulnerability and readiness of countries to climate change. The index uses 45 core indicators to evaluate the vulnerability and readiness of 192 UN countries, evaluated annually over the period 1995–2018 (Chen et al., 2015; University of Notre Dame, 2021). Vulnerability indicators are evaluated on a 0–1 scale representing high-low vulnerability, and readiness indicators are evaluated on a 0–1 scale representing low-high readiness (Chen et al., 2015). The data used for the indicators were required to meet the following criteria, as stated by Chen et al. (2015: 5): (1). Available for a high proportion of United Nations countries; (2). Time-series so that changes and trends in country vulnerability and readiness can be tracked. Indicators with data from 1995 to the present are preferred; (3). Freely accessible to the public; (4). Collected and maintained by reliable and authoritative organizations that carry out quality checks on their data; and (5). Are transparent and conceptually clear.
Aggregated category scores for countries are also determined, based upon the obtained scores of the component indicators which are in one of six categories, as shown in Table 2. It is the aggregated vulnerability scores of the six categories which are used to apply the SDF. The aggregate score of each category operates on the same 0–1 value range for vulnerability indicators.
ND-GAIN vulnerability categories and indicators, after and adapting University of Notre Dame (2021). (MMS parameter categorization in brackets, re: Figure 5, Step 2).
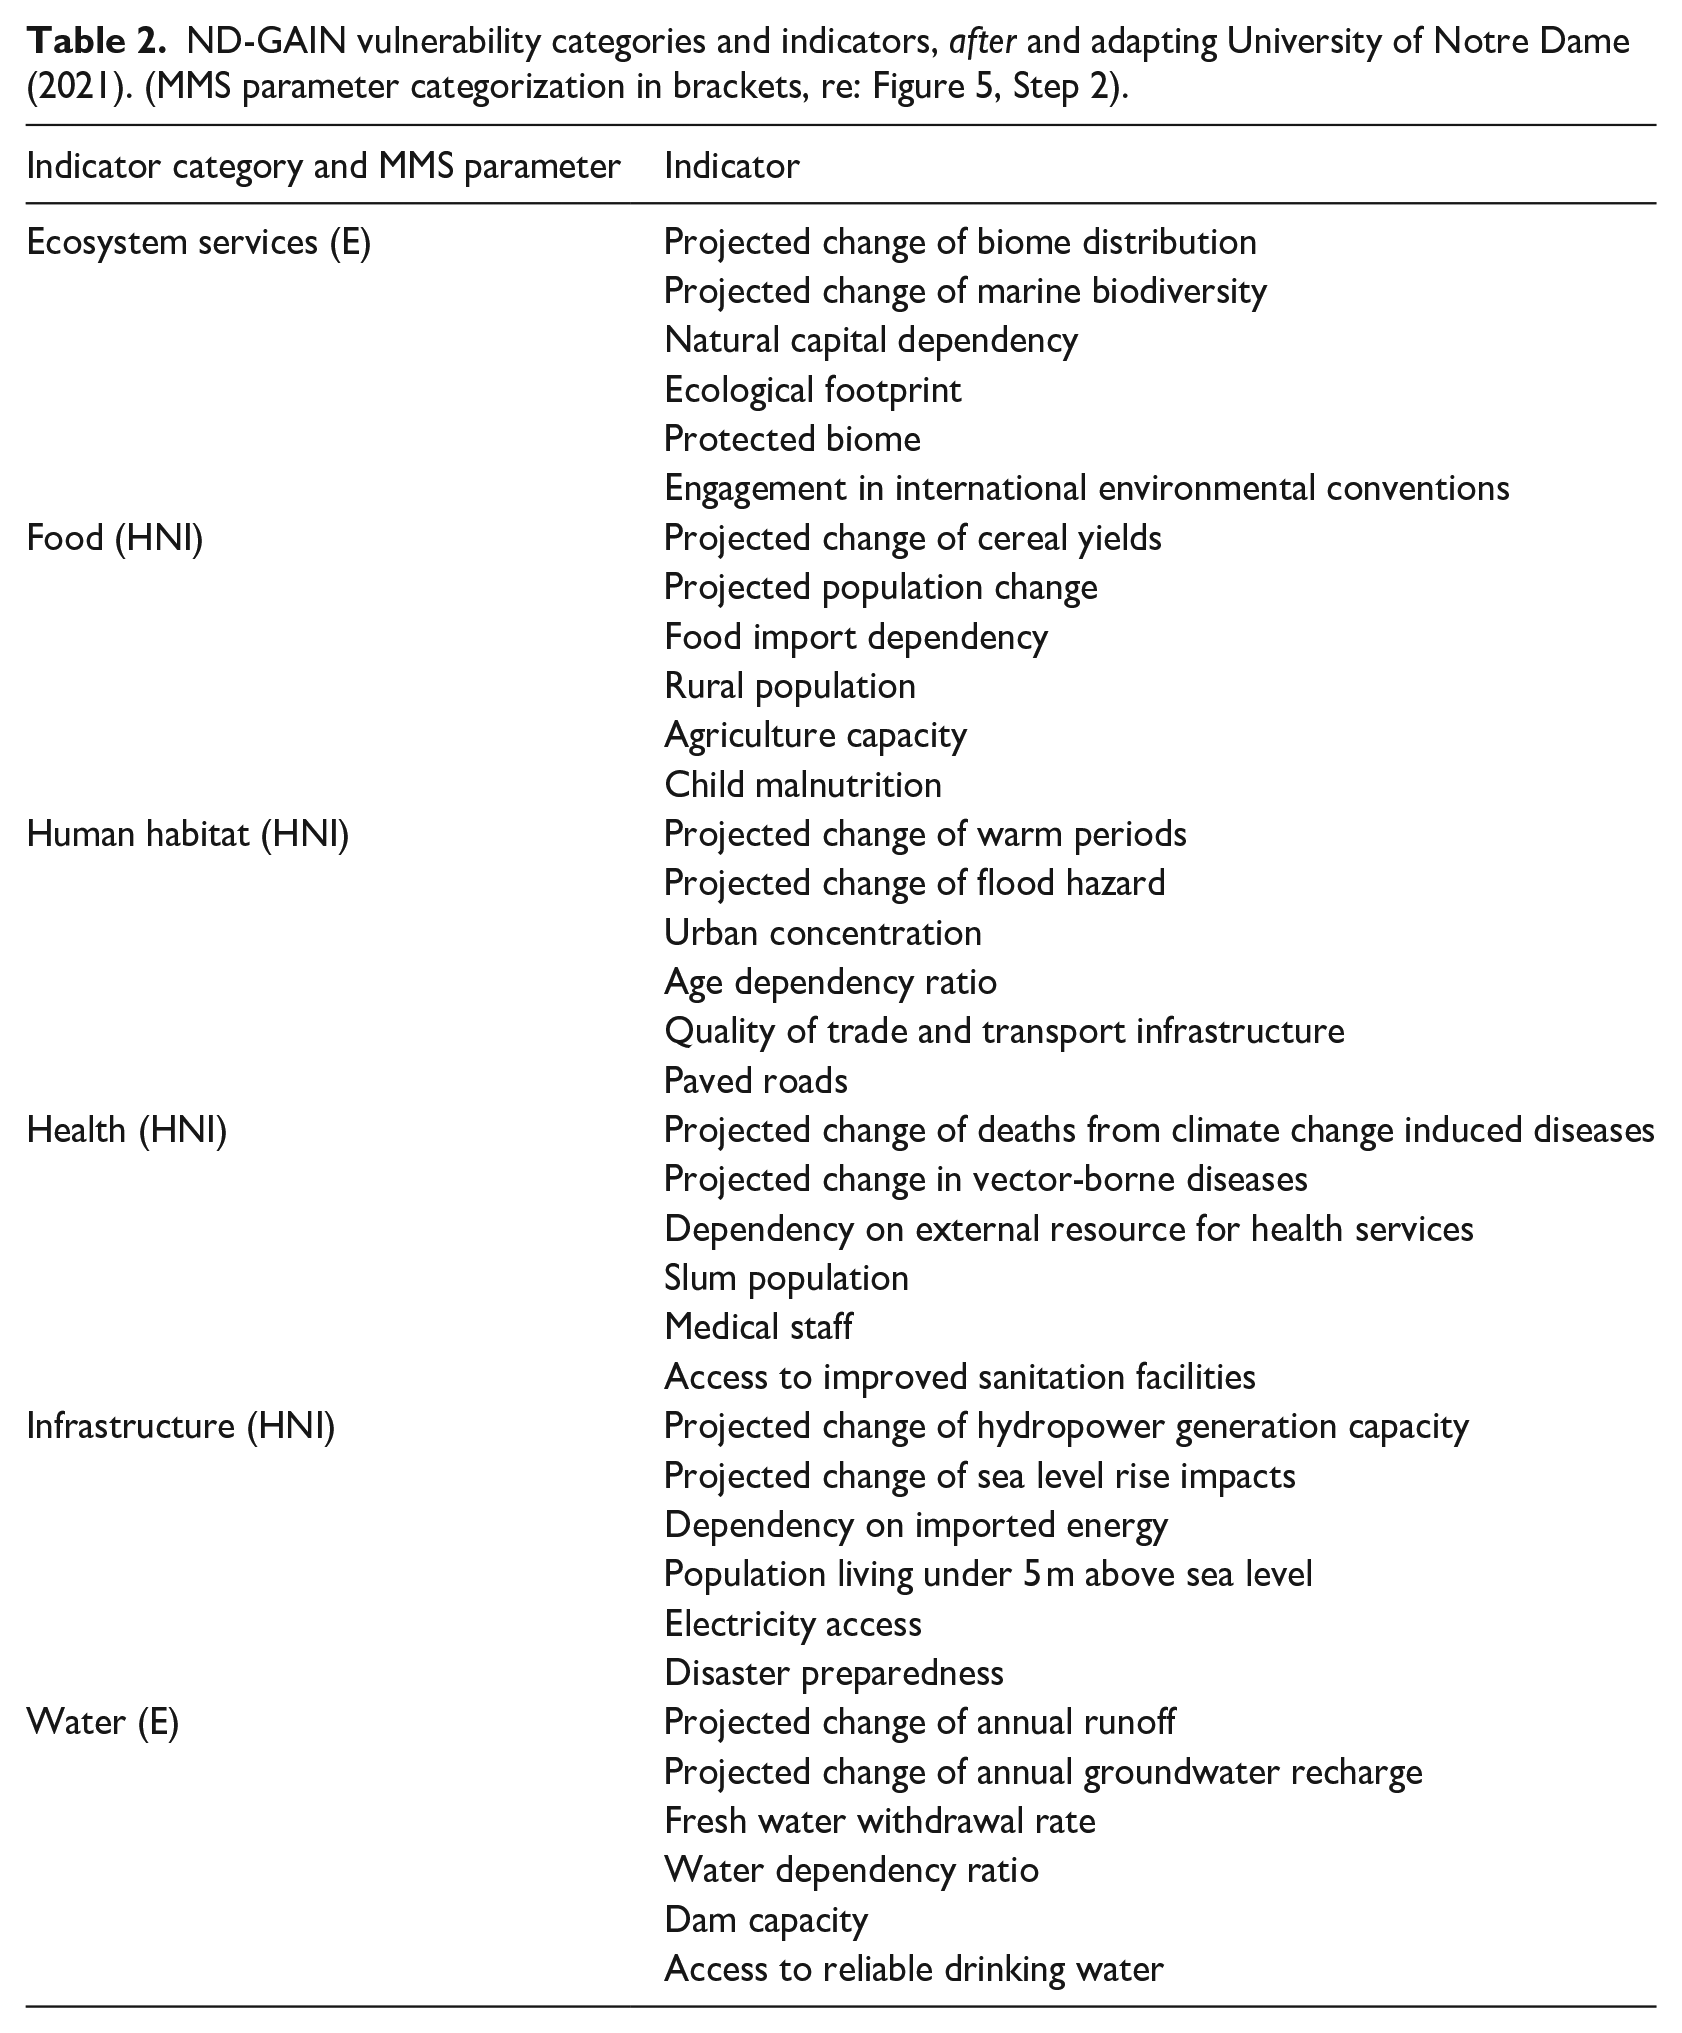
The reasons for using the aggregated category vulnerability scores were two-fold. Firstly, the aggregate scores indicate the cumulative level of vulnerability occurring in respect to each category. Consequently, this reflects the combined impacts of the category indicators in relation to the category overall. Secondly, the aggregated scores provided a suitable and sufficient quantity and quality of data to apply the SDF in a reasonably timely and efficient approach. Specifically, due to the large sample of countries used over the specified period (1995–2018), it was deemed appropriate to use the annual aggregated category scores instead of the individual annual indicator scores, because it provided a rapid but robust quantity and quality of data in order to apply the SDF.
Methodological stages
The study applied a four-stage approach adapting a revised methodology developed in Phillips (2022). The stages and their processes were as follows.
Stage 1 – Data Collation & Organization The data utilized to apply the SDF was sourced from the ND-GAIN website (re:University of Notre Dame, 2021) and the World Bank databank website (re: World Bank, 2020). Both the ND-GAIN and World Bank websites operate on an open-source basis meaning that the data is freely available to all.
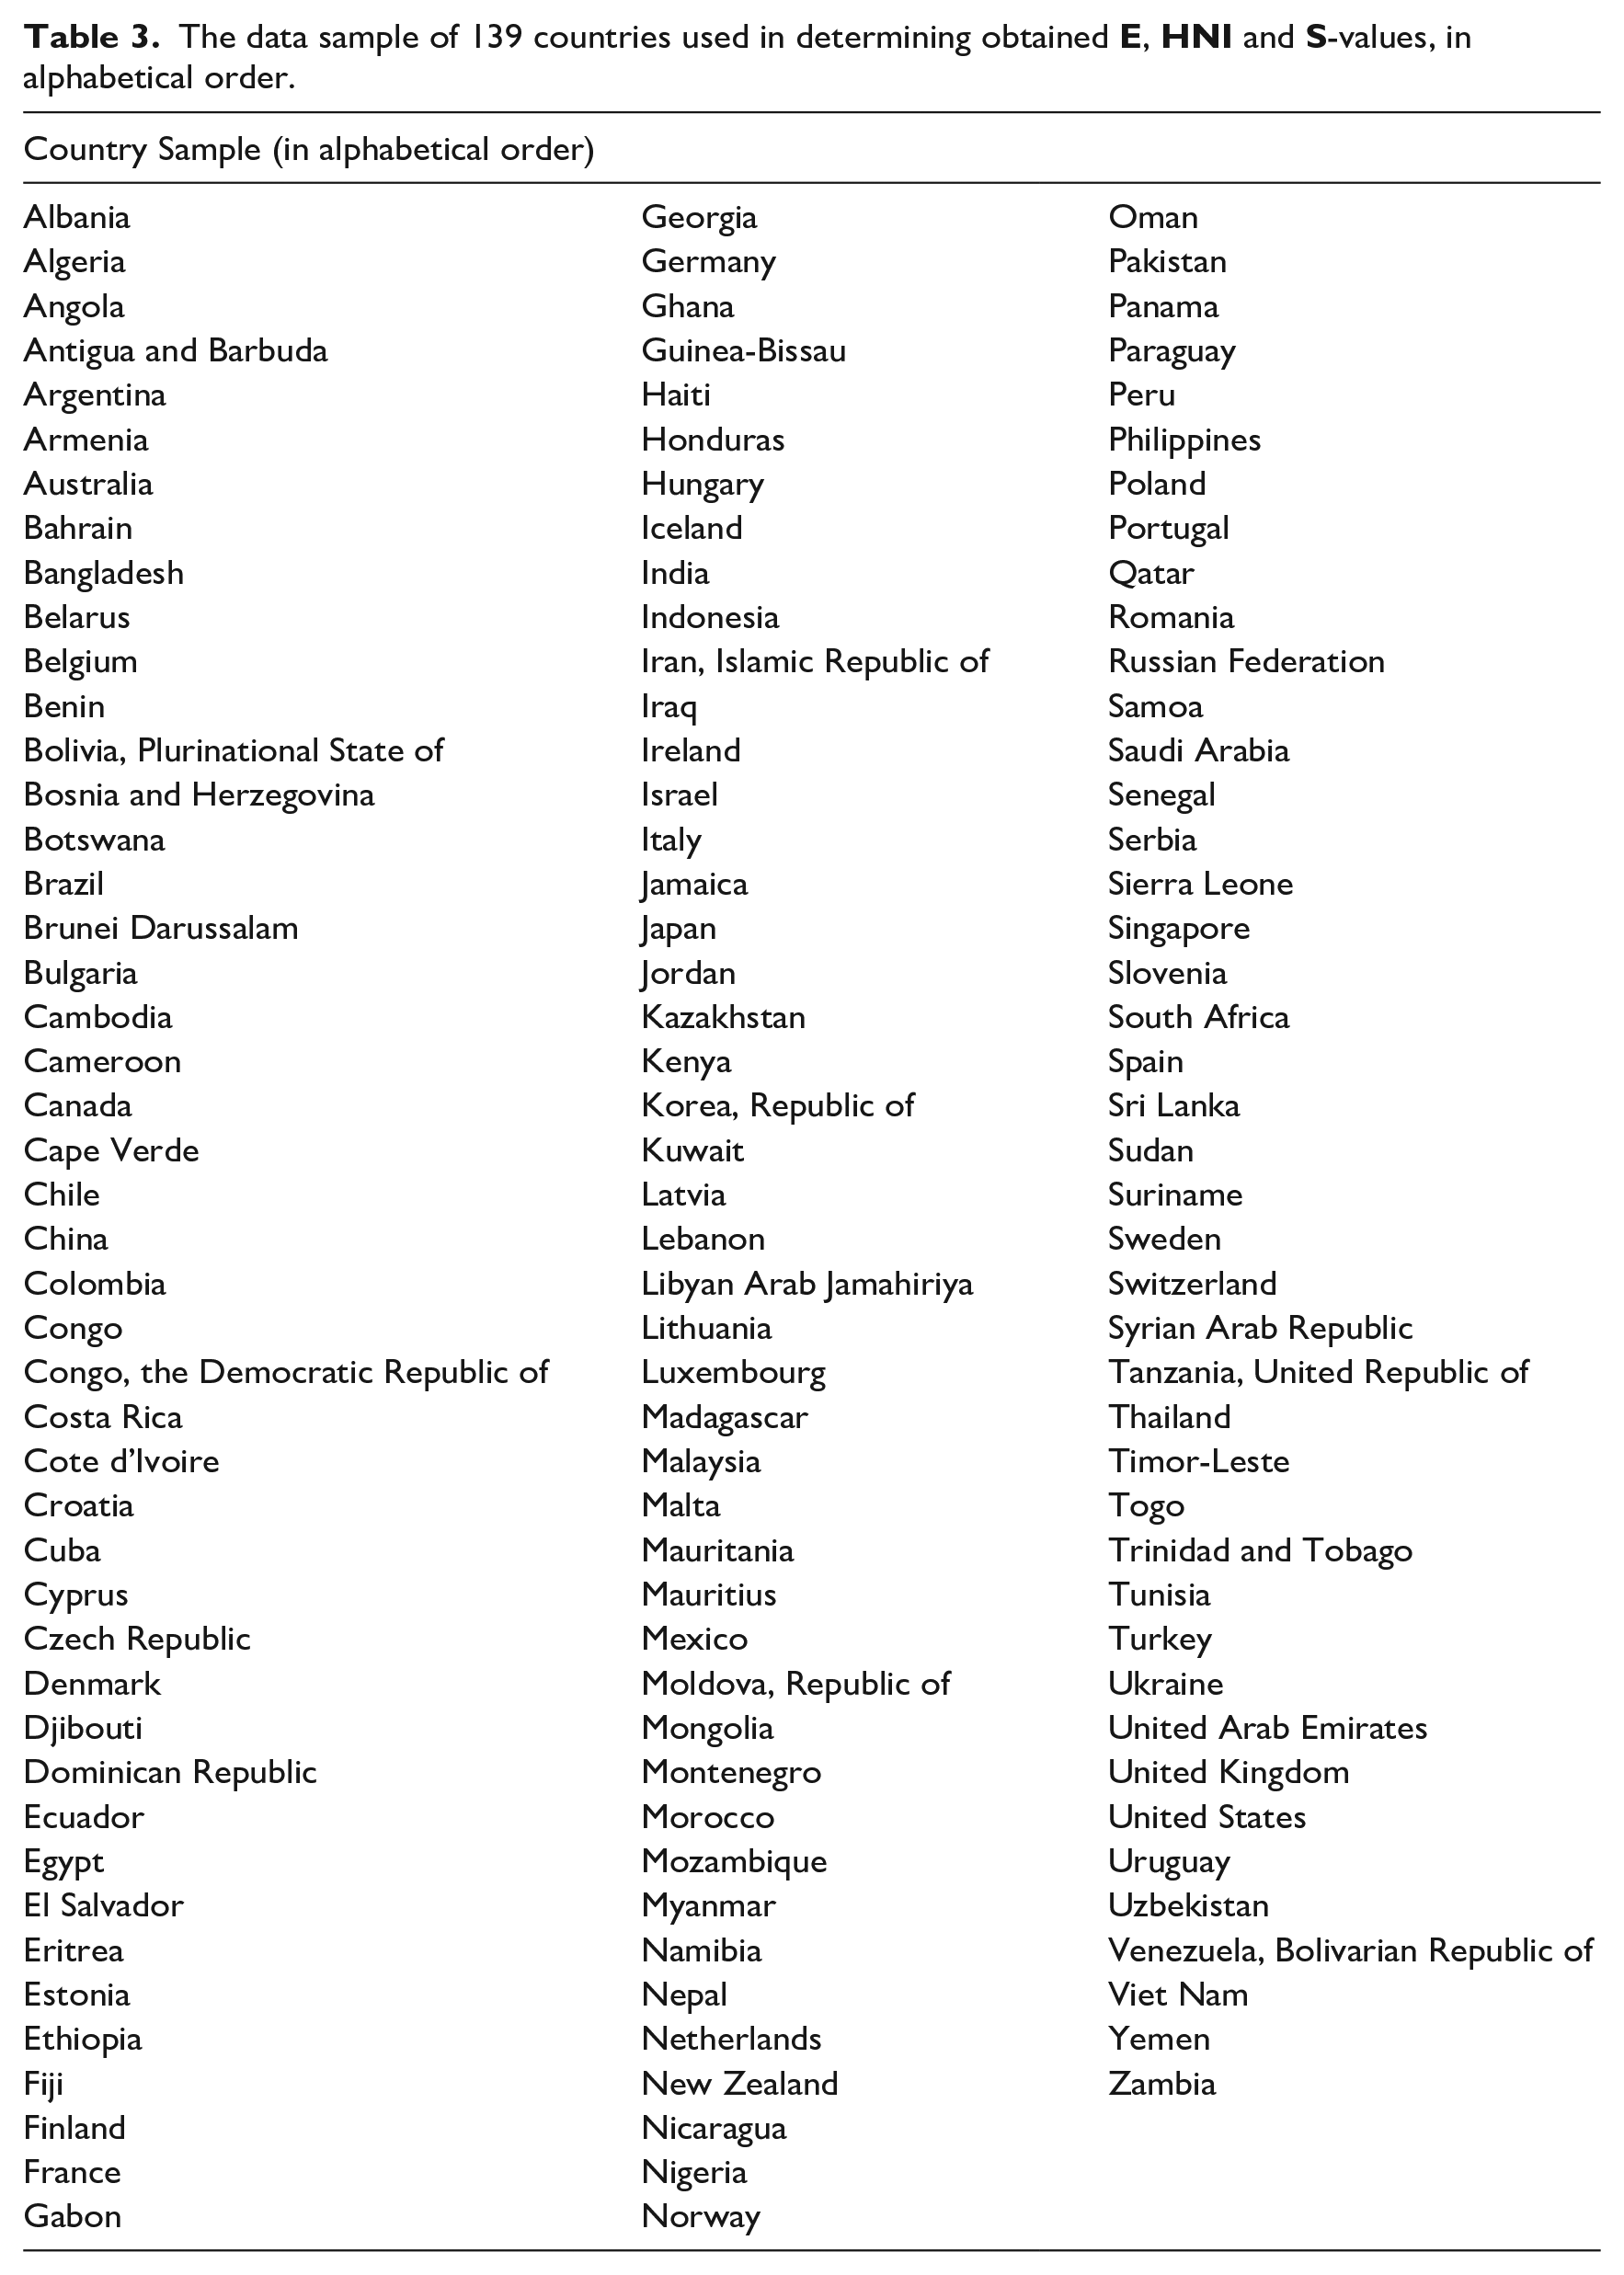
In respect to the ND-GAIN data, the aggregate category scores were extracted and placed within a single Microsoft Excel 2019 file. Then the data was examined and countries with missing category scores in any or all years were removed. Therefore, only countries with 100% data in all categories and years were used to eliminate and/or minimize potential biases and errors in the next methodological stages. Consequently, out of a potential 192 UN countries, a total of 139 countries with 100% data in all years formed the global sample, as shown in Table 3.
The data sample of 139 countries used in determining obtained
In regards to the World Bank data, this obtained 11 indicators for the 139 countries over the same specified period of 1995–2018, in order to conduct the statistical analyses in Stage 3. The 11 indicators were organized in three core categories, as shown in Table 4.
The 11 indicators of potential influencing factors upon obtained levels and nature of sustainability at the global spatial scale, based on the triumvirate of potential influencing factors in Phillips (2022).
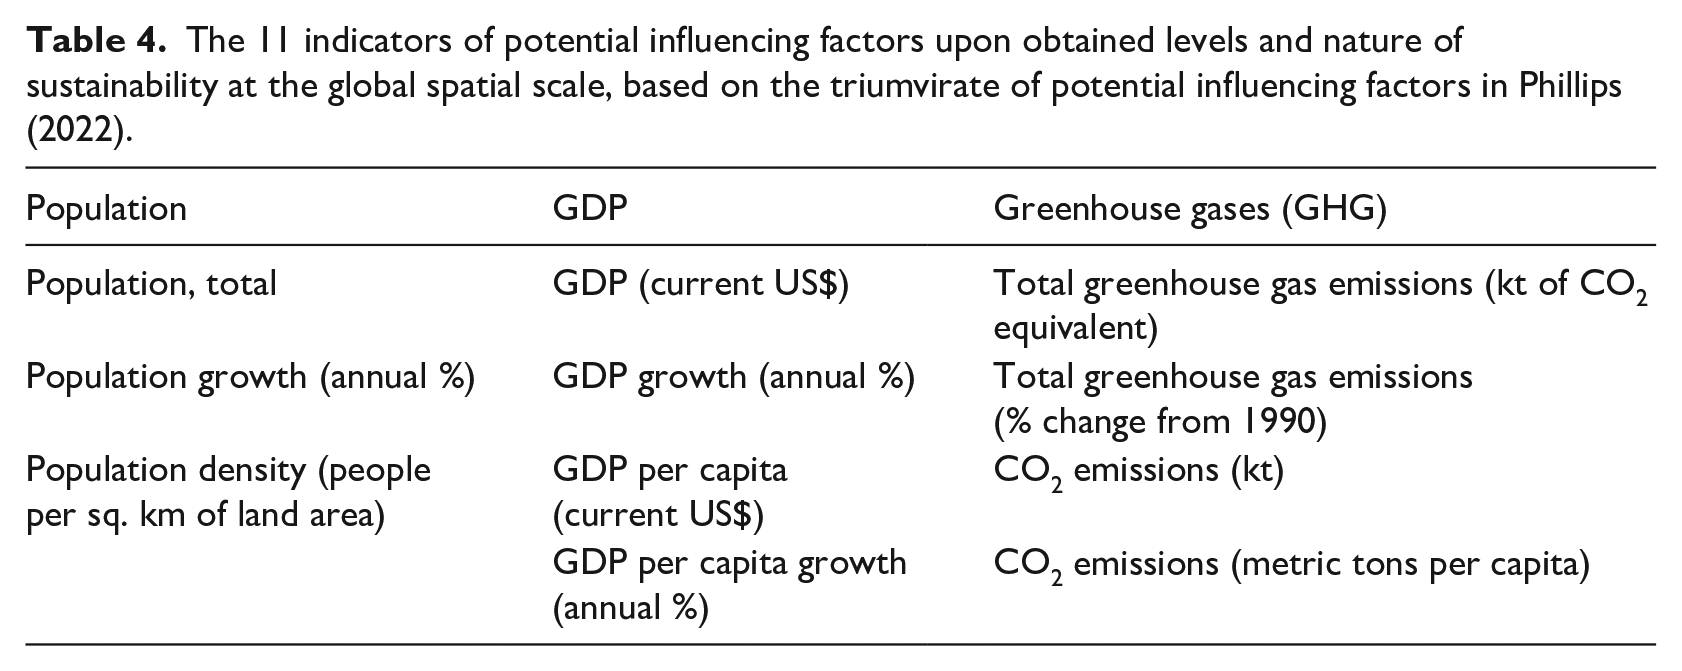
The 11 indicators from the World Bank database were chosen as potential factors upon the levels, nature and dynamics of sustainability occurring at the global spatial scale. This was based upon the findings of Phillips (2022), which identified a potential triumvirate of negative influencing factors consisting of population, GDP and greenhouse gases (GHG) indicators. In respect to this study, the potential influencing factors within the triumvirate were examined in relation to their potential degree and nature of influence upon sustainability from a vulnerability perspective. Therefore, this potentially will indicate the influence of the triumvirate, individually and cumulatively, upon the nature of the global environment-human system and relationship over a specified long-term period (1995–2018).
Stage 2 – Obtained E, HNI and S-values The first SDF application phase was to determine indicated values for the Environment (
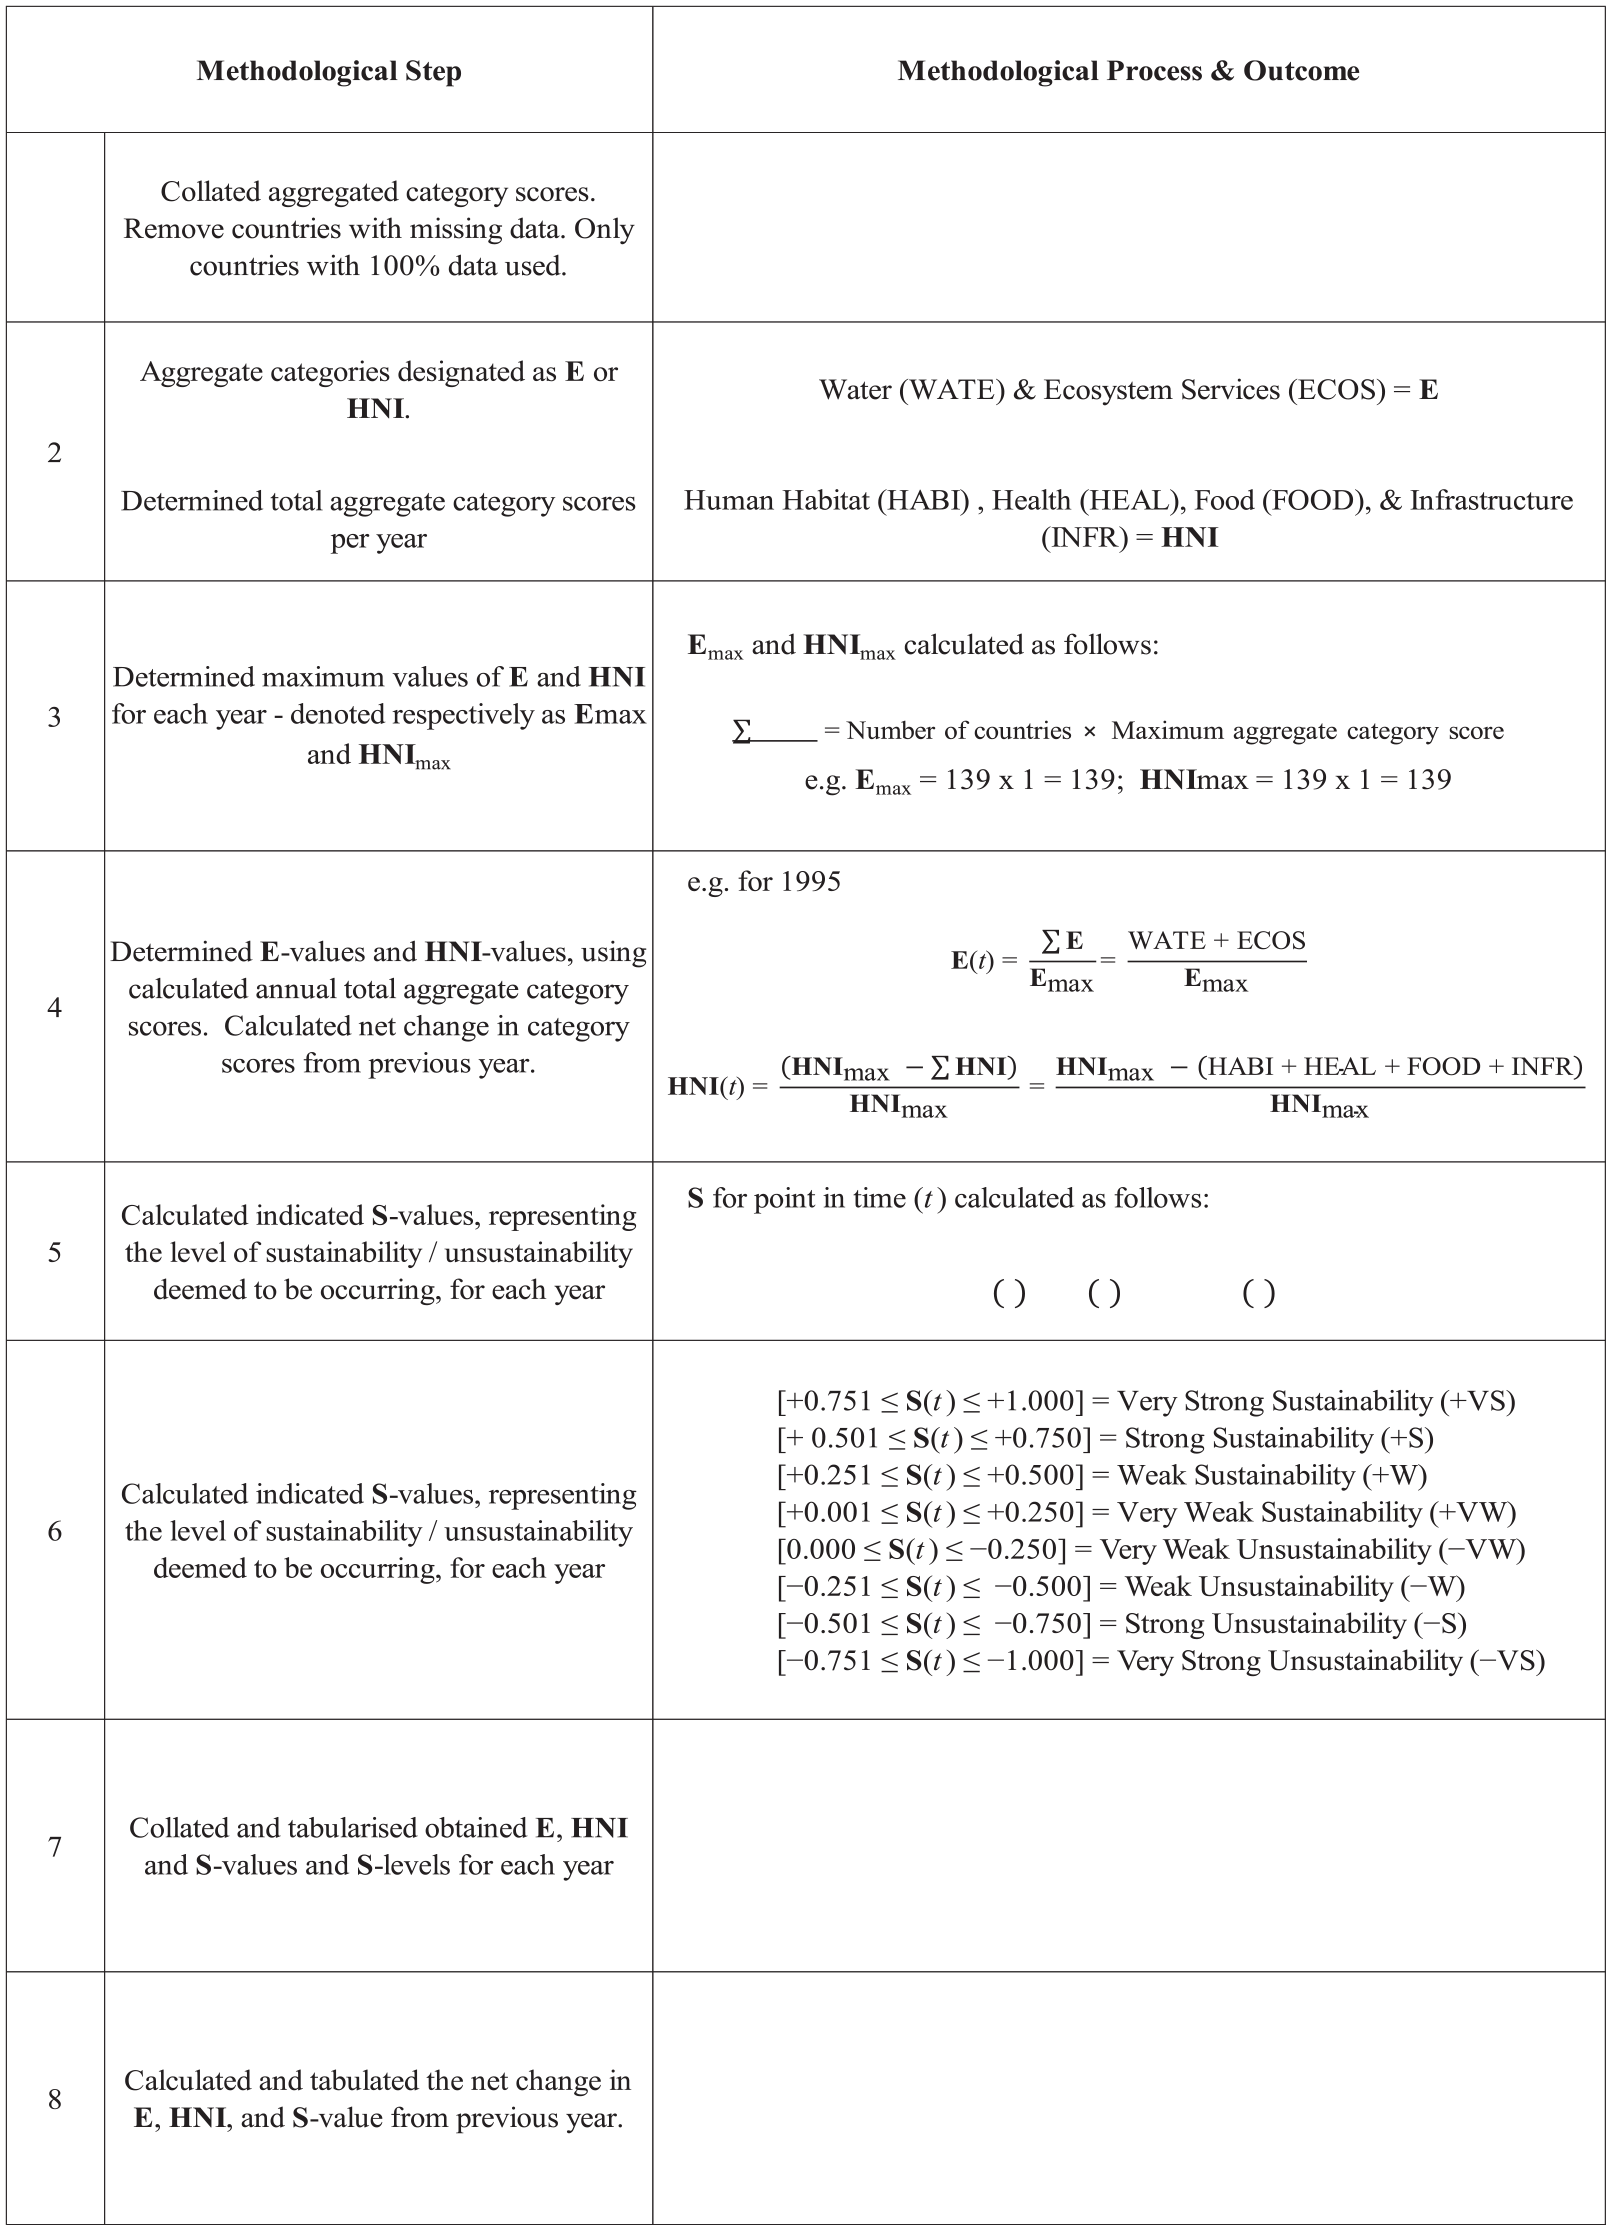
MMS application methodology to ND-GAIN aggregate category scores, based on and adapting Phillips (2022, 2020).
Stage 3 – Statistical Analysis This stage consisted of two statistical analysis tests – (i). Pearson correlation co-efficient test (two-tailed); and (ii). simple linear multiple regression analysis, both conducted using Microsoft Excel 2019.
The Pearson test evaluated the presence of a statistically significant relationship between obtained
The multiple regression analysis was applied in order to indicate the degree of potential association between obtained
Stage 4 - Dynamic Analysis The dynamic analysis involved the objective determination and evaluation of the indicated dynamics of global sustainability occurring over the period 1995–2018. The analysis applied the stated dynamic principles and definitions in Figures 2 and 4 to the results obtained in Tables 4 to 11 and Figures 6 and 7. By this approach, the fundamental dynamic interactions and influences upon obtained levels and nature of sustainability occurring at the specified spatial-temporal scale were indicatively determined.
Total aggregate category scores and obtained
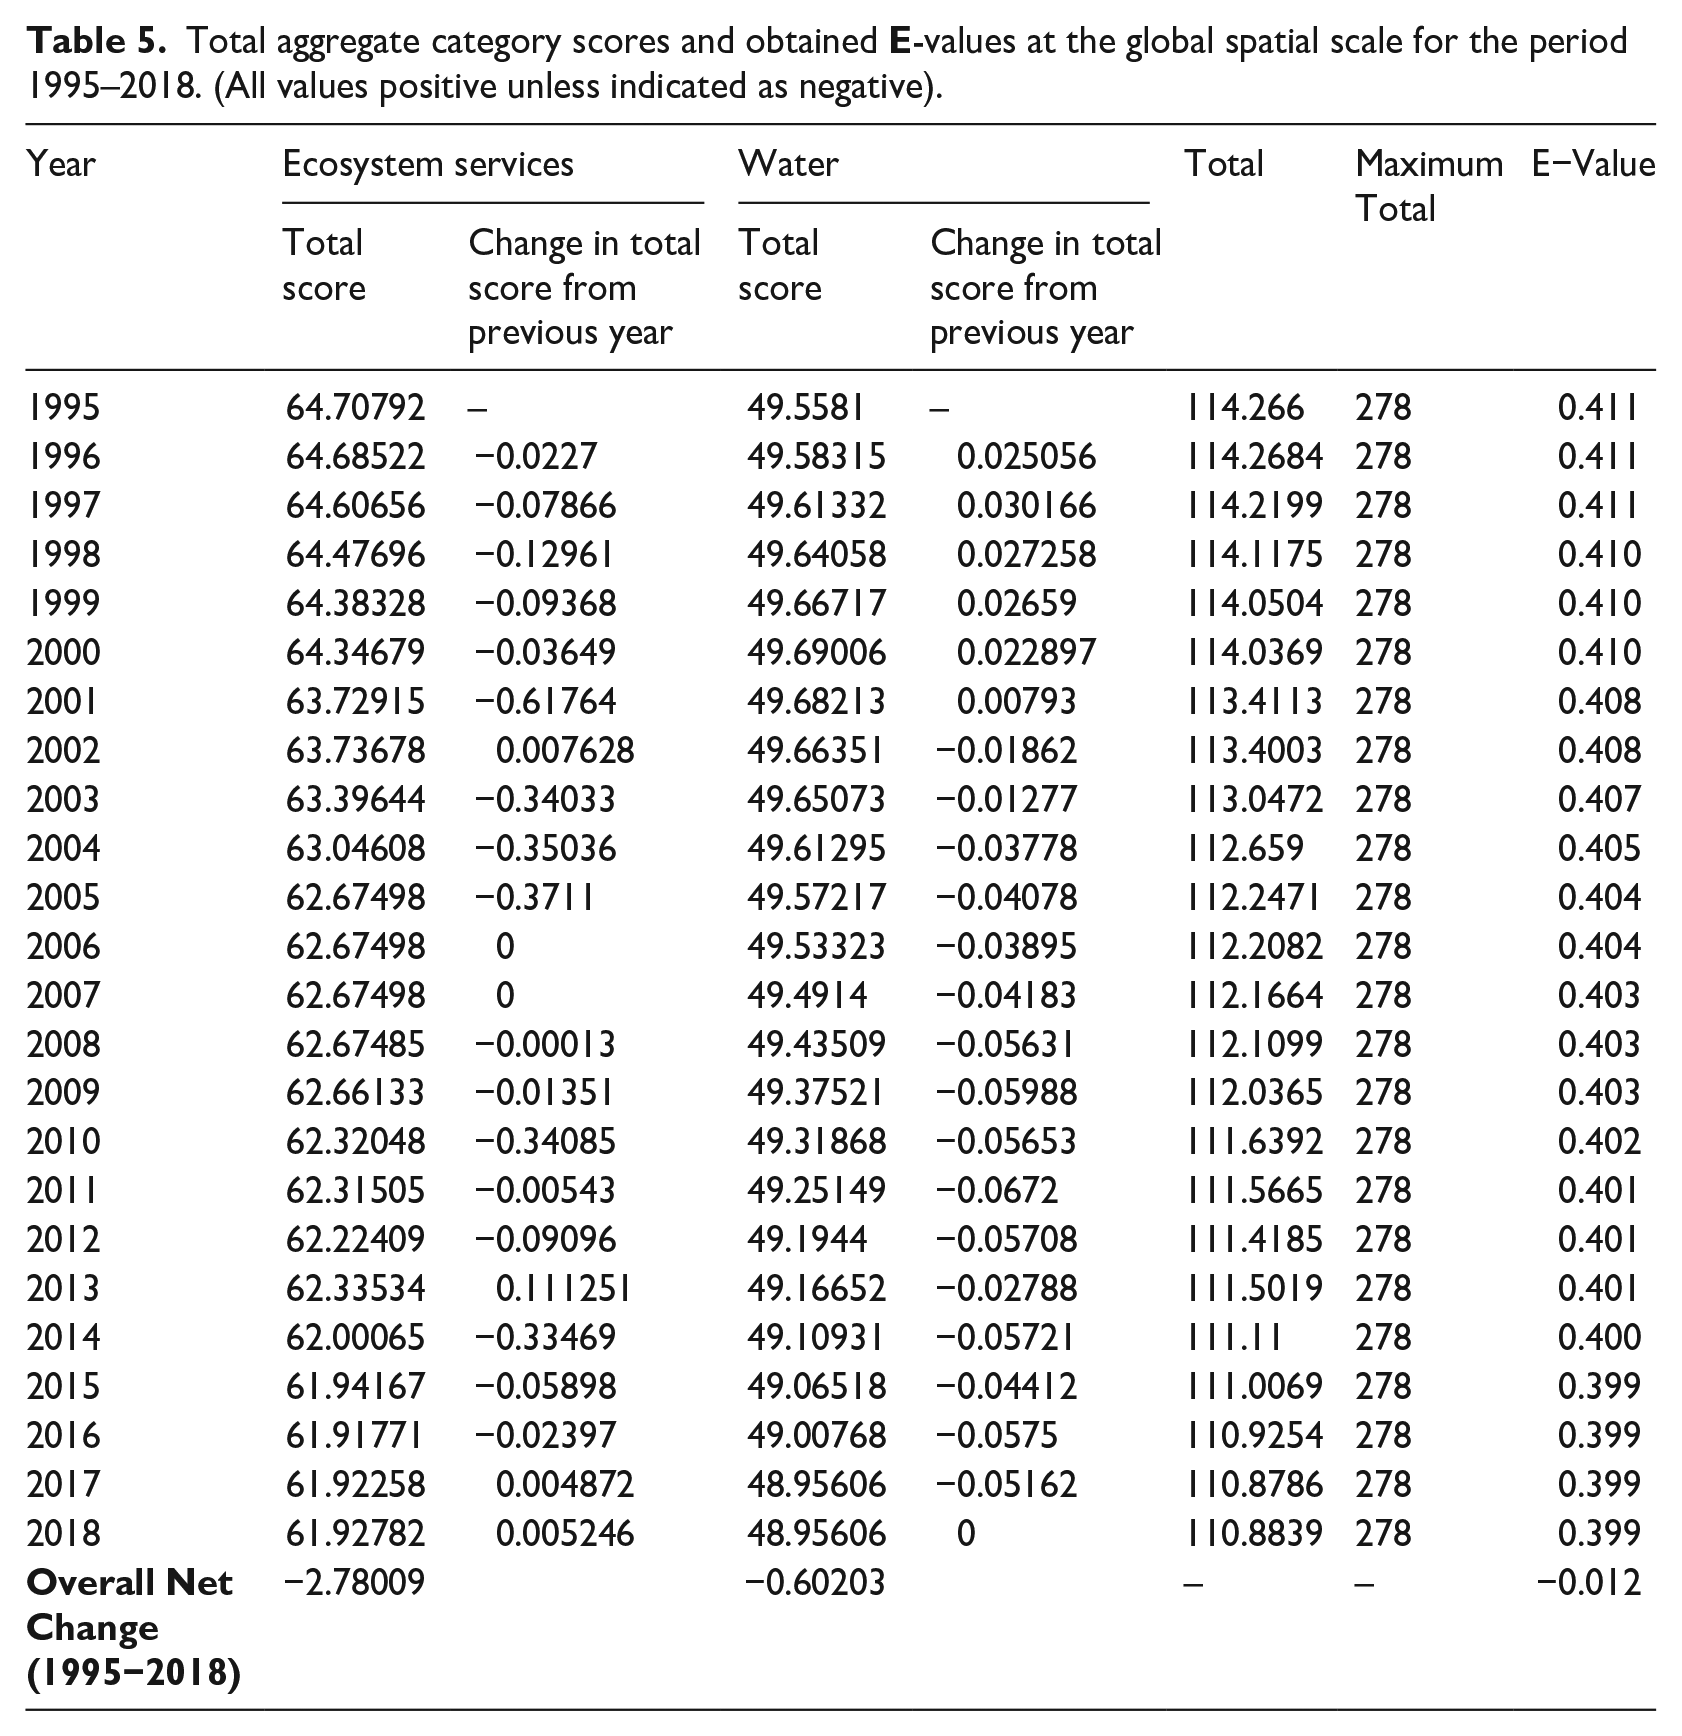
Total aggregate category scores and obtained
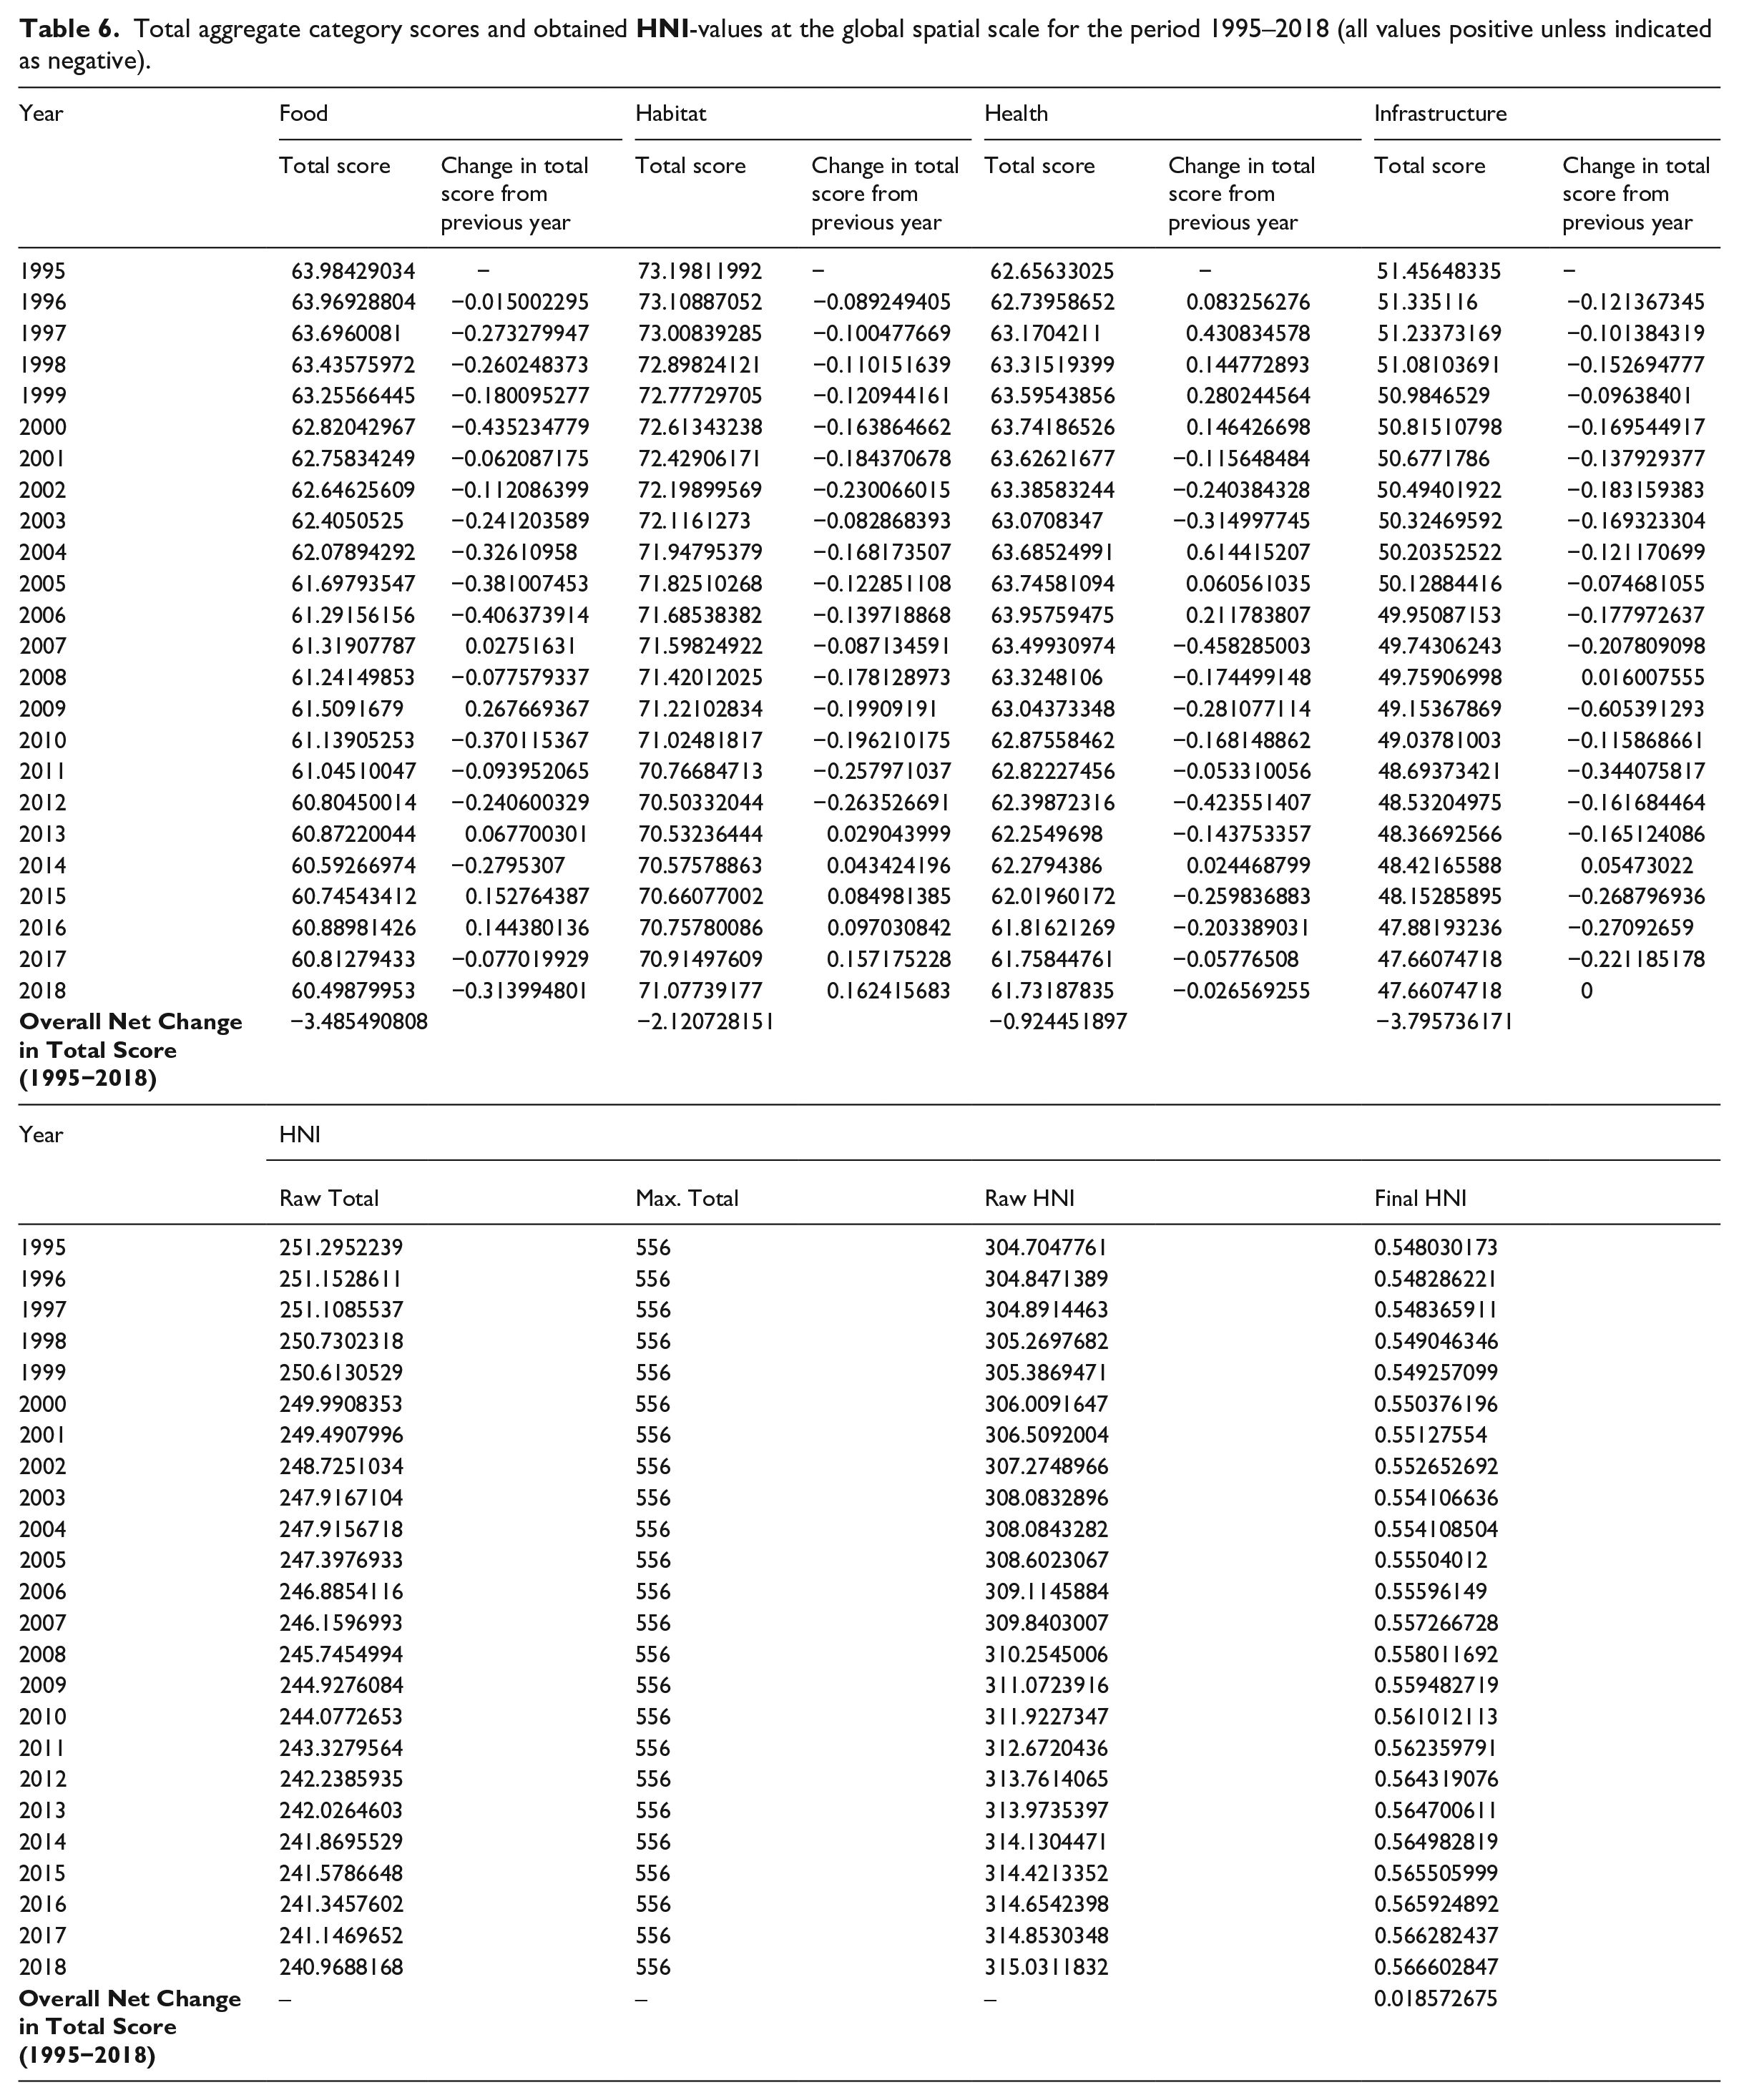
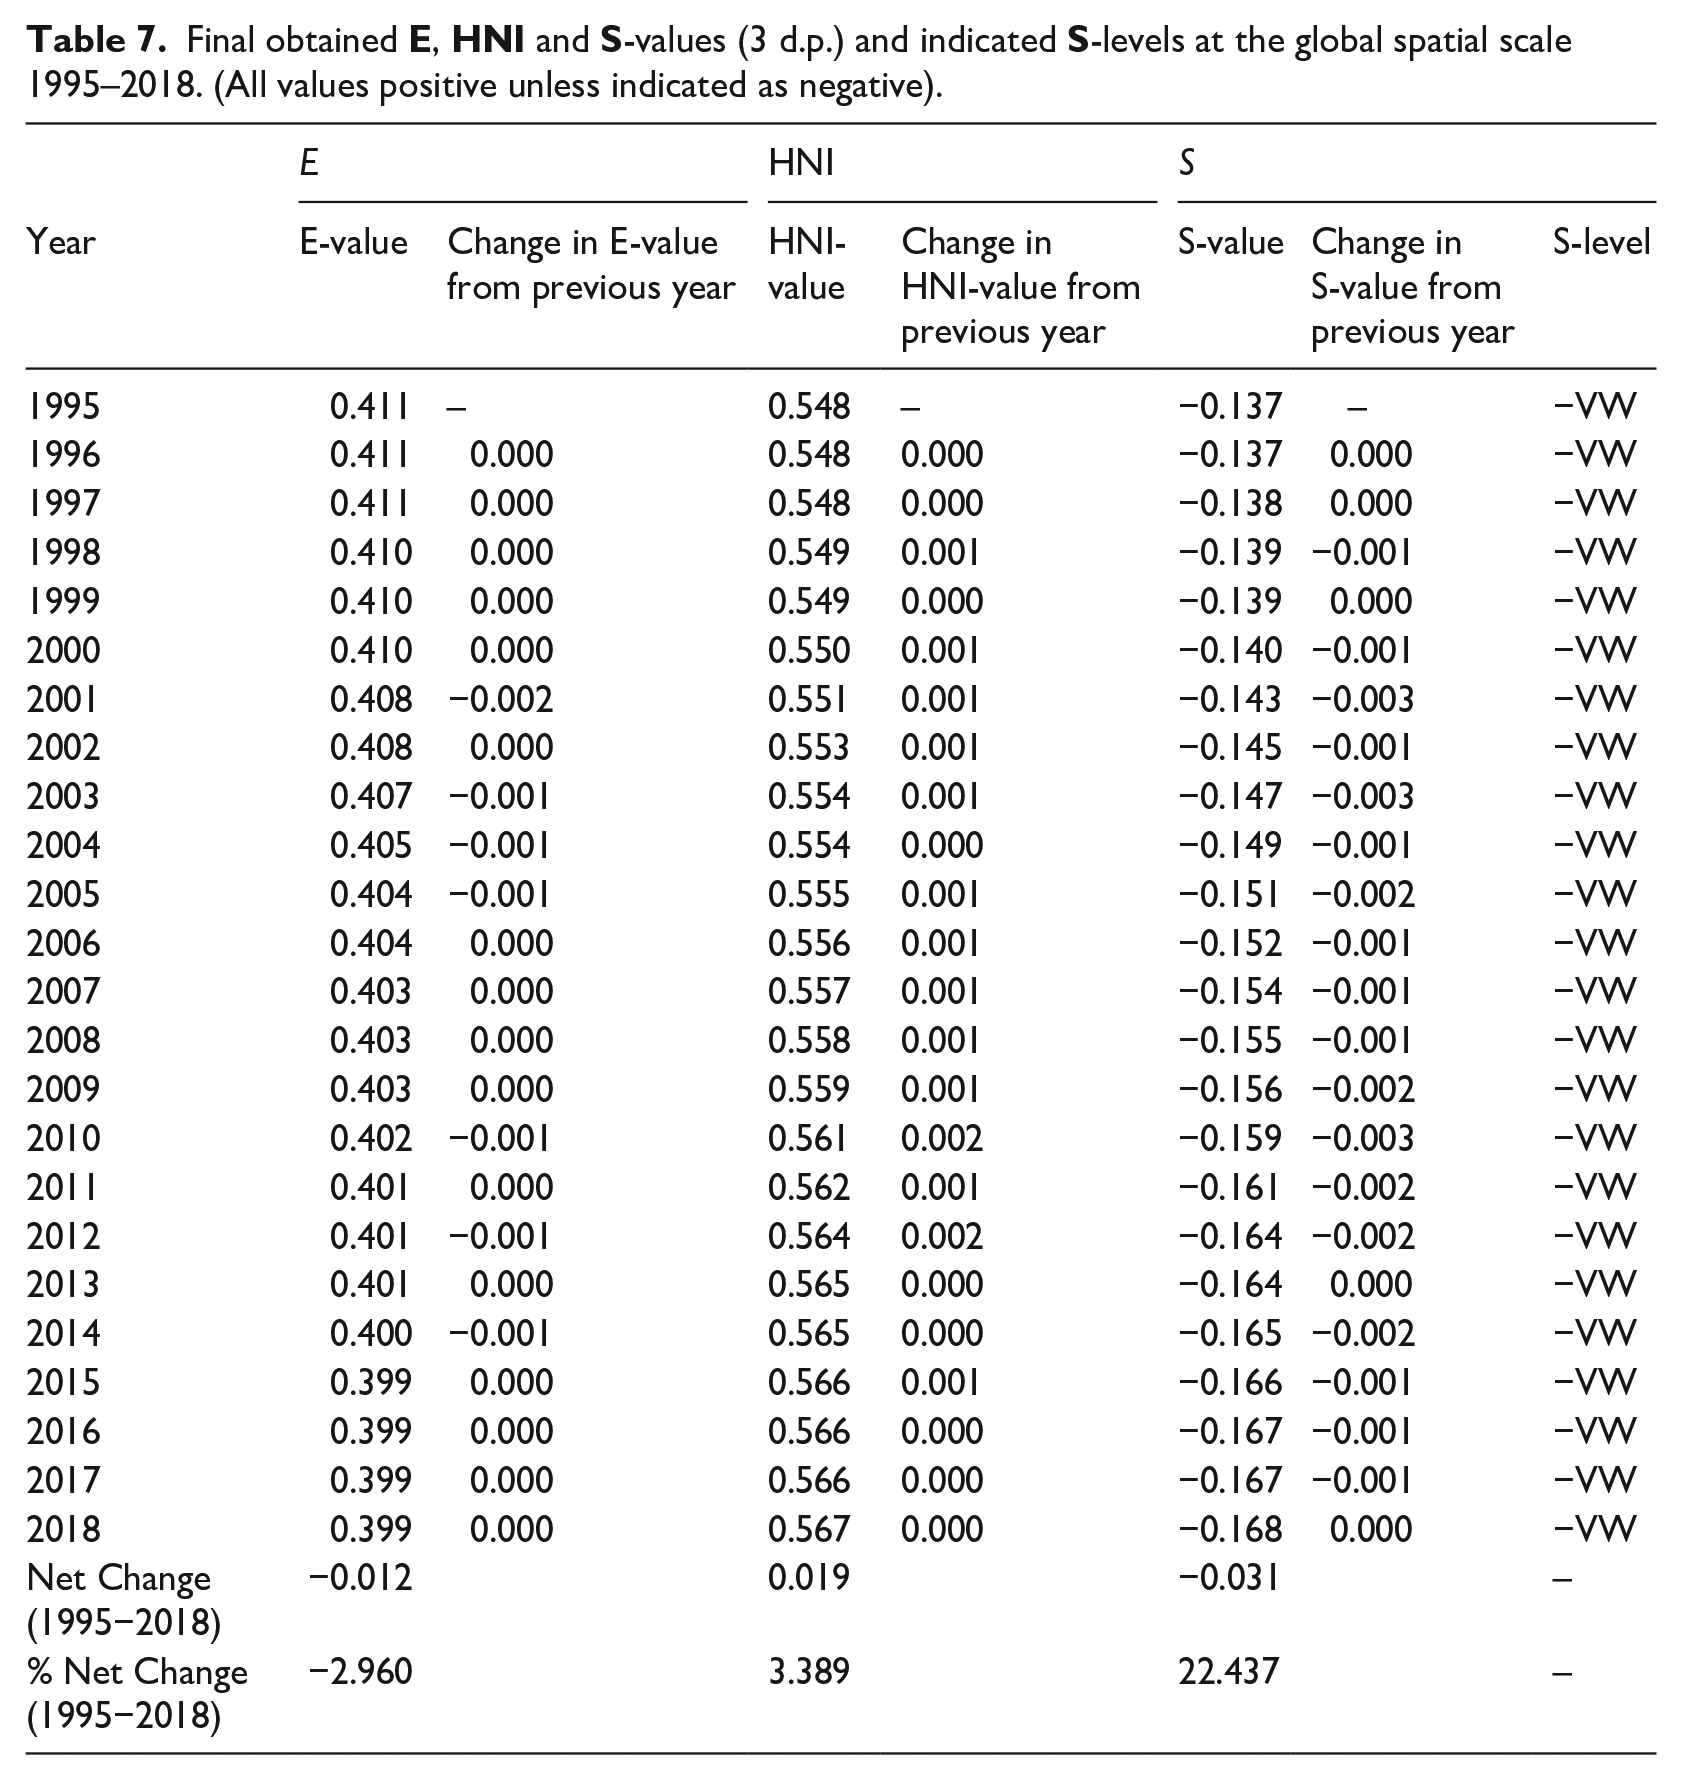
Final obtained
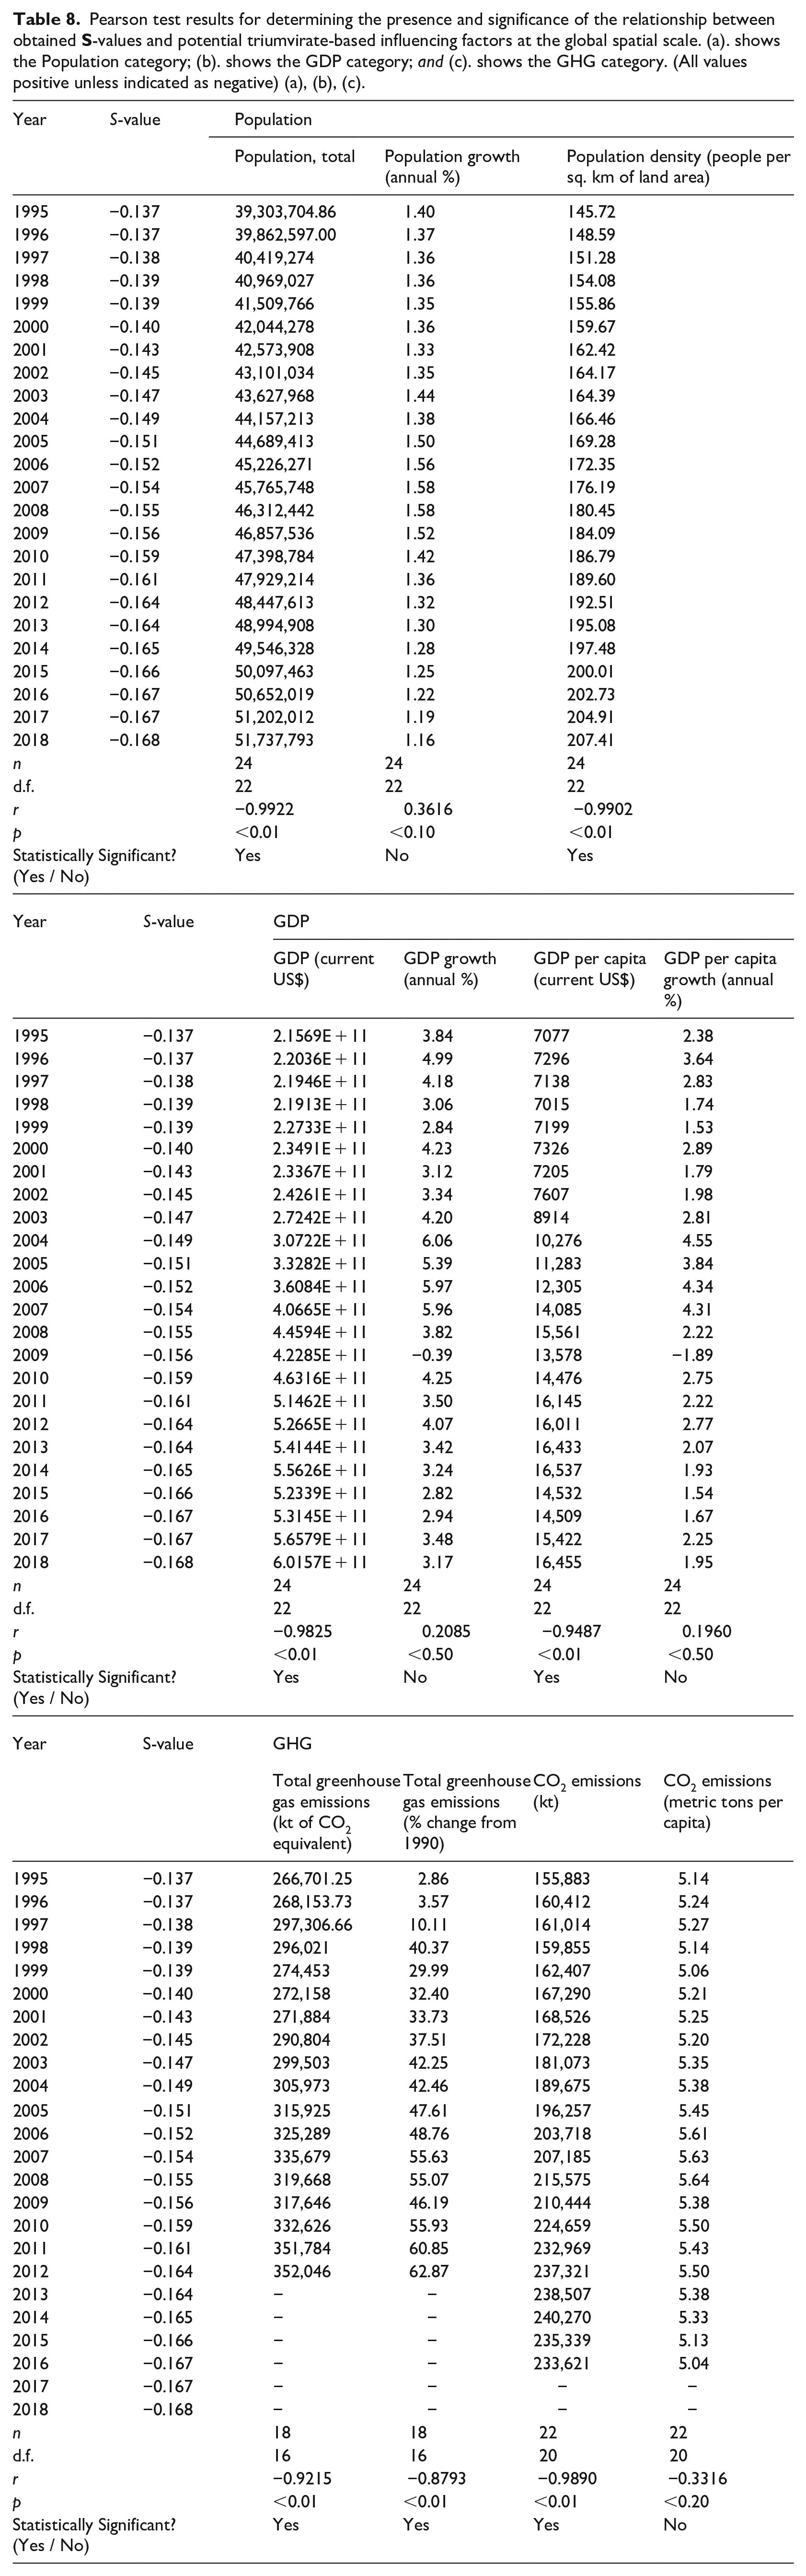
Pearson test results for determining the presence and significance of the relationship between obtained
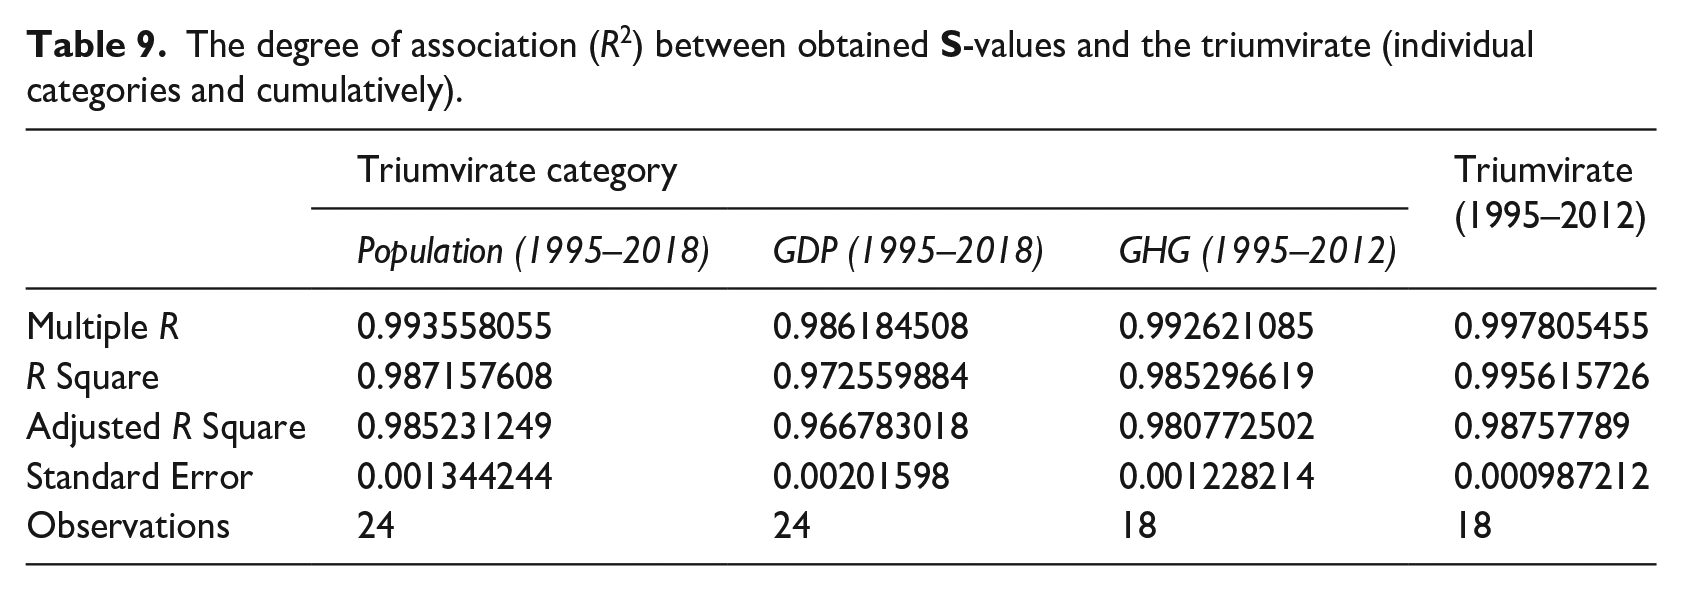
The degree of association (R2) between obtained
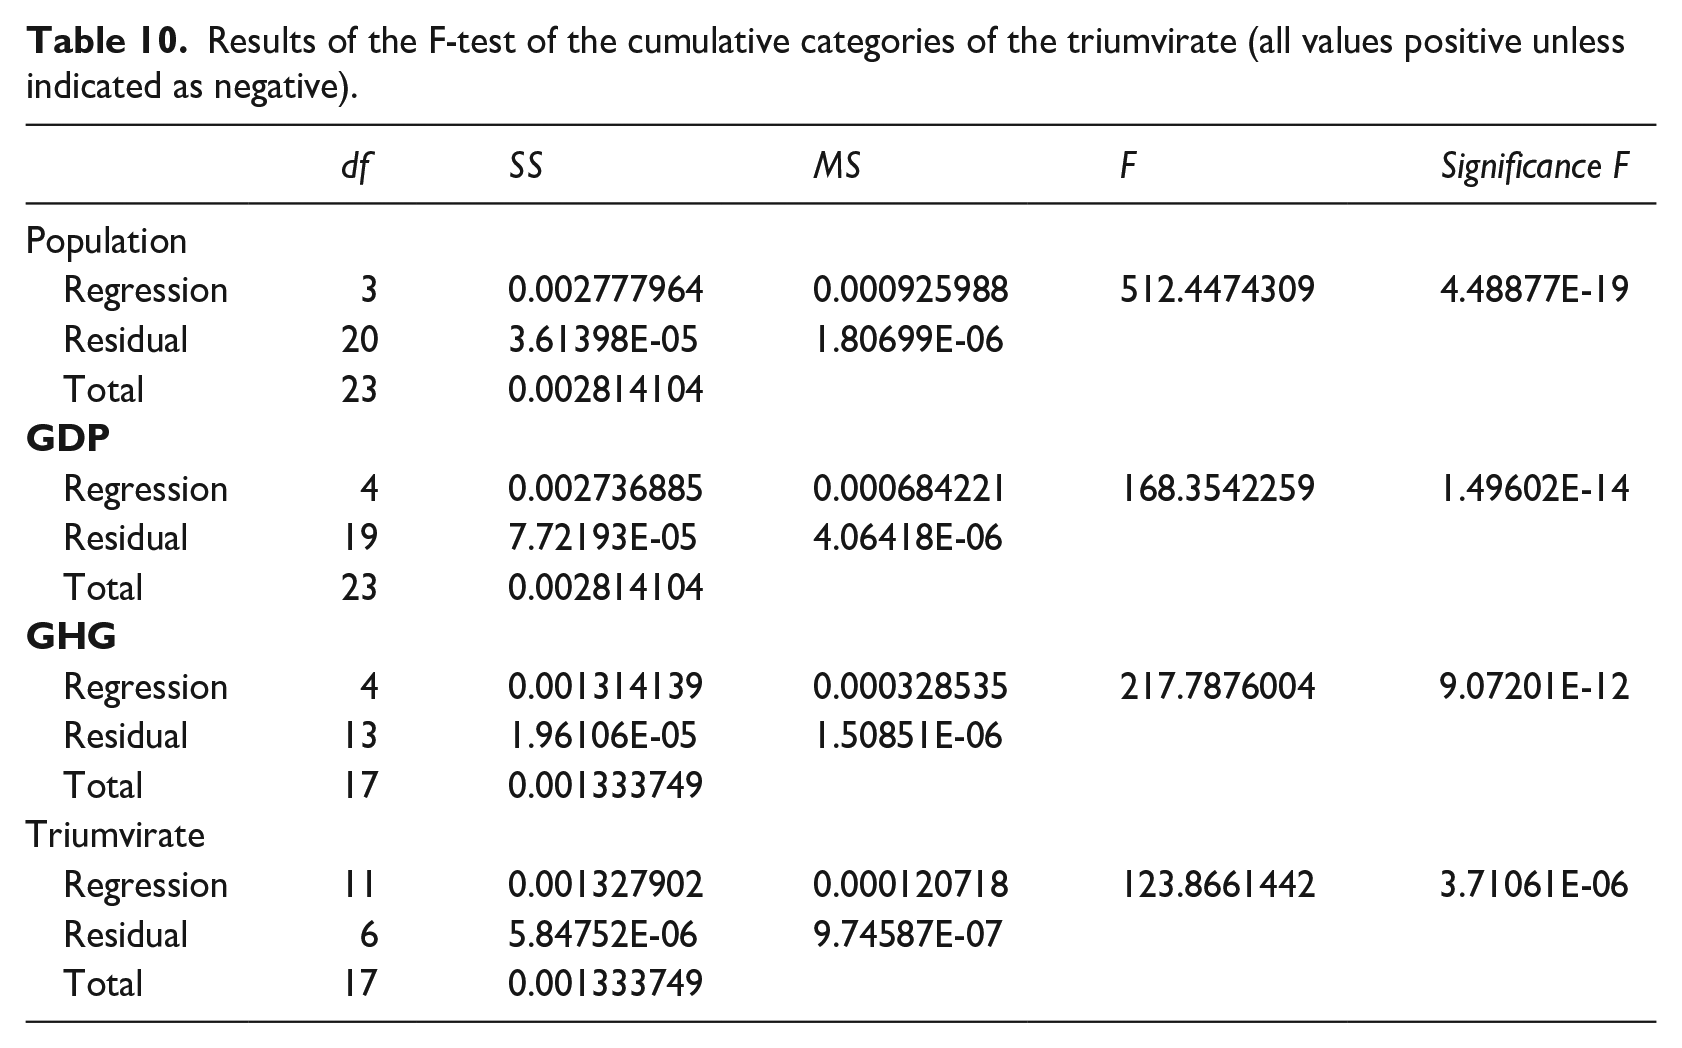
Results of the F-test of the cumulative categories of the triumvirate (all values positive unless indicated as negative).
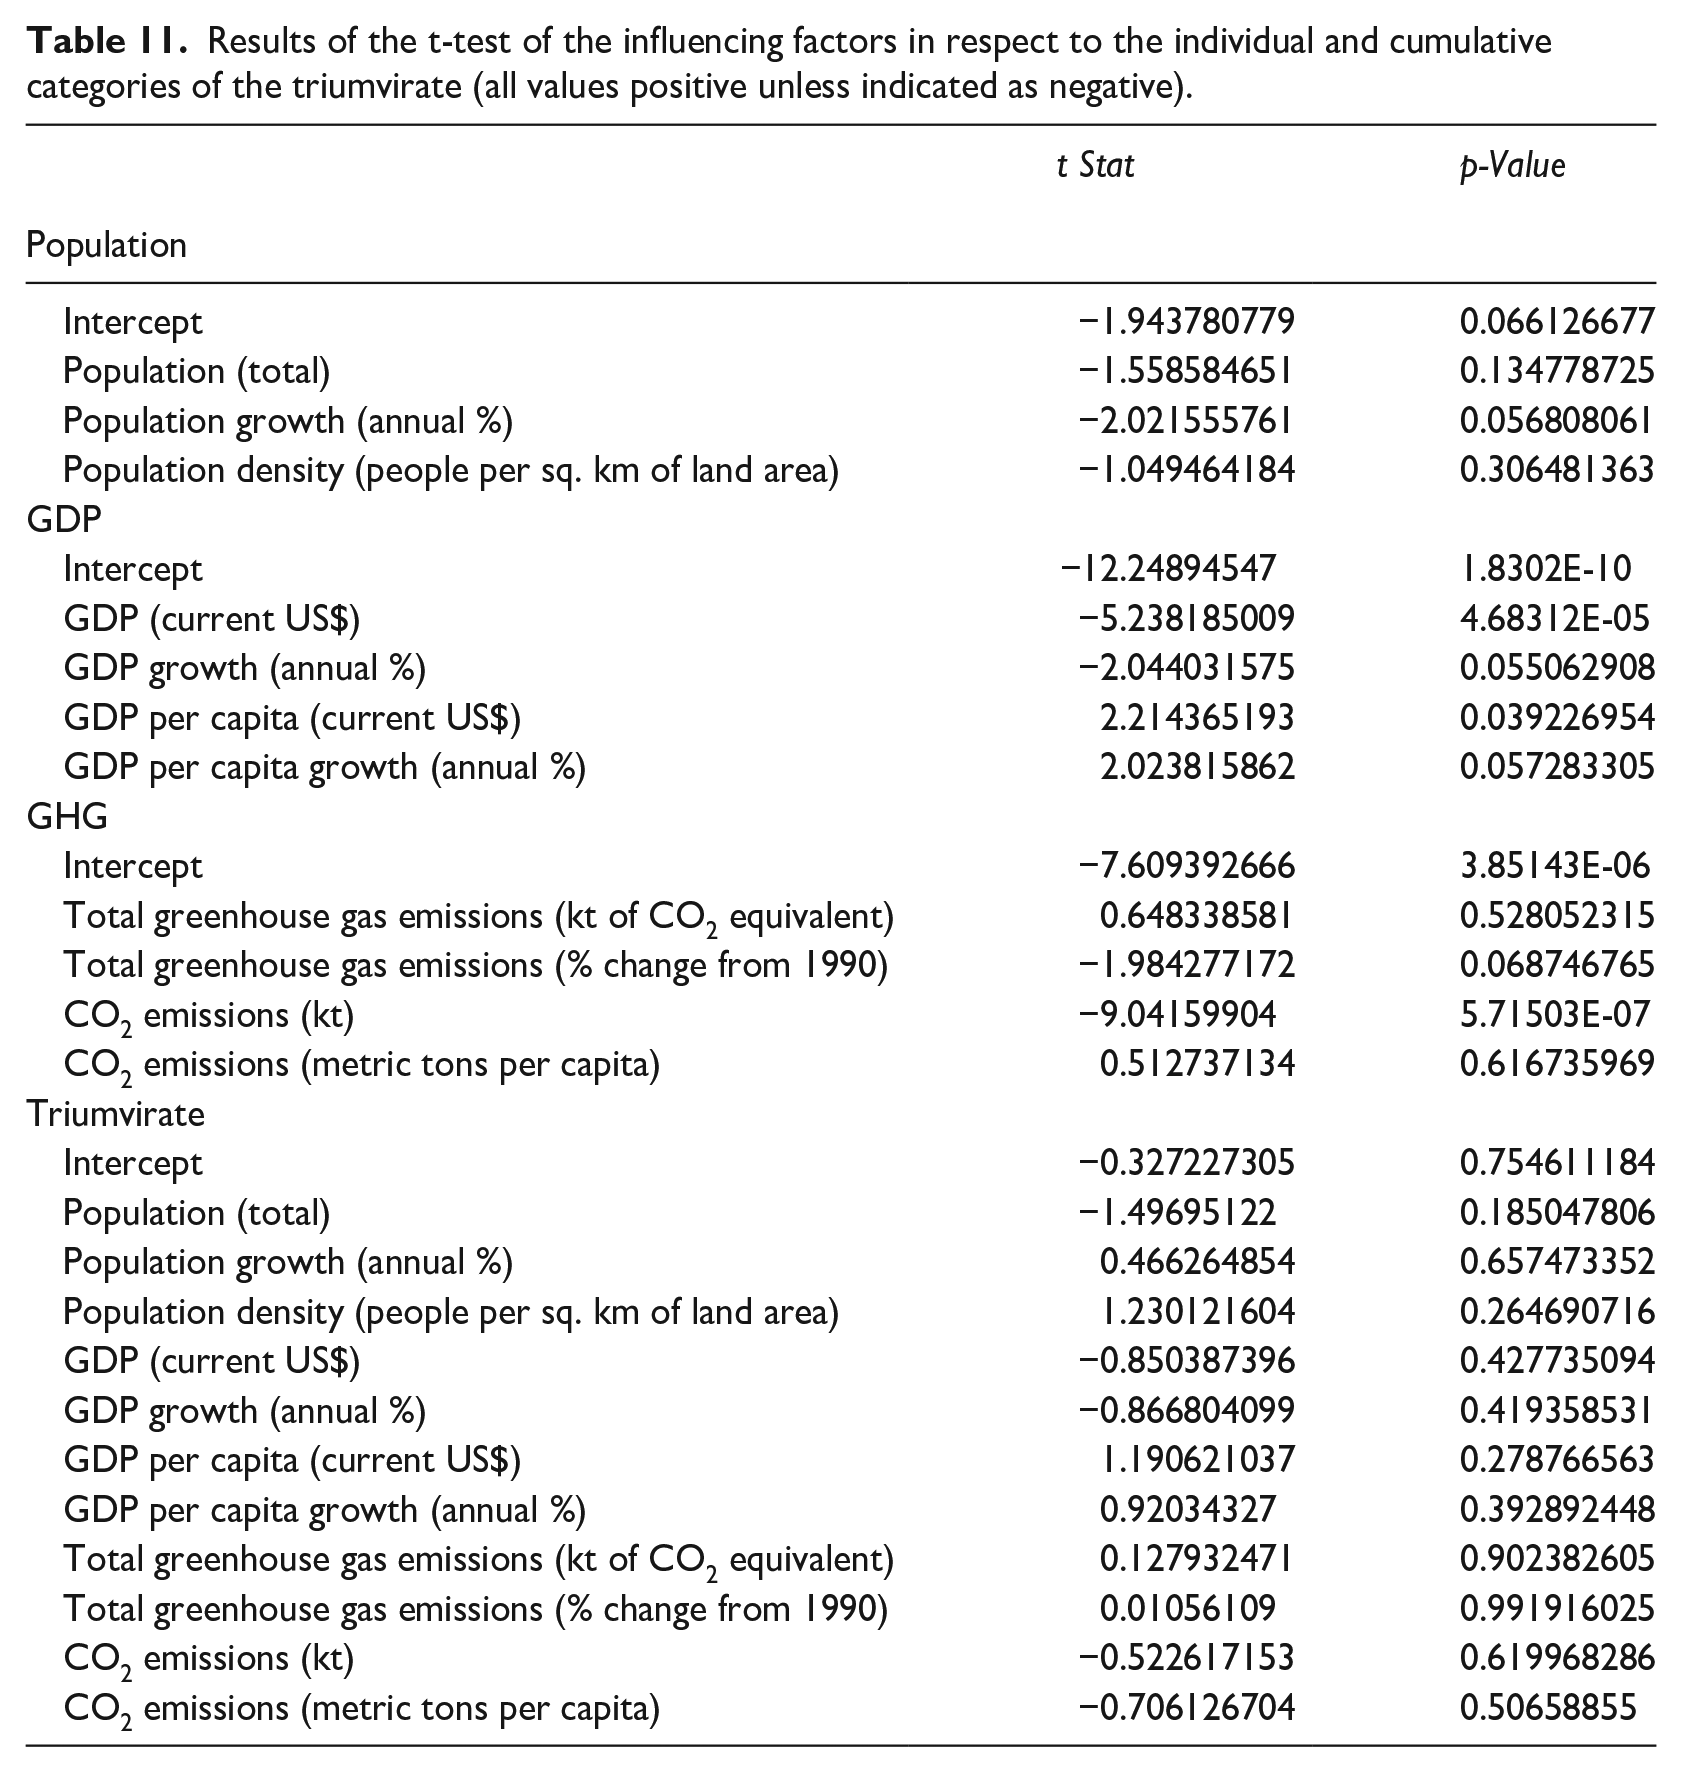
Results of the t-test of the influencing factors in respect to the individual and cumulative categories of the triumvirate (all values positive unless indicated as negative).
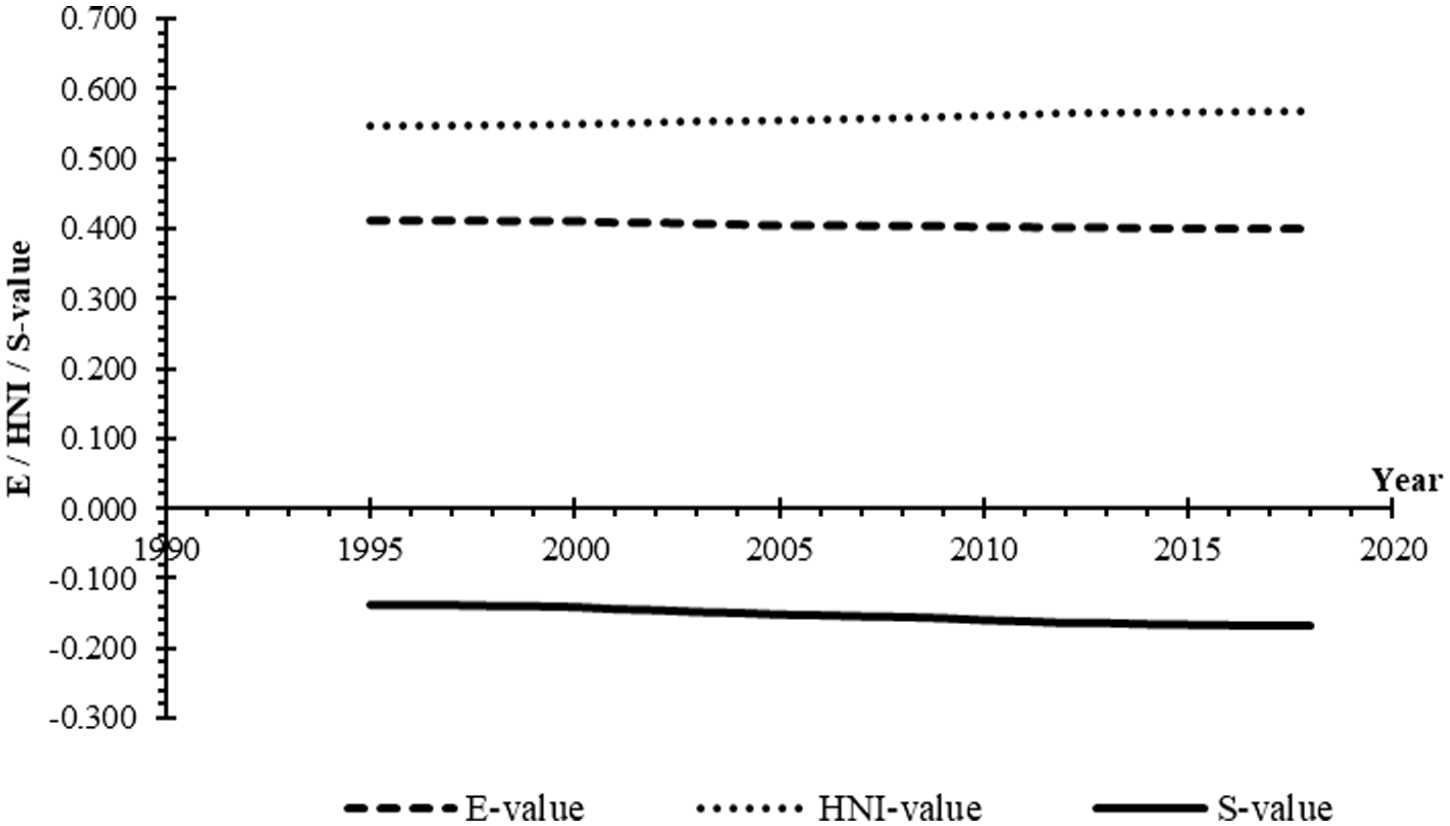
Graphical trends of obtained
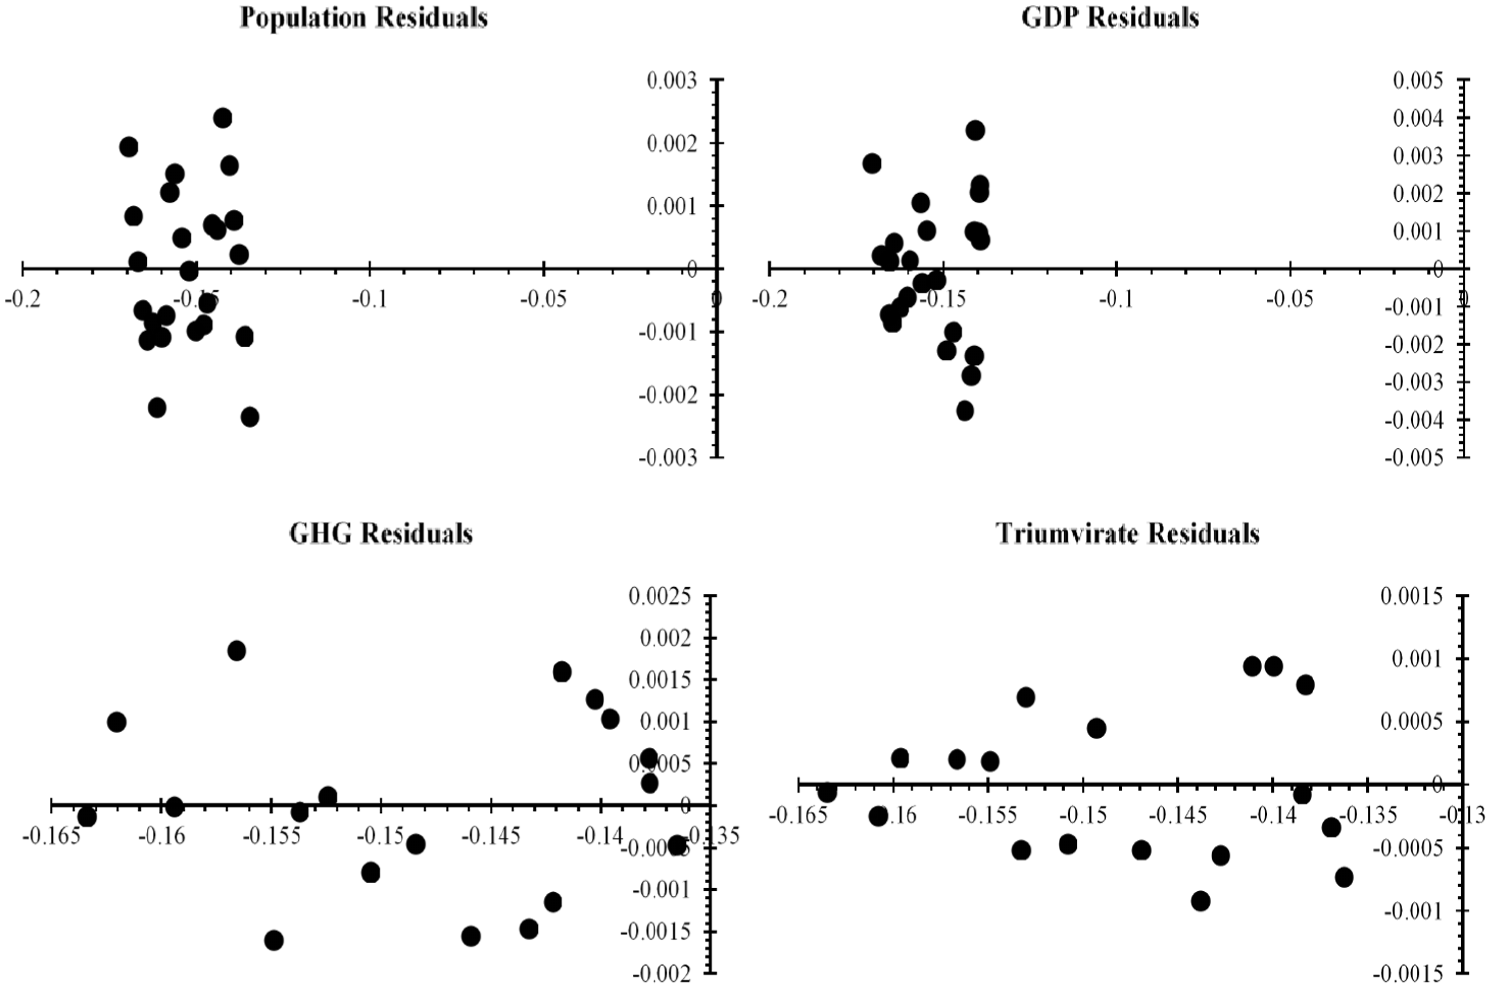
Residual plots for individual and combined categories of the triumvirate of potential influencing factors. The x-axis is the predicted residual, and the y-axis is the actual residual.
Discussion of results
Obtained S-values and S-levels
Based on the obtained global
As Table 7 and Figure 6 indicates, the obtained
The obtained indicated levels and nature of global sustainability over the specified period is dependent upon the obtained
Determination of potential influencing factors
The results of the potential influencing factors upon obtained
Determining the cumulative influences
Overview The influences of the triumvirate categories on an individual and cumulative basis was determined using simple linear multiple regression analysis. The results of the regression analysis are provided in separate tables and a figure, reflecting the components of the analysis and to assist in their discussion. The results obtained were as follows. The obtained R2-values are shown in Table 9. The results of the F-test are shown in Table 12, and the t-test results are shown in Table 11. Table 12 shows the results of the coefficients and confidence intervals, and finally Figure 7 shows the plots of the residuals.
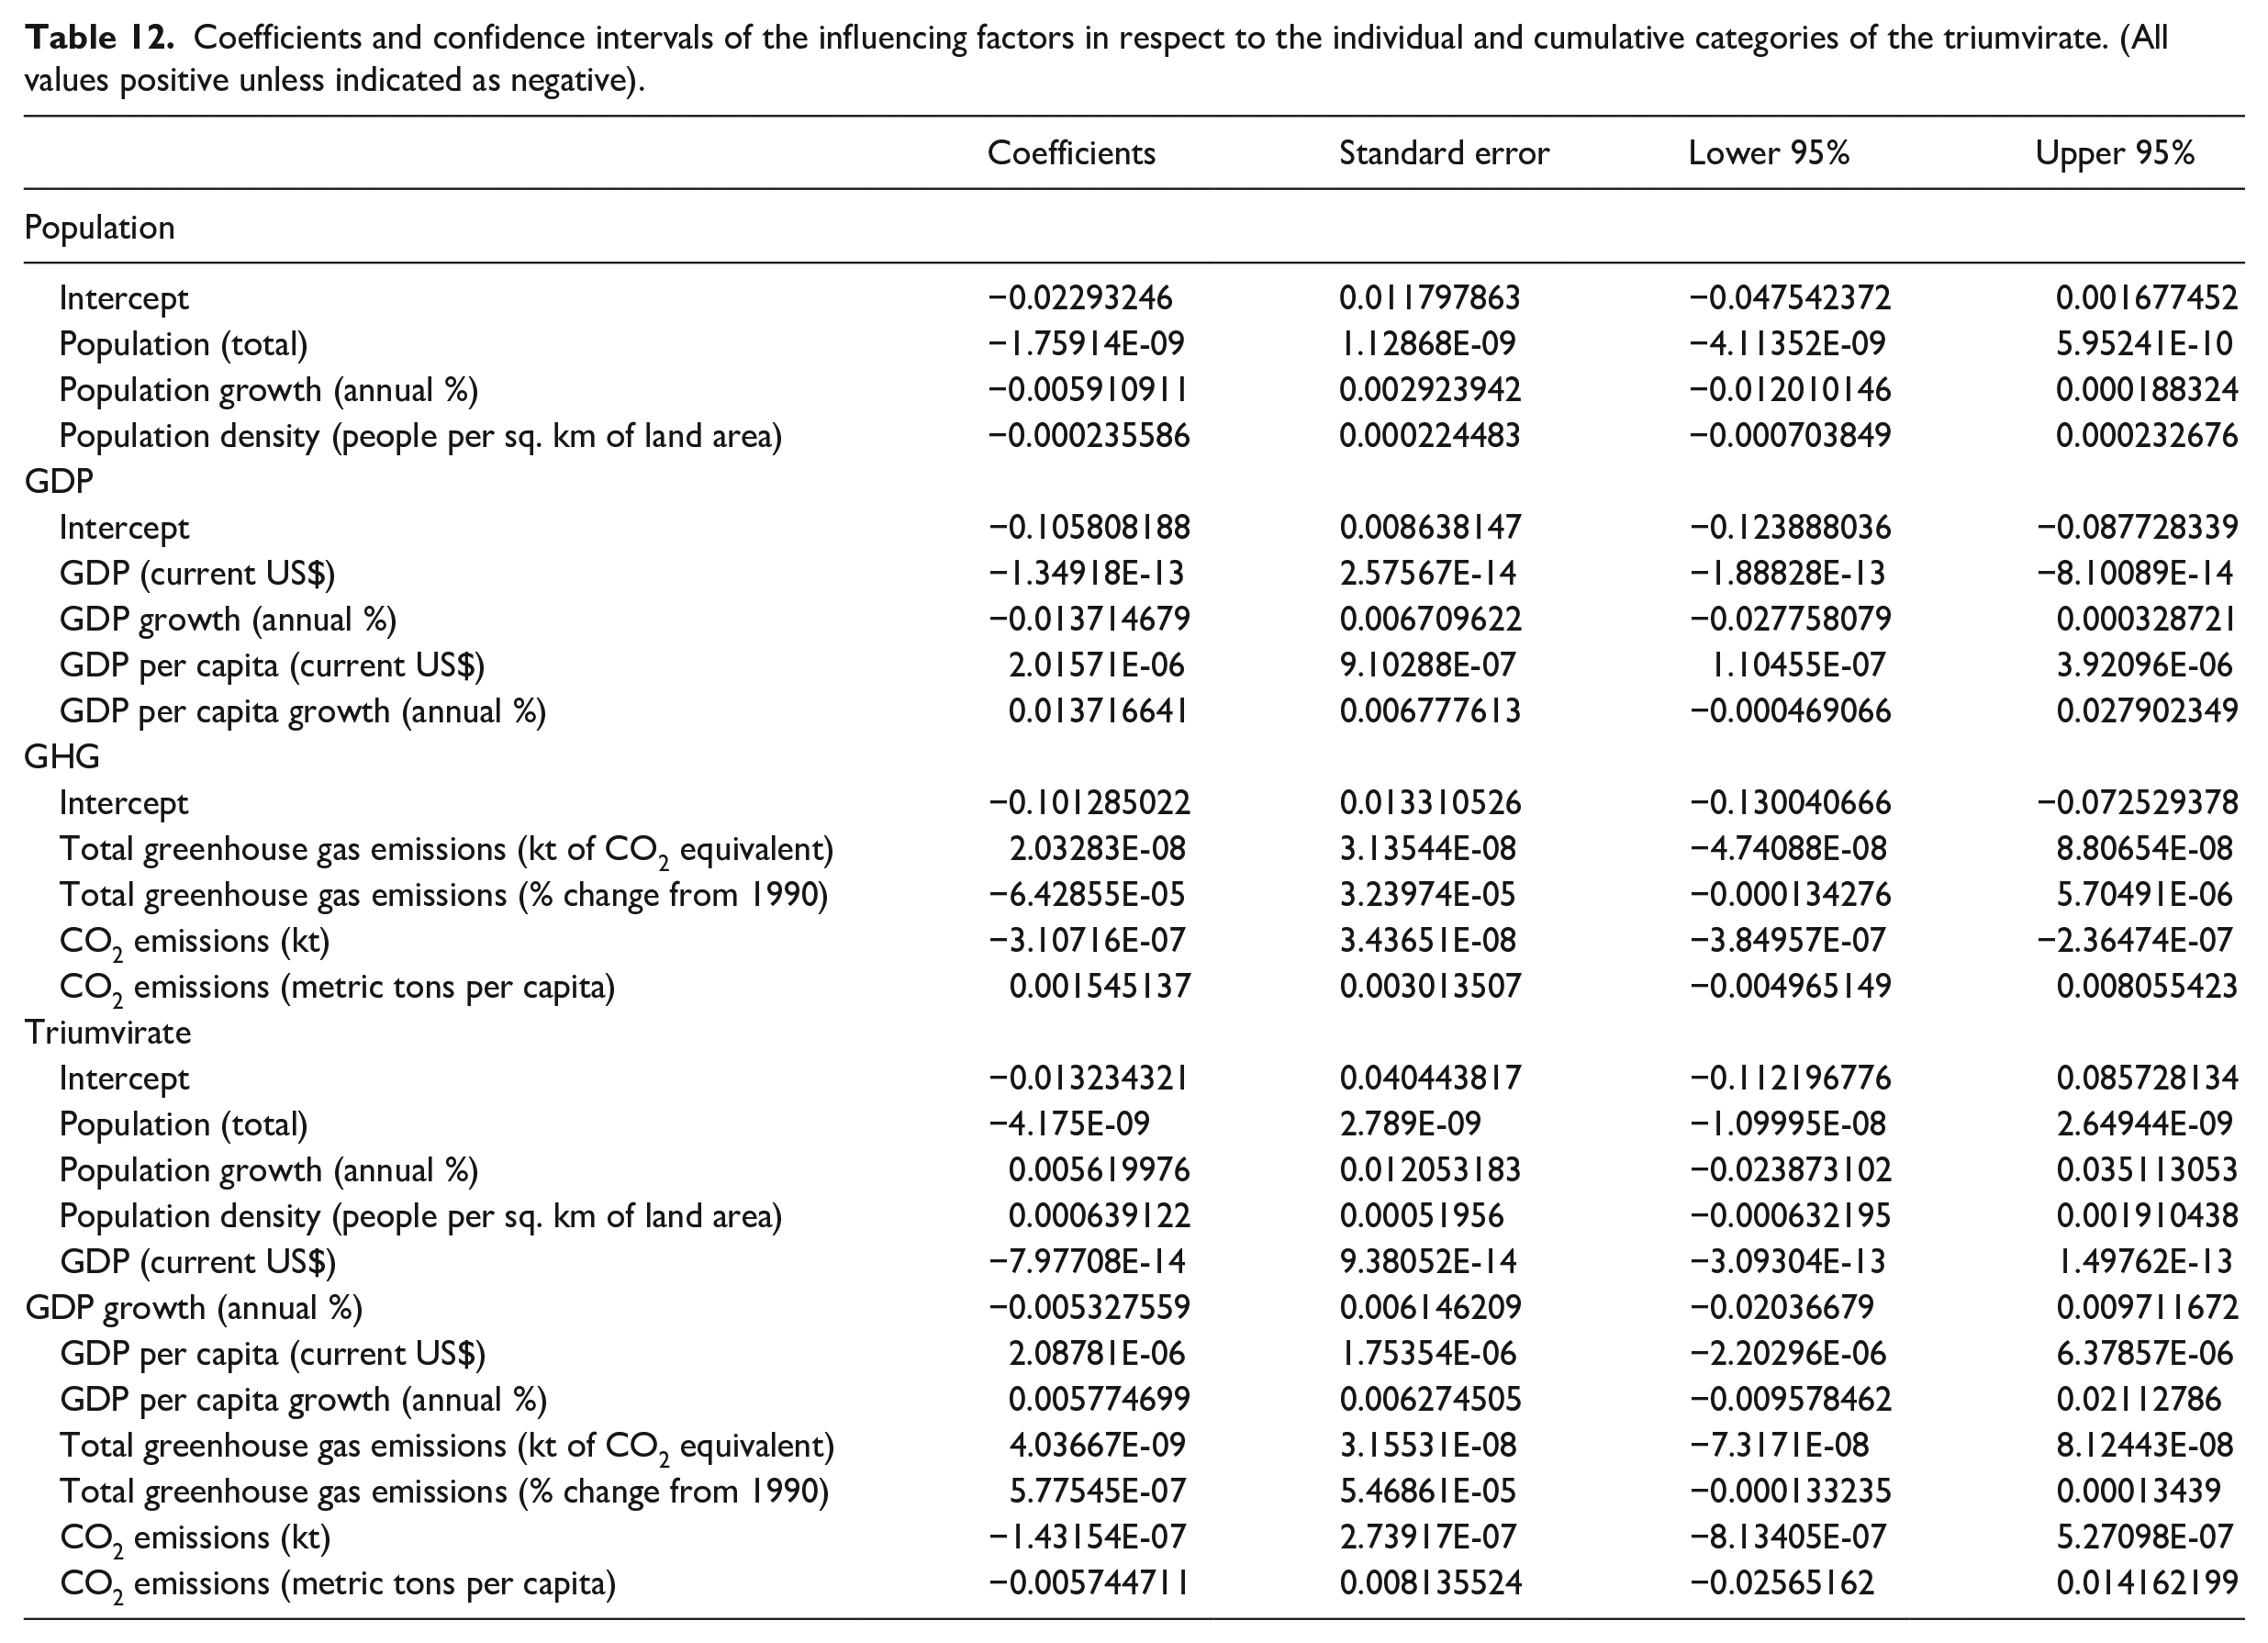
Coefficients and confidence intervals of the influencing factors in respect to the individual and cumulative categories of the triumvirate. (All values positive unless indicated as negative).
Obtained R2-values As shown in Table 9, all of the categories and the triumvirate had obtained R2-values within the range of [0.9726 ⩽ R2 ⩽ 0.9956] (4 d.p.). The highest obtained R2-value was for the triumvirate, and the lowest obtained R2-value was for the GDP category. In respect to the obtained R2-values for the triumvirate component categories, the indicated degree of association with obtained
Therefore, it is reasonable to conclude that the cumulative influence of the triumvirate, both in respect to individual categories and collectively, is negative in nature. Furthermore, the results indicate that the triumvirate categories individually and cumulatively have long-term detrimental impacts and influences upon the level and nature of the environment-human relationship and system. The obtained R2-values results, and the Pearson test results previously, have potentially established the triumvirate of influencing factors as a primary driving force upon the environment-human system and relationship. As a consequence, this detrimentally influences and determines sustainability outcomes at the global and all other spatial scales over time in the Anthropocene. This will be further determined in respect to the other components of the multiple regression analysis.
F-test and t-test Results: As Table 10 indicates, the obtained F-values for the individual and cumulative categories of the triumvirate were in the range of (123.8861 ⩽ F ⩽ 512.4474) (4 d.p.) at a significance level (p) of between (3.7106×10⁻⁶ ⩽p ⩽4.4888 × 10⁻¹⁹) (4 d.p.). Therefore, the null hypothesis that there is no relationship between obtained
In respect to the t-test results shown in Table 11, this indicates only two potential influencing factors were statistically significant. These were GDP (current US$) in the GDP category, and CO2 emissions (kt) in the GHG category. The t-value of GDP was −5.2381 (4 d.p.) with a significance value (p) of 4.6831 × 10⁻⁵ (4 d.p.), and CO2 emissions t-value was −9.0416 (4 d.p.) with a P-value of 5.7150 × 10⁻⁷ (4 d.p.). Therefore, in these two specific instances, the null hypothesis of no relationship between GDP and CO2 emissions with obtained
The results of the t-test of the significant majority of the potential influencing factors being statistically insignificant may be due to the nature of the data in the individual and cumulative triumvirate categories. This consequently potentially means that the t-test is an inappropriate test to determine their significance. Therefore, any final determination will be based upon the totality of the data obtained, and objective judgements concerning their validity and relevance.
Coefficients and Confidence Intervals: As Table 12 indicates, all but one coefficient in the individual triumvirate categories (Population GDP, GHG) were within the 95% confidence intervals. The only coefficient outside the confidence intervals of the individual categories was Total greenhouse gas emissions (% change from 1990). In respect to the cumulative category (Triumvirate), five of the 11 coefficients were outside the 95% confidence intervals. The six coefficients within the confidence intervals were population growth, population density, GDP growth, GDP per capita, GDP per capita growth and CO2 emissions. The coefficients results obtained indicate the following.
Firstly, that the influence of the potential influencing factors upon obtained
Secondly, that the potential factors of population growth, population density, GDP growth, GDP per capita, GDP per capita growth and CO2 emissions have the most significant influence and impact upon obtained
Analysis of Residuals: The plots of the predicted -v- actual residuals for the triumvirate categories are shown in Figure 7. In respect to the Population and GDP residual plots, both show a tightly compacted pattern with approximately equal points above and below the x-axis. In respect to the GHG residual plot, this is more evenly scattered above and below the x-axis. The residual plots for the individual triumvirate categories can therefore be considered as consistent with unbiased homoscedastic data.
In respect to the residual plot of the Triumvirate category, representing the cumulative category of the individual components, this indicates a different pattern trend. The pattern indicated is cone-shaped, increasing from the first residual point at approximately x = −0.165, and with approximately equal number of residual points above and below the x-axis, as the cone-shaped pattern increases in size towards the x-axis interval of −0.135. The triumvirate residual plot therefore would tend to indicate an unbiased heteroscedastic pattern. This is potentially because of the GHG residuals, as indicated in their residual plot, are unduly skewing the triumvirate residual plot. The reason for this may be due to the significant large numbers associated with the GHG category factors, as well as the degree of change (increase/decrease) which has occurred over the specified period. The Population and GDP categories tend not to have as dramatic changes occurring to their levels, unless there is an extreme event, such as a famine, pandemic, or the global financial crisis for example.
Therefore, the residual plots in Figure 7 have indicated that the individual triumvirate categories are unbiased and uniform in nature, whilst the cumulative triumvirate category is unbiased but skewed in nature due to the influence of the GHG category.
Dynamic analysis
Global dynamics
Based upon applying the SDF principles stated in Figures 2 and 4 to the results shown in Tables 5 to 12 and Figures 6 and 7, the indicated fundamental dynamics of sustainability occurring at the global spatial scale for the period 1995–2018, are as follows.
(i). The Environment & Societal Needs
(ii). Rate of Change (dE/dt) In Phillips (2020, 2022), the rate of change of the Earth System (dE/dt) (re: Gaffney and Steffen, 2017) in equations (2) and (3) has been discussed within the context of the stated principles in Section D of Figure 4b and equations (8) and (11) (Figure 4a). This has involved an objective judgement-based approach to evaluate the nature of dE/dt occurring and its impacts and effects, for example, lag effects, cause-effect mechanisms, feedbacks etc. However, in developing and discussing the results obtained in this study, it has been possible to make some significant advances in the evaluation of dE/dt by the determination of the net change of obtained
To determine the nature of dE/dt occurring at the global spatial scale, it is necessary to determine and evaluate the dynamic trends and characteristics occurring in respect to net changes in
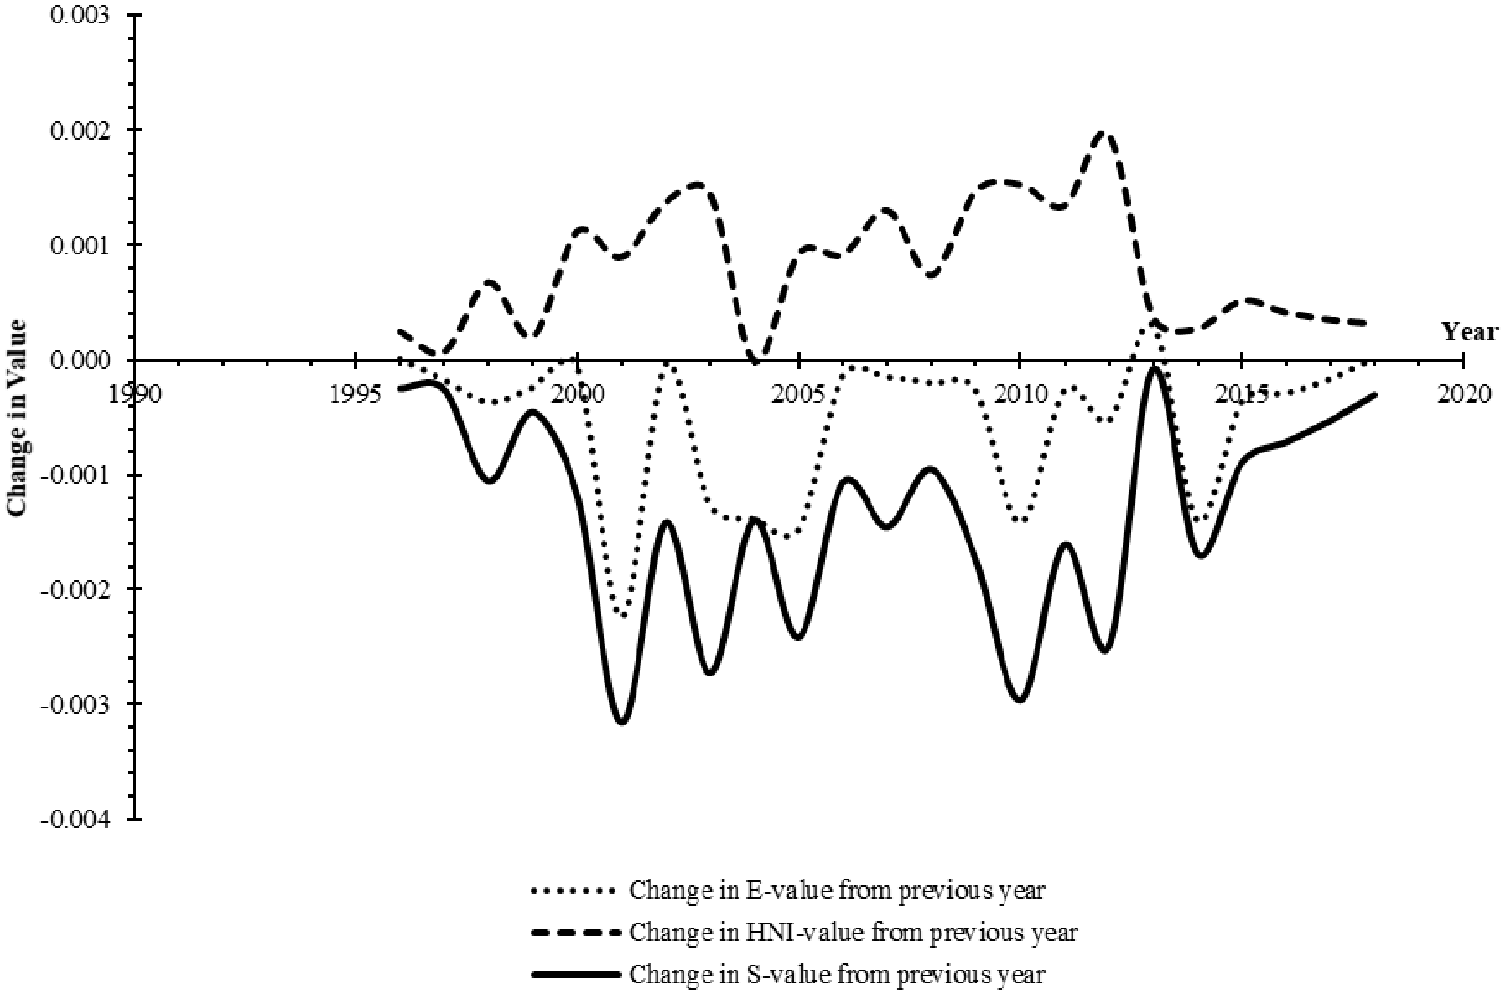
Net change in obtained
As Figure 8 indicates, there are three potential dynamic trends occurring over the specified spatial-temporal scale. Firstly, there are indications of cyclic trends in
Secondly, Figure 8 indicates that the change in obtained
Thirdly and finally, the peak net change in obtained
These two distinct mechanisms reflect the potential dynamic operation of the environment-human system and relationship. Which of these is the primary or sole dynamic interaction mechanism in operation may require a further longer period than evaluated to determine with clarity and certainty. However, if the period of 2011–2018 is removed from consideration because it is indicative of the extreme event of the 2008 global financial crisis, then it is possible to tentatively consider the potential typical dynamic mechanism occurring in respect to the global environment-human system and relationship.
Consequently, based upon the normalized data spanning the period 1995–2010, it is indicated based upon Figure 8 that the environment (
Therefore, the rate of change of
Based upon the evaluation conducted of dE/dt, it has been potentially determined quantitatively and dynamically that a lag cause-effect mechanism operates in respect to
(iii). Determining the Dynamic Processes As just indicated, Fourier analysis was applied to determine the potential or actual presence of dynamic processes in the determination of the level and nature of sustainability at the global spatial scale, due to the level and nature of the environment-human relationship and system over time.
Fourier analysis is a mathematical analytical technique which attempts to identify patterns or cycles within a data series over a specified time period. It has multiple applications such as in physics, number theory, statistics and probability, optics, oceanography, image processing and cryptography to name a few. Fourier analysis has been applied in respect to environmental and sustainability-based case studies such as in Pata (2021), Wagenseil and Samimi (2006), Luan et al. (2018), Logan et al. (2010) and Bush et al. (2017), in order to determine cyclic processes. However, these and others have been case-specific to a defined area, issue, topic and/or environmental system, for example, agricultural sustainable development, weather/climate, tropics etc. Fourier analysis has not been applied however to determine the potential or actual dynamic processes occurring which influences or impacts upon the level(s) and nature of sustainability at any specified spatial-temporal scale. A potential reason for this may be due to insufficient data indicating the levels of the environment, the levels of impacts from humanity’s activities and needs, and the indicated level(s) of sustainability occurring at a specified spatial-temporal scale. This study however has generated sufficient data so that Fourier analysis is an appropriate and viable technique to determine potential fundamental dynamic processes occurring. Furthermore, Fourier analysis is a potentially valuable addition to the SDF methodology in the determination and evaluation of the dynamics of sustainability occurring at any specified spatial-temporal scale.
In respect to the use of Fourier analysis, the fundamental dynamic relationship that it determines, in respect to Figure 2 can be mathematically described as follows:
Therefore, using the obtained data of the net change of
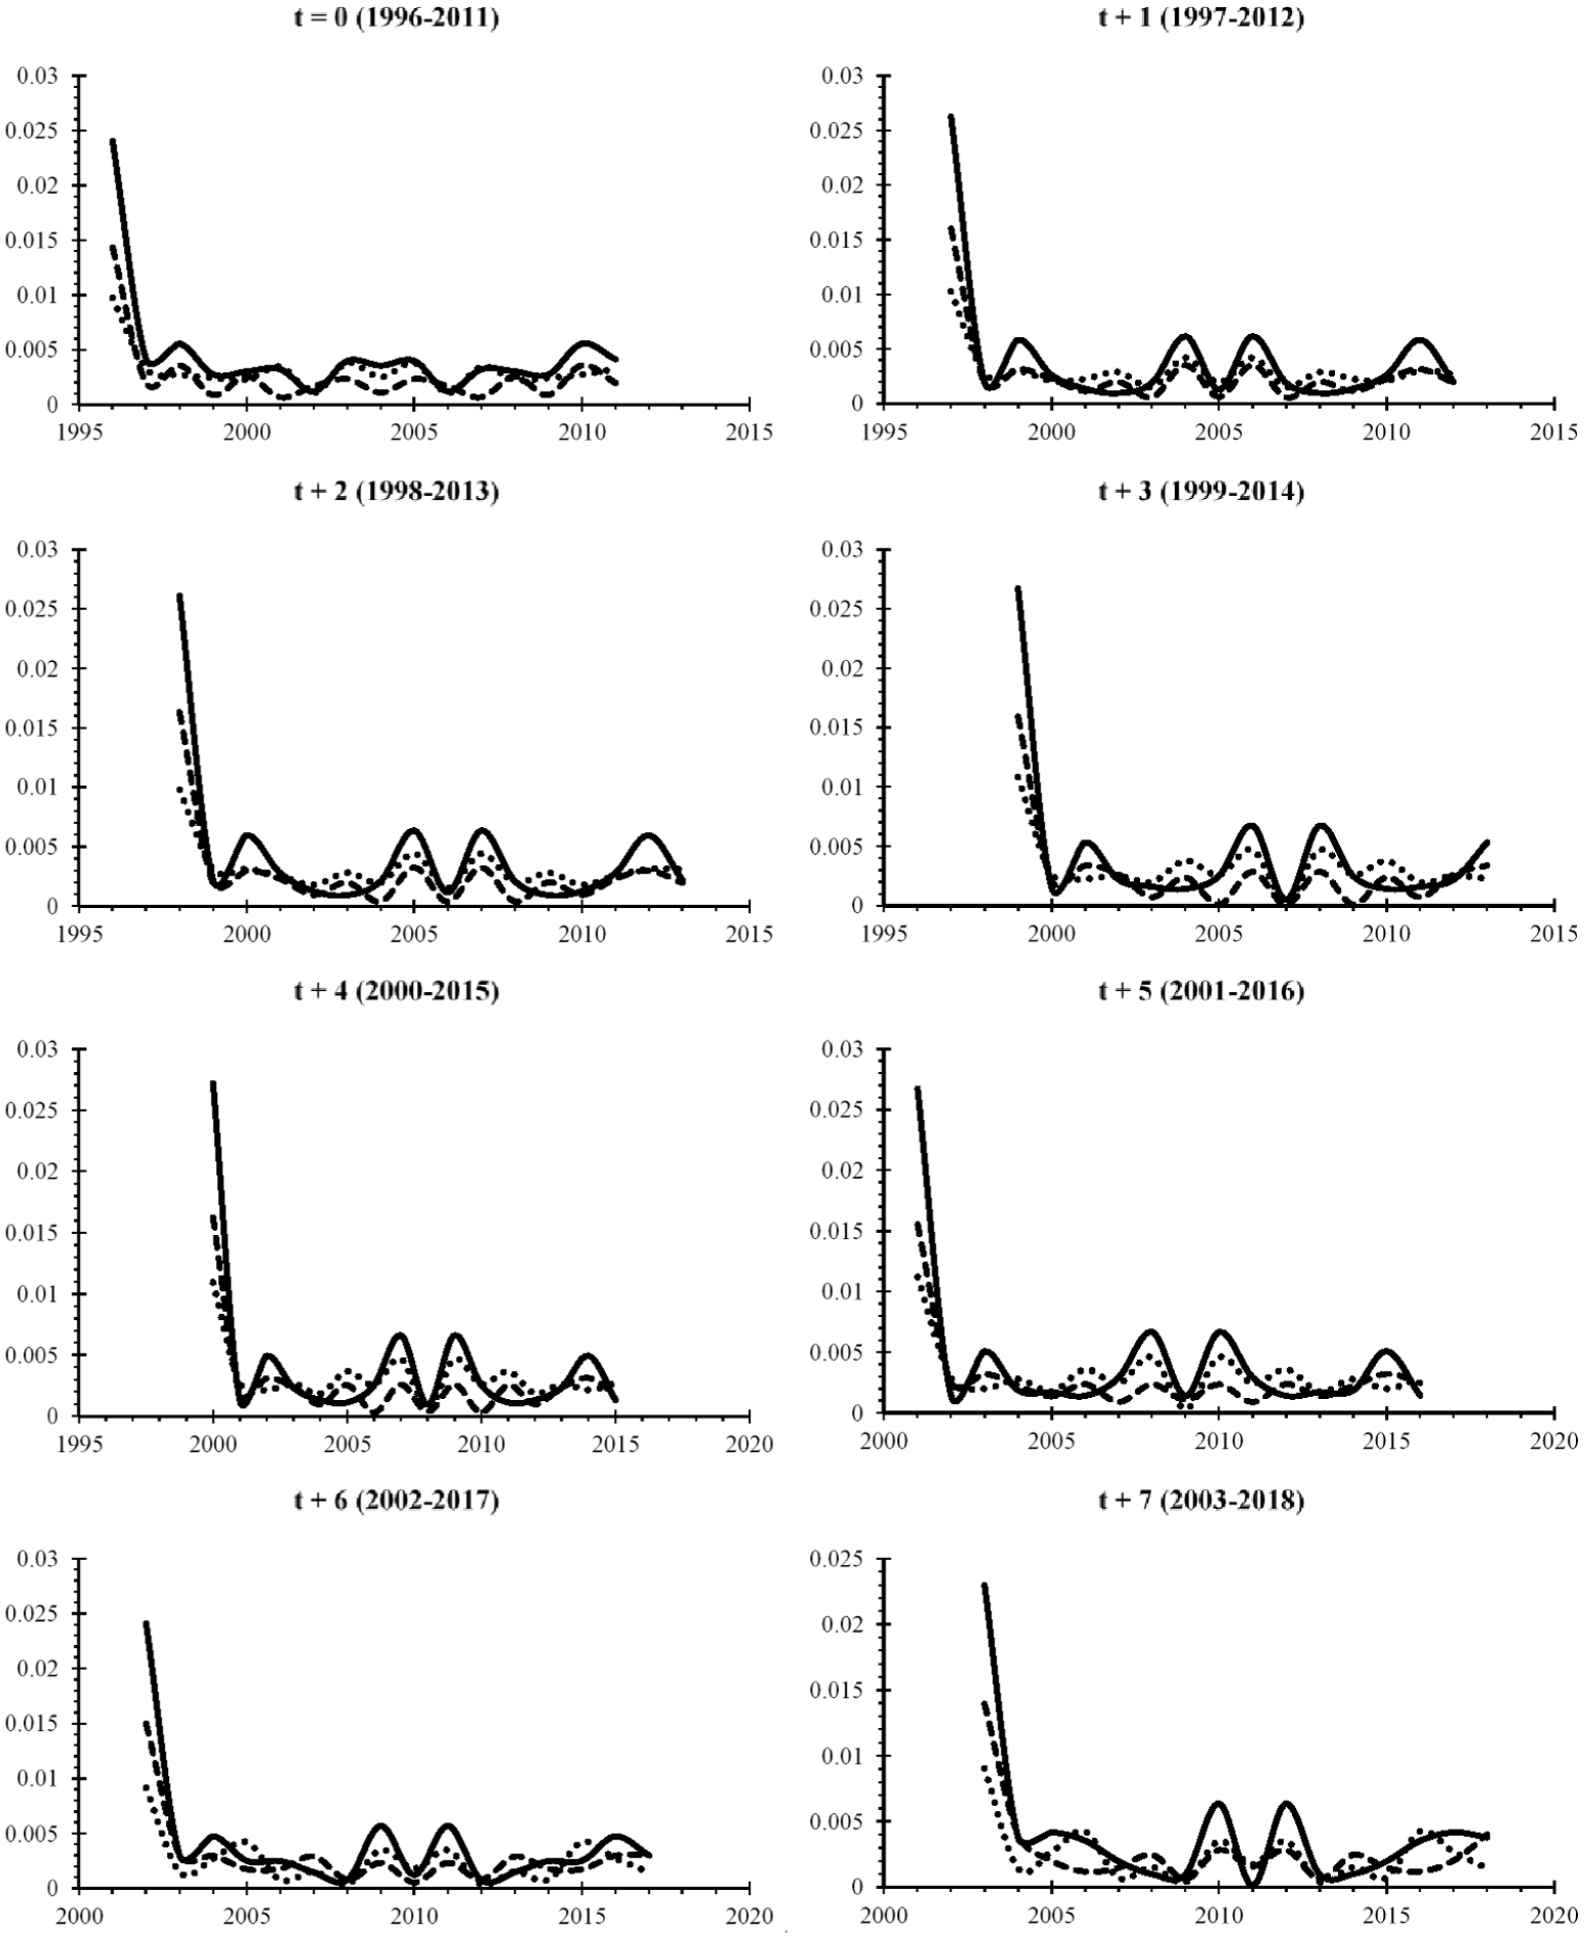
Fourier transformation graphs of net change of
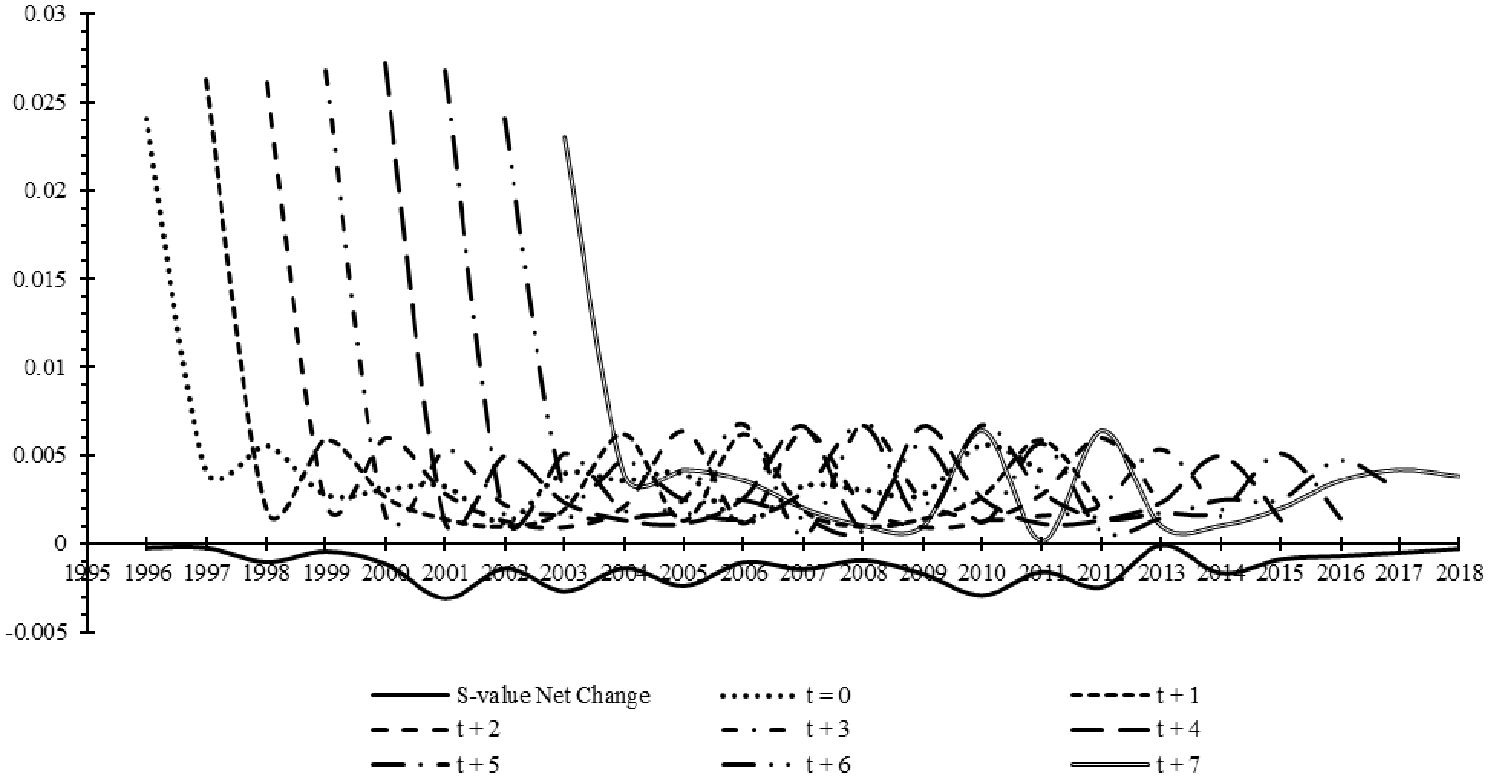
Composite plot of Fourier transformation net change in
As Figure 9 shows, there are clear indications of a definitive pattern in all of the time series plots in respect to the Fourier transformation of net change in
Consequently, this potentially indicates, in conjunction with the
Figure 10 indicatively shows the individual Fourier transformation time series plots on a single composite graph, along with the trendline of the original net change of
As indicated in Figure 10, there are two potential clearly defined periods of significant net change in
Therefore, given that the obtained indicated values of
(iv). Role of the Triumvirate As indicated earlier, the triumvirate of influencing factors, both individually and cumulatively, have a significant role in influencing the level and nature of sustainability at the global spatial scale over time. Because of the dominance of these factors is negative in nature, as indicated earlier and in Table 8, this reciprocally means that their influence upon levels of sustainability is also negative. Consequently, this has meant they have a detrimental influence and impact over time upon the nature of the environment-human system and relationship.
In dynamic terms, the fundamental influence and impacts of Population, GDP and GHG (
The obtained
However, of greater potential significance is in relation to equations (2) and (3) of the Anthropocene Equation theory (re: Gaffney and Steffen, 2017), and in respect to Earth System Analysis (re: Schellnhuber, 1998) as shown in equation (1), both of which are component theories of the SDF.
In essence, the results obtained in Tables 5 to 12 and Figures 6 and 7 are consistent with equations (3) and (11) (Figure 2), and thus reflects the dominance of the anthroposphere upon the environment-human relationship. Furthermore, the results obtained indicate that current management and mitigation of humanity’s impacts upon the environment at the global spatial scale, in respect to
In summary, the triumvirate has a definitive detrimental role and influence upon the level(s) and nature of sustainability occurring at the global spatial scale over time. The triumvirate has strongly influenced and even induced unsustainability to occur at the global spatial scale over a prolonged period of time. This is because of the long-term impact upon the environment from anthropogenic activities and needs. As a consequence, this indicates that unsustainability at the global spatial scale has potentially existed for considerably before the specified period, and that optimum system thresholds have been potentially breached to a significant degree.
(v). The Dynamics of Vulnerability-Sustainability The results obtained and shown in Tables 5 to 12 and Figures 6 and 7, as well as the analysis conducted thus far, have strongly indicated the continuing and increasing vulnerability of the global environment-human system and relationship. This has resulted in unsustainability occurring, which has persisted for a considerable period of time. As a consequence, this demonstrates that there is a quantitative and dynamic relationship between vulnerability and sustainability at all spatial-temporal scales. The reason for this is because of the degree of vulnerability occurring at any specified spatial-temporal scale, significantly influences the level and nature of sustainability at the same scale. Specifically, as the level(s) of societal needs are fulfilled by anthropogenic activities (
A simple conceptual visualization of the current indicated dynamic process of the environment-human system and relationship and its potential outcomes at the global spatial scale.
Therefore, the greater the level of dE/dt, the greater the deterioration of the environment-human system and relationship, and thus the greater the level of vulnerability and unsustainability occurring at any specified and/or all spatial-temporal scales. The presence of vulnerability and unsustainability within the global environment-human system and relationship is strongly indicative of an anthropospheric-dominant relationship as opposed to a co-evolutionary relationship. An anthropospheric-dominant relationship, and the resultant vulnerability and unsustainability, is consistent with equation (3) and equation (8) (Figure 2a). A co-evolutionary relationship, and the resulting resilience and sustainability occurring, is consistent with equations (2) and (5) (Figure 2a). Therefore, the continuation and increase in the vulnerability of the global environment-human system and relationship, and the resultant unsustainability occurring, presents significant and potential realistic risks to human society and activities. Specifically, through the further deterioration of the environmental system and the occurrence of species extinction and systemic failures, which increases the potential risks of the collapse of the global environment-human system. The results and analysis presented and discussed certainly indicates that these risks are potentially realistic, unless urgent measures are undertaken to correct the current dynamic global environment-human pathway of vulnerability-unsustainability.
Summary of outcomes and conclusions
The study has indicated that the levels and nature of sustainability at the global spatial scale over the specified period 1995–2018 was consistent with very weak unsustainability occurring. This is due to the inducement and entrenchment of vulnerability of the global environment-human system and relationship, and thus resulting in unsustainability occurring. As a consequence, this reflects and indicates the environment-human relationship at the global spatial scale is anthropospherically-dominant as opposed to co-evolutionary. The occurrence and entrenchment of vulnerability and unsustainability has been strongly indicated to due to the role and impact of the triumvirate of influencing factors on an individual and cumulative basis upon obtained
The results obtained have strongly indicated the presence of global unsustainability over the specified period, and that this has occurred considerably before the specified period. Global unsustainability has been significantly influenced by the triumvirate (Population, GDP and GHG) due to their rapid increase in fulfilling societal needs. This has consequently resulted in system thresholds being breached, and thus causing the vulnerability of the global environment-human system and relationship. This reflects the transformation of the environment-human system and relationship from co-evolutionary to anthropospheric-dominant, consistent with the stated mathematical definitions and principles of the SDF and its component theories. Furthermore, using Fourier analysis for the first time within the SDF application methodology, the cyclic dynamic processes of humanity’s impact and influence upon the environment at the global spatial scale have been indicatively determined.
Therefore, this study has highlighted the urgency of the potential fate that humanity finds itself facing. Humanity’s future has always been its own hands. The results and analyses of this study have indicated the consequences of humanity’s actions and inactions, which have resulted in increasing vulnerability and unsustainability of the global environment-human system and relationship. Unless humanity starts and continues to operate within the safe thresholds of the planetary system, then the results indicated in this study will continue to worsen until there is only one inevitable outcome for the environment and humanity - extinction. It is not too late to change humanity’s pathway and return it to a co-evolutionary relationship with the environment. It will require considerable long-term global co-operation, co-ordination, discipline and sacrifice at all societal and governance scales to achieve - However, the most important things always do.
The planetary alarm bells are ringing and have been for some considerable time - It is time for humanity to wake up and hear them, and to take the necessary and urgent actions to ensure humanity’s and the planet’s continuation and survival. Therefore, humanity now needs to truly and deeply ask itself: ‘What kind of a world do we want? and What must we do to get there’ (Blackburn, 1992; Clark, 1989).