
Abstract
A San Francisco Estuary core was analysed at high resolution to assess its component stratigraphic signatures of the Anthropocene in the form of non-native species, Hg, spheroidal carbonaceous particles, δ13Corg, δ15N, radiogenic materials, and heavy metals. Time series analysis of the core using Ti data provides a chronology to depth 167 cm into the 1960s. Below this, to depth 230 cm, the lowermost part of the core may extend to the 1950s or potentially a little earlier. The earliest anthropogenic marker recorded in the core is the excursion in Hg (beginning at 190 cm) which may denote the early 1960s and is the closest stratigraphic marker in the core to the proposed mid-20th century timing for the onset of the Anthropocene. Biostratigraphical signatures of non-native species arriving in the 1970s–1980s are widespread key markers and are significant tools for the correlation of Anthropocene deposits across the estuary. The absence of signals that indicate pre-1950s deposits precludes the use of the core to mark the Holocene–Anthropocene boundary. However, the core provides an important reference section to demonstrate the palaeontological distinctiveness of Anthropocene series deposits.
Introduction
The San Francisco Estuary is the largest embayment on the Pacific Coast of the USA (Conomos et al., 1985). Human modification of the San Francisco Estuary and surrounding landscape was limited prior to European settlement in the 19th century. Agriculture and pastoralism comprised less than 1% of the land area of the Pacific Coast region prior to 1850 CE (Stephens et al., 2019). Industrialisation of the San Francisco Estuary associated with the onset of the California Gold Rush beginning in 1849 CE fundamentally reconfigured the estuary and surrounding landscape ecosystems, and this has accelerated towards the present day (Cohen and Carlton, 1998). The sedimentary deposits now accumulating in the estuary have a strong anthropogenic signature, which has developed in less than two centuries, with biological, chemical and physical markers preserved.
Industrialisation and urbanisation of the surrounding land area since the mid-19th century has resulted in eutrophication and deoxygenation of the waters (Cloern, 2001; Rajaee and Boroumand, 2015) and contamination of the estuary resulting from surface water runoff and atmospheric fallout of pollutants (Hornberger et al., 1999). Anthropogenic contaminants that have been deposited in the estuarine sediments include but are not limited to: heavy metals such as Ag, Al, Cr, Cu, Fe, Hg, Mn, Ni, Pb, V and Zn (Hornberger et al., 1999); DDT from agricultural runoff (Weston et al., 2002); flame retardants such as polybrominated diphenyl ethers (PBDEs) (Kerrigan et al., 2015); and polychlorinated biphenyls (PCBs) (Venkatesan et al., 1999). The sedimentary profiles of many of these anthropogenically-sourced contaminants have been demonstrated to increase in the mid-20th century (e.g. Hornberger et al., 1999; Venkatesan et al., 1999) and many may leave a long-lasting, distinctive signature of these human impacts in the stratigraphic record of the San Francisco Estuary.
Today the San Francisco Estuary is a highly modified ecosystem, with approximately 52% of all non-native species having been introduced to the estuary via shipping, either by fouling or boring into ship hulls, in solid ballast, ballast waters, or ballast sediment of ships (Cohen and Carlton, 1995; McGann et al., 2019). Some 39 species are also thought to have been introduced as a result of the shipments of Atlantic and Japanese oysters in the late 19th and early 20th centuries, respectively (Cohen and Carlton, 1995). Some species may also have travelled across the Pacific Ocean on tsunami debris (Tanaka et al., 2018). Through the systematic examination of historical records and ecological studies in the estuary, the record of introduced species is one of the best resolved in the world. Cohen and Carlton (1998) identified 234 non-native species in the estuary, in some areas comprising up to 97% of the total number of organisms. Half of all introductions across the 145-year record occurred since 1960 CE, a trend following that of the Great Acceleration (Steffen et al., 2015) and the global spread of non-native species (Seebens et al., 2017). The impacts and palaeontological signature of the introduced foraminifer Trochammina hadai (Uchio, 1962) have been extensively studied in the San Francisco Estuary (McGann, 2008; McGann et al., 2000; McGann, 2014, 2018).
The near-complete faunal restructuring of the San Francisco Estuary within less than two centuries is represented in the biostratigraphical record of the estuary, where some species that had never previously occupied North America became rapidly abundant at the expense of the native fauna. This is perhaps best exemplified through the introduction of T. hadai in 1983, which is now one of the most abundant foraminiferans in the San Francisco Estuary, and the Amur River clam, Potamocorbula amurensis (Schrenck, 1862) in 1986 CE, which now dominates mollusc communities in many parts of the estuary (Carlton et al., 1990; McGann, 2014). We aim to assess a particular San Francisco Estuary core as a reference section for an Anthropocene series through its detailed biogeochemical and stratigraphic analysis. A good reference Global boundary Stratotype Section and Point (GSSP) core sequence would be free of depositional hiatuses, contain substantial geological material both below and above the proposed boundary, and would contain a stratigraphic boundary that could be correlated with contemporaneous sequences across the globe.
Geographic setting of the core
The San Francisco Estuary is on the Pacific Coast of California, USA (Figure 1). The San Francisco Estuary receives marine water input from the Pacific Ocean to the west through the Golden Gate inlet, while the major freshwater sources are the Sacramento and San Joaquin Rivers to the east, which combined drain approximately 40% of the freshwater in California (Atwater and Belknap, 1980; Ingram et al., 1996). The primary agricultural areas nearby are in the California Central Valley, located around the Sacramento-San Joaquin River Delta, and in the Napa Valley to the north of the estuary. Sedimentation rates of up to 4.5 ± 1.5 cm yr−1 have been recorded in the San Francisco Estuary (Fuller et al., 1999). The reference section core site (SFB-20A) is located in the southern San Francisco Estuary (37.5495°N, 122.1831°W) (Figure 1), approximately 4 km north-west of Redwood City, at a mean water depth of 10.5 m, and the core is 2.3 m in length. Two cores were retrieved from core site 20 (SFB-20A and SFB-20B). These were located 40.5 m apart, potentially close enough to be a composite. Core SFB-20A was selected for high-resolution analysis as it was the longest (230 cm), potentially giving the largest temporal range.
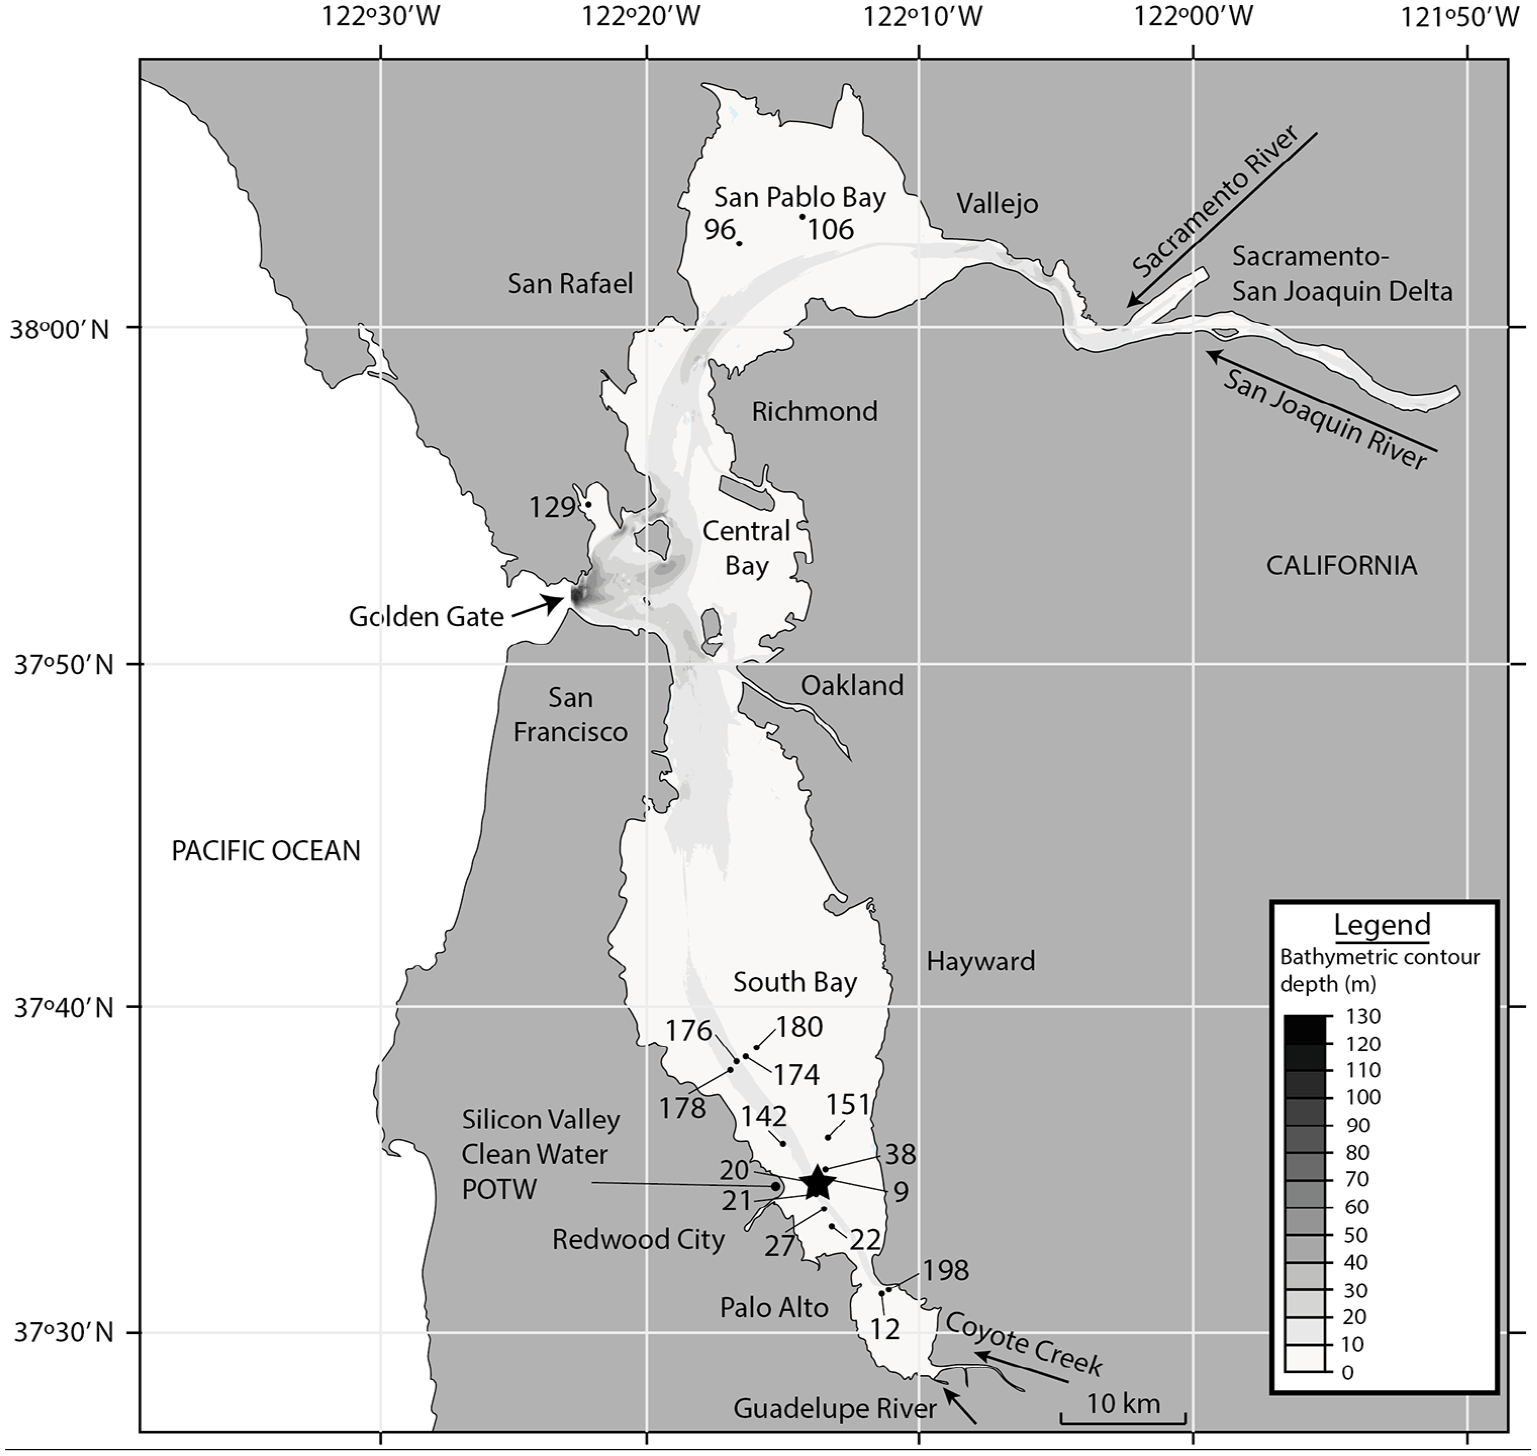
Bathymetric map of the San Francisco Estuary showing 10 m contours in the subtidal regions of the bay east of the Golden Gate. The estuary is surrounded by urban areas including San Francisco to the west, Palo Alto to the south, Richmond and Oakland to the east, and Vallejo to the north. Several core sites drilled by the USGS are shown. Core site SFB-20A, selected for analysis here, is marked with a star. The Silicon Valley Clean Water Publicly Owned Treatment Works (POTW) is the closest wastewater treatment facility to the core site and is marked.
In addition to SFB-20A, six other cores were retrieved in 2019. A further 13 cores collected in 1990–1991 and held at the USGS core repository in Menlo Park, California, have also been examined. The locations of these cores are shown in Figure 1.
Materials and methods
Core collection and analysis
Core SFB-20A was collected on 19th April 2019. A vibracorer was used in its retrieval as it is a sampling methodology for retrieving continuous, undisturbed cores from unconsolidated materials (Finkl and Khalil, 2005), mounted on a winch on the U.S. Geological Survey (USGS) Pacific Coastal and Marine Science Center’s research vessel Parke Snavely. The core is 230 cm in length. Once the core was retrieved, caps were placed on each end of the aluminium core tube and taped closed. The core was transported to a USGS refrigerated store in Menlo Park, California, then shipped to the British Geological Survey (BGS), Nottingham, United Kingdom where it was split and subsequently transported to the University of Leicester for logging and sampling.
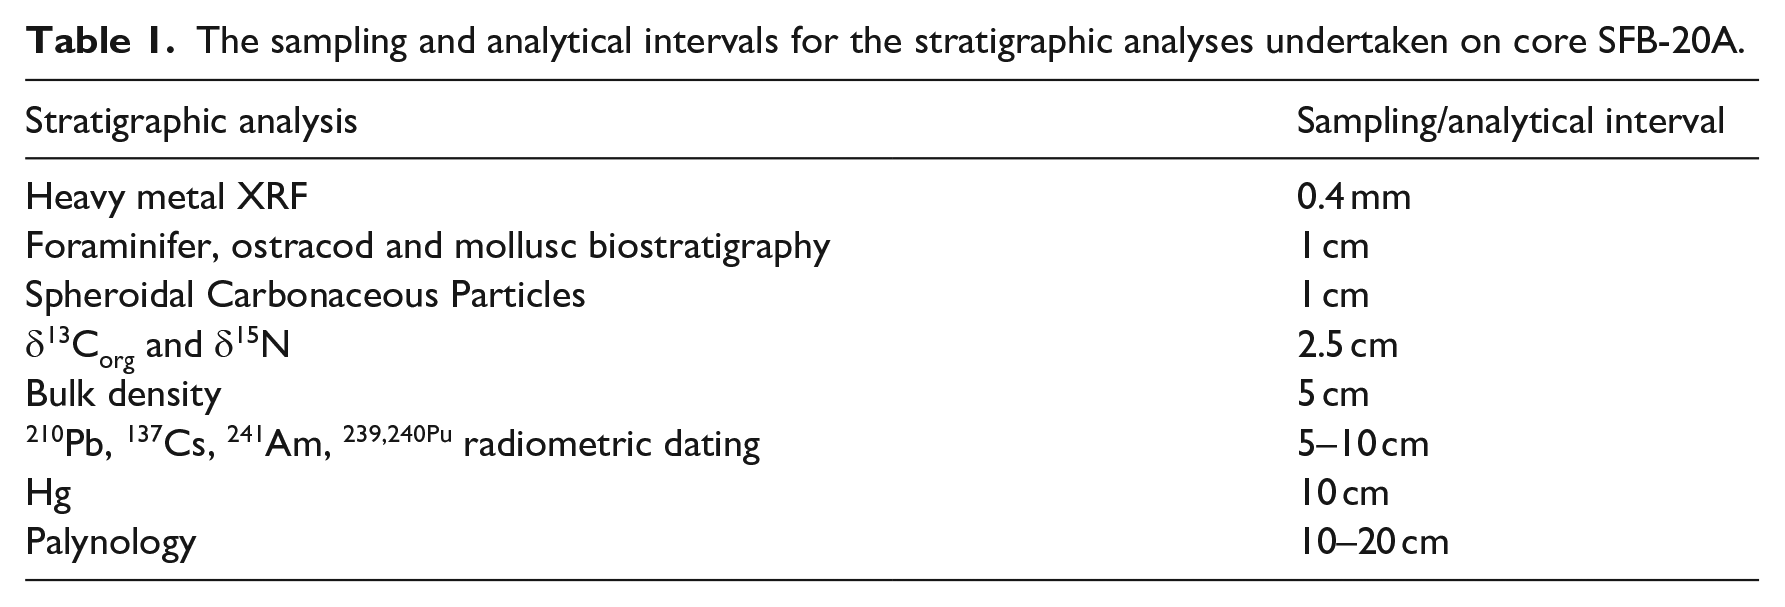
Sampling was achieved using a narrow spatula, with samples extracted from within one vertical centimetre of core material at regular intervals. The volume of extracted material varied, depending on the requirements for the respective analyses. The sampling and analytical intervals for the stratigraphic analyses are presented in Table 1. The core is stored at the BGS in Nottingham, UK where it will be accessible. It is possible to resample further cores from the same location in the future by working with the USGS.
The sampling and analytical intervals for the stratigraphic analyses undertaken on core SFB-20A.
Core SFB-20A is located in the southern San Francisco Estuary in an area expected to have experienced continuous deposition since 1858 CE, based on bathymetric survey data from 1858, 1898, 1931, 1956, 1983 and 2005, compiled by the U.S. Geological Survey (Foxgrover et al., 2004). Thus, depositional hiatuses are expected to be absent from this site.
The analytical processes are outlined below (Table 1). Full descriptions of the methodologies are provided in Supplemental File 1, with some key information being summarised here.
Core scanning
The core was scanned using the ITRAX XRF core scanner at the British Ocean Sediment Core Research Facility (BOSCORF), Southampton. The ITRAX core scanner does both X-ray imaging of the sediment and X-ray fluorescence analysis of elements. X-ray imaging scanned the core at 0.4 mm intervals to determine if there was any internal structure that was invisible to the naked eye. X-ray fluorescence analysis was undertaken to assess the downcore profiles of trace and major elements. Elemental concentrations in sedimentary deposits have been studied to assess seasonal variations in their abundance (Moon et al., 2005). Elements such as Cr and Ni are enriched in some rock units in the watershed; however, their concentrations have been increased by regional industrial processes in recent decades (Moon et al., 2005).
Chronological controls
Radiogenic isotopes
Sediment was sampled at intervals of 5–10 cm and 2–3 g of sediment extracted. The sampling equipment was washed with distilled water between individual samples to prevent contamination. Samples were oven-dried at 120°C to allow determination of bulk density using the University of Cambridge protocol (University of Cambridge, 2021). Samples were sent for 210Pb (half-life; t1/2 = 22.3 years), 137Cs (half-life; t1/2 = 30.2 years), and 241Am (half-life; t1/2 = 432.2 years) analysis for the determination of 210Pb-based geochronologies, using 137Cs and 241Am as mid-20th century fallout age constraints. The samples were analysed by direct gamma assay in the Environmental Radiometric Facility at University College London (UCL), using ORTEC HPGe GWL series well-type coaxial low background intrinsic germanium detectors. Use of the CIC (constant initial concentration) model was precluded by the non-monotonic variation in unsupported 210Pb activities. 210Pb chronologies were calculated using the CRS (constant rate of 210Pb supply) dating model (Appleby, 2001). Unsupported 210Pb activities were calculated by subtracting 226Ra activity (as supported 210Pb) from total 210Pb activity.
Time series analysis
The presence of periodic signals in the data obtained from the core were investigated through a comparison of the spectral analysis of the monthly rainfall, δ13Corg, core XRF data and the record of El Niño events for the past 70 years (GG Weather, 2022). Rainfall impacts the relative proportions of freshwater versus estuarine/marine C entering the San Francisco Estuary, which can lead to variations in δ13Corg (Cloern et al., 2002). Similarly, rainfall influences elemental abundance of metals in the San Francisco Estuary through variations in surface runoff (Moon et al., 2005). Spectral analysis of the data was undertaken using the Blackman-Tukey method following a method similar to that used by Karner et al. (2002) and Trauth (2006). The code was written in Matlab® using the built-in functions and is available on request.
XRF core scanners have been used extensively in palaeoclimatic reconstructions where the input of terrigenous detritus drives element variability in sediments (e.g. Brown et al., 2007; Donnelly and Woodruff, 2007; Tierney et al., 2005). Titanium is commonly sourced from terrigenous inputs in pelagic and hemipelagic sediments and has been used as a proxy for river runoff and precipitation (Peterson and Haug, 2006). Hendy et al. (2015) identified high counts of Ti during wet years associated with El Niño events in the Santa Barbara Basin and low counts during drought intervals. Titanium was used as it is not associated with biological activity or precipitated authigenically (Hendy et al., 2015).
Observed rainfall data, sampled at monthly intervals (GG Weather, 2022), were processed to derive annual signals, which were compared against historical records of El Niño events. To attempt to identify the depth-age relationship for the core, monthly rainfall was scaled to accumulated sediment thickness using sediment load data recorded in the Sacramento River by the USGS. The sediment load data were used as the best available proxy for thickness of accumulated sediment that was based on continuous measurements of known age. The adjusted rainfall data were resampled at the same regular intervals as the Ti XRF data and the known annual peak in the rainfall spectra was matched to that of the Ti data to verify the scaling. The known ages of peaks in the rainfall data were mapped to depths in the core based on the XRF profiles (see also Supplemental File 1).
Anthropocene stratigraphical proxies
Radiogenic isotopes
Samples were extracted from the core at 5 to 10 cm intervals. The dried samples were ignited, spiked with 242Pu chemical recovery tracer, and heated to a homogenous melt. The resultant liquid glass was acid treated and the total Pu was pre-concentrated by means of co-precipitation with Fe(OH)3 at pH 5–6. The samples were further acid treated and the solution evaporated to dryness with 5 ml of concentrated HNO3. Thin alpha spectrometric sources were prepared by electrodeposition (see also Supplemental File 1). Each source was counted using Octete (Ortec/Amtek) alpha spectrometers equipped with PIPS detectors for the determination of 239+240Pu activities. The resulting spectra were analysed using Maestro spectral analysis software.
Novel materials
Spheroidal carbonaceous particles (SCPs) were extracted from samples taken every 1 cm (Table 1) following the methodology described in Rose (1994). Between 0.10 and 0.15 g dried sediment was subjected to sequential chemical attack by mineral acids to remove unwanted fractions leaving a suspension of mainly carbonaceous material and a few persistent minerals in water. A known fraction of the final suspension was evaporated onto a coverslip and mounted onto a microscope slide. Analytical blanks and SCP reference material were included in the sample batch. The number of SCPs on the coverslip were counted using a light microscope at x400 magnification and the sediment concentration calculated in units of ‘number of particles per gram dry mass of sediment’ (gDM−1). The criteria for SCP identification under the light microscope followed Rose (2008).
Organic matter proxies
Samples were placed in Eppendorf tubes, treated with ~10 ml of 10% HCl, left for 24 hours and then centrifuged for 30 seconds at 500 rpm to remove carbonate. The acid was pipetted off, deionised water was added, and the samples centrifuged. This step was repeated until pH indicator strips showed that the samples were pH neutral. Samples were frozen at −20°C for 24 hours and were freeze-dried for a further 24 hours. The samples were milled for 1.5 minute on a frequency of 30.0 Hz. Approximately 20 mg of the milled subsamples were weighed and placed into tin cups.
The samples were analysed for total carbon, total nitrogen, and the isotopes of both carbon (δ13C) and nitrogen (δ15N) using a Sercon ANCA GSL elemental analyser interfaced to a Sercon Hydra 20-20 continuous flow isotope ratio mass spectrometer. Carbon isotope results are expressed relative to Vienna PDB. Nitrogen isotope results are expressed relative to atmospheric nitrogen.
Inorganic geochemical signatures
PS Analytical Millennium Merlin 10.025 cold vapour Atomic Fluorescence Spectroscopy was used to analyse for Hg (Oreste et al., 2013). The samples were analysed following the protocol APP13 Millennium Merlin Method for Mercury in Sludge, Soils and Sediments from the user manual and method supplied by PS Analytical. The flow rates for gas, reductant, reagent, and sample lines were checked to be within tolerance and recorded. Calibration standards were run followed by 3 runs of each sample (including Certified Reference Material) with an acid blank run between samples to reduce contamination and ensure pipes and machine surfaces in contact with the samples were kept clean.
Biotic markers
Molluscs, foraminifera, and ostracods were analysed at 1 cm intervals from the surface to the base of the core. The wet samples were sieved through 1000, 500, 250, 125 and 63 μm fractions. Mollusc remains were picked from the 1000 and 500 μm sieves and stored in containers for later identification. The 500, 250, 125 and 63 μm fractions were separated and oven-dried overnight at 50°C. Dried samples from these fractions were picked using a light microscope to analyse their microfaunal content, including foraminifer and ostracods. Sieves and picking equipment were rinsed with distilled water between each sample to prevent contamination. Specimens were studied using a Wild Heerbrugg M5 microscope.
Palynological processing followed a modified version of Faegri and Iversen (1964). One Lycopodium clavatum spore tablet (concentration 13,500 ± 210 pollen grains) was added per sample. Prior to acetolysis, samples were pre-treated with 10 ml of tetra-sodium pyrophosphate decahydrate at 5%, rinsed with glacial acetic acid, followed by the acetolysis treatment which consisted of a solution of 9:1 parts of acetic anhydride acid and sulphuric acid; 4 ml of acetolysis solution were added to each sample. Pollen grains were heavy-liquid separated with 4 ml of solution of Bromoform and 96% ethanol with a specific gravity of 2, by centrifuging and decanting the sample. Glycerine was added and the samples were oven-dried at 35°C. Samples were mounted onto slides using glycerol gelatine. They were counted using a Leica DM500 light microscope under 400x magnification.
Results
Lithology
The core comprises dark estuarine silts and clays from 0 to 102 cm depth and 112 to 221 cm depth (Figure 2). Between 102 and 112 cm depth the lithology is medium sand and includes a concentration of mollusc shells including the introduced Amur River clam Potamocorbula amurensis and the native oyster Ostrea lurida. At the base of the core, from 221 to 230 cm depth, the lithology is medium–coarse sand and contains a high concentration of Ostrea lurida. A basal sand layer is recognised in at least four other core sequences retrieved from South Bay, although it is not clear if they record an isochronous event. The length of the core was constrained by the dense shell layer below 221 cm depth that the core cutter was unable to penetrate.
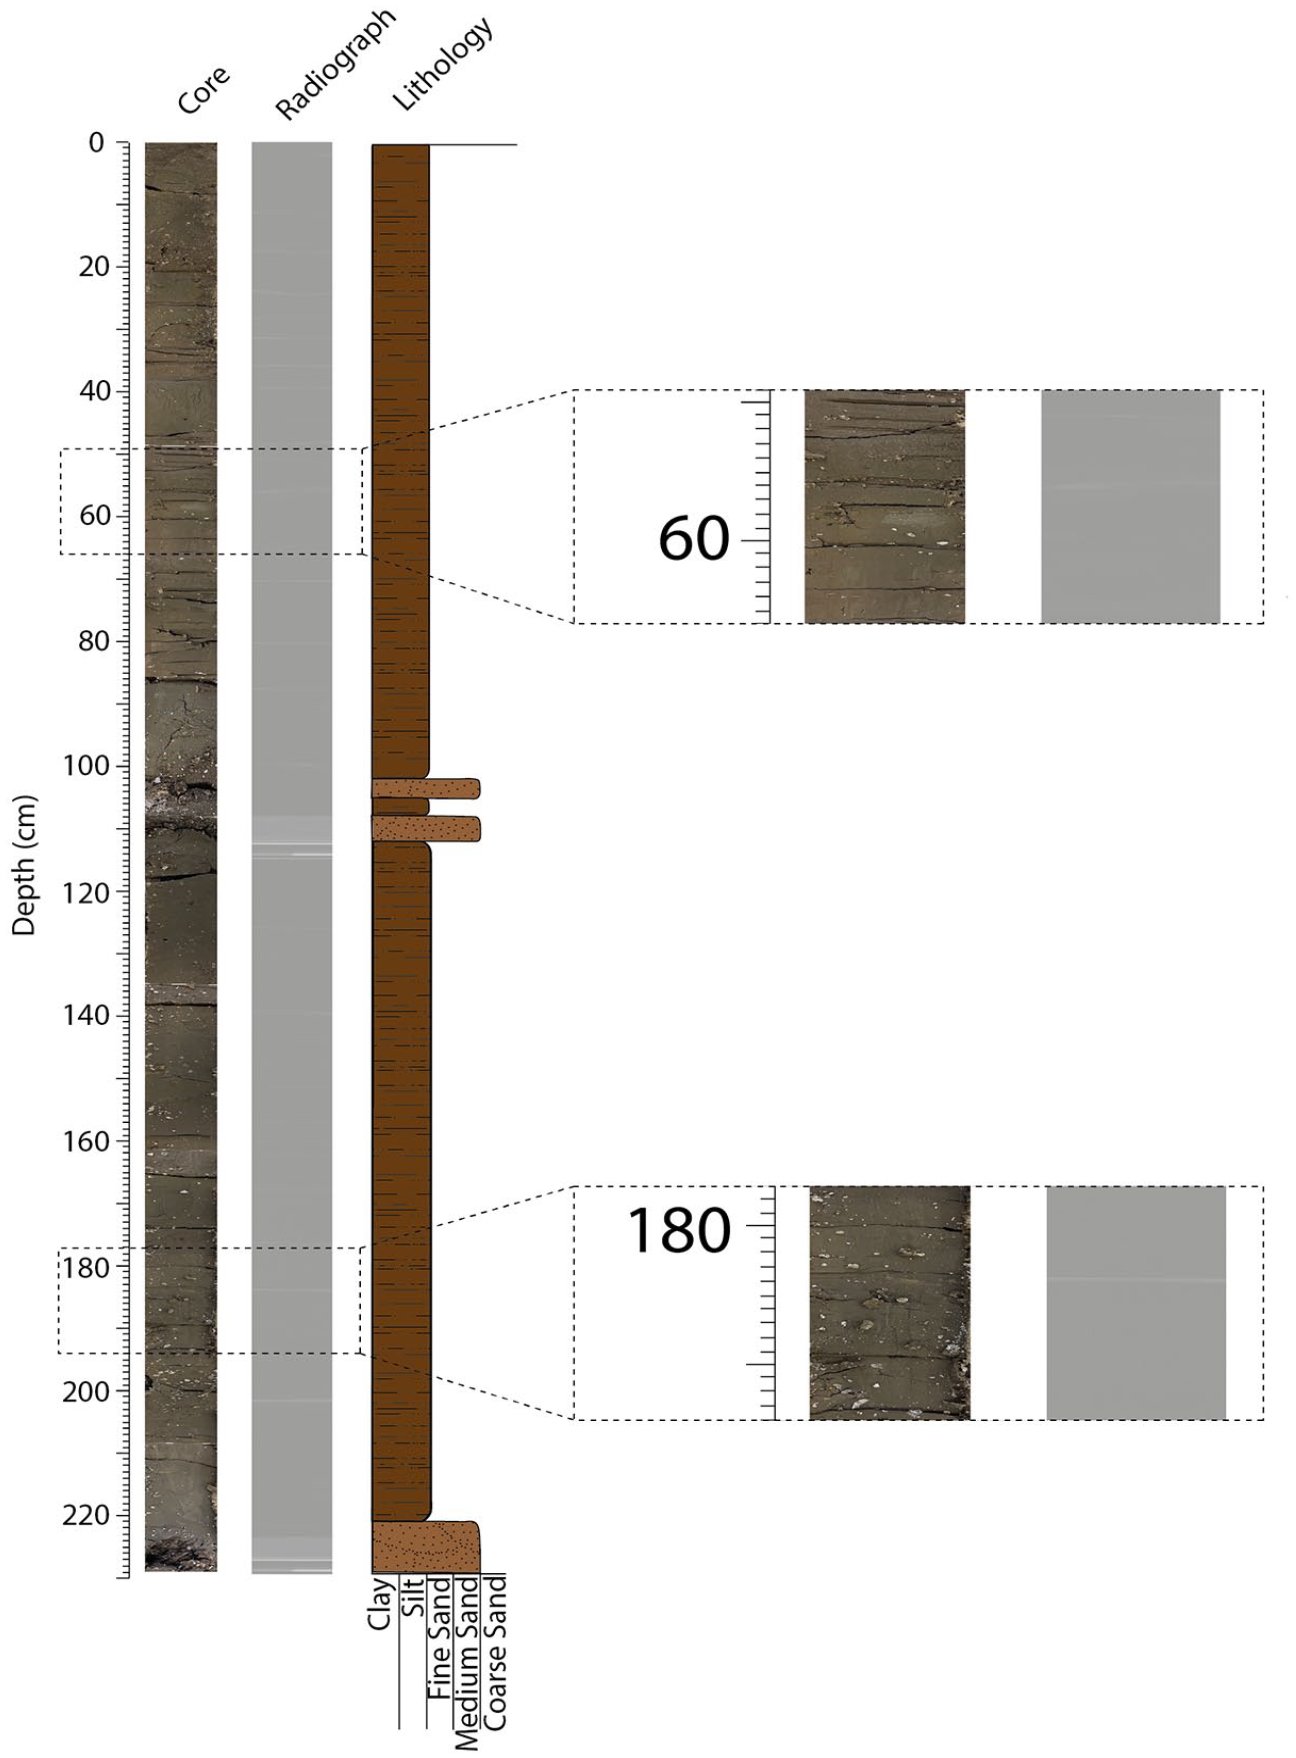
Sediment core image, lithology, and Itrax X-radiograph core scan of core SFB-20A. The cracks evident in the sediment core (left column) may align with lamination boundaries. Reproduced in colour in online version.
The silts and clays which comprise the core from 0 to 102 and 112 to 221 cm contain no overt evidence of bioturbation. There is no observable lamination in the core; however, the core contains many cracks which may align with lamination boundaries (Figure 2).
Chronology
Radiometric dating
Unsupported (excess) 210Pb activities are very low from the surface of the core (Supplemental File 2, Figure 1). Given relatively high counting errors in unsupported 210Pb and low unsupported 210Pb activities (Figure 5), it is difficult to date the sediments using 210Pb dating. The high uncertainties associated with the 210Pb chronologies and sedimentation rates preclude them from being accurate, high-resolution chronological markers in this core. For example, the 210Pb-derived age model (Figure 5d) places 1951 CE at 85 cm depth. However, the error at this horizon is ±23 years, meaning the range of possible dates for this horizon is 1938–1974 CE. Even the younger date here would not be consistent with the age model presented in Figure 4. Previous studies in the San Francisco Estuary on shorter cores have not experienced this issue as the unsupported 210Pb activities are relatively enriched by the lower sedimentation rates (e.g. Hornberger et al., 1999).
Time series analysis
The δ13Corg (Figure 3) and δ15N data (available in Supplemental File 3) are of relatively low resolution but show spectral peaks consistent with periodic signals at 45, 32, and 18.75 cm for δ13Corg and weak signals at 37.5 and 18.75 cm for δ15N. The observational data of El Niño has spectral peaks at 9.8, 4.92, and 3.8 years (Figure 3). This is as expected since these events have occurred at an average rate of once per 4.7 years since 1950 (GG Weather, 2022). The observed rainfall data sampled at monthly intervals (available in Supplemental Information) show a clear annual signal and additional signals at 35.5, 10, circa 5, 2.95, and 2.15 years (Figure 3).
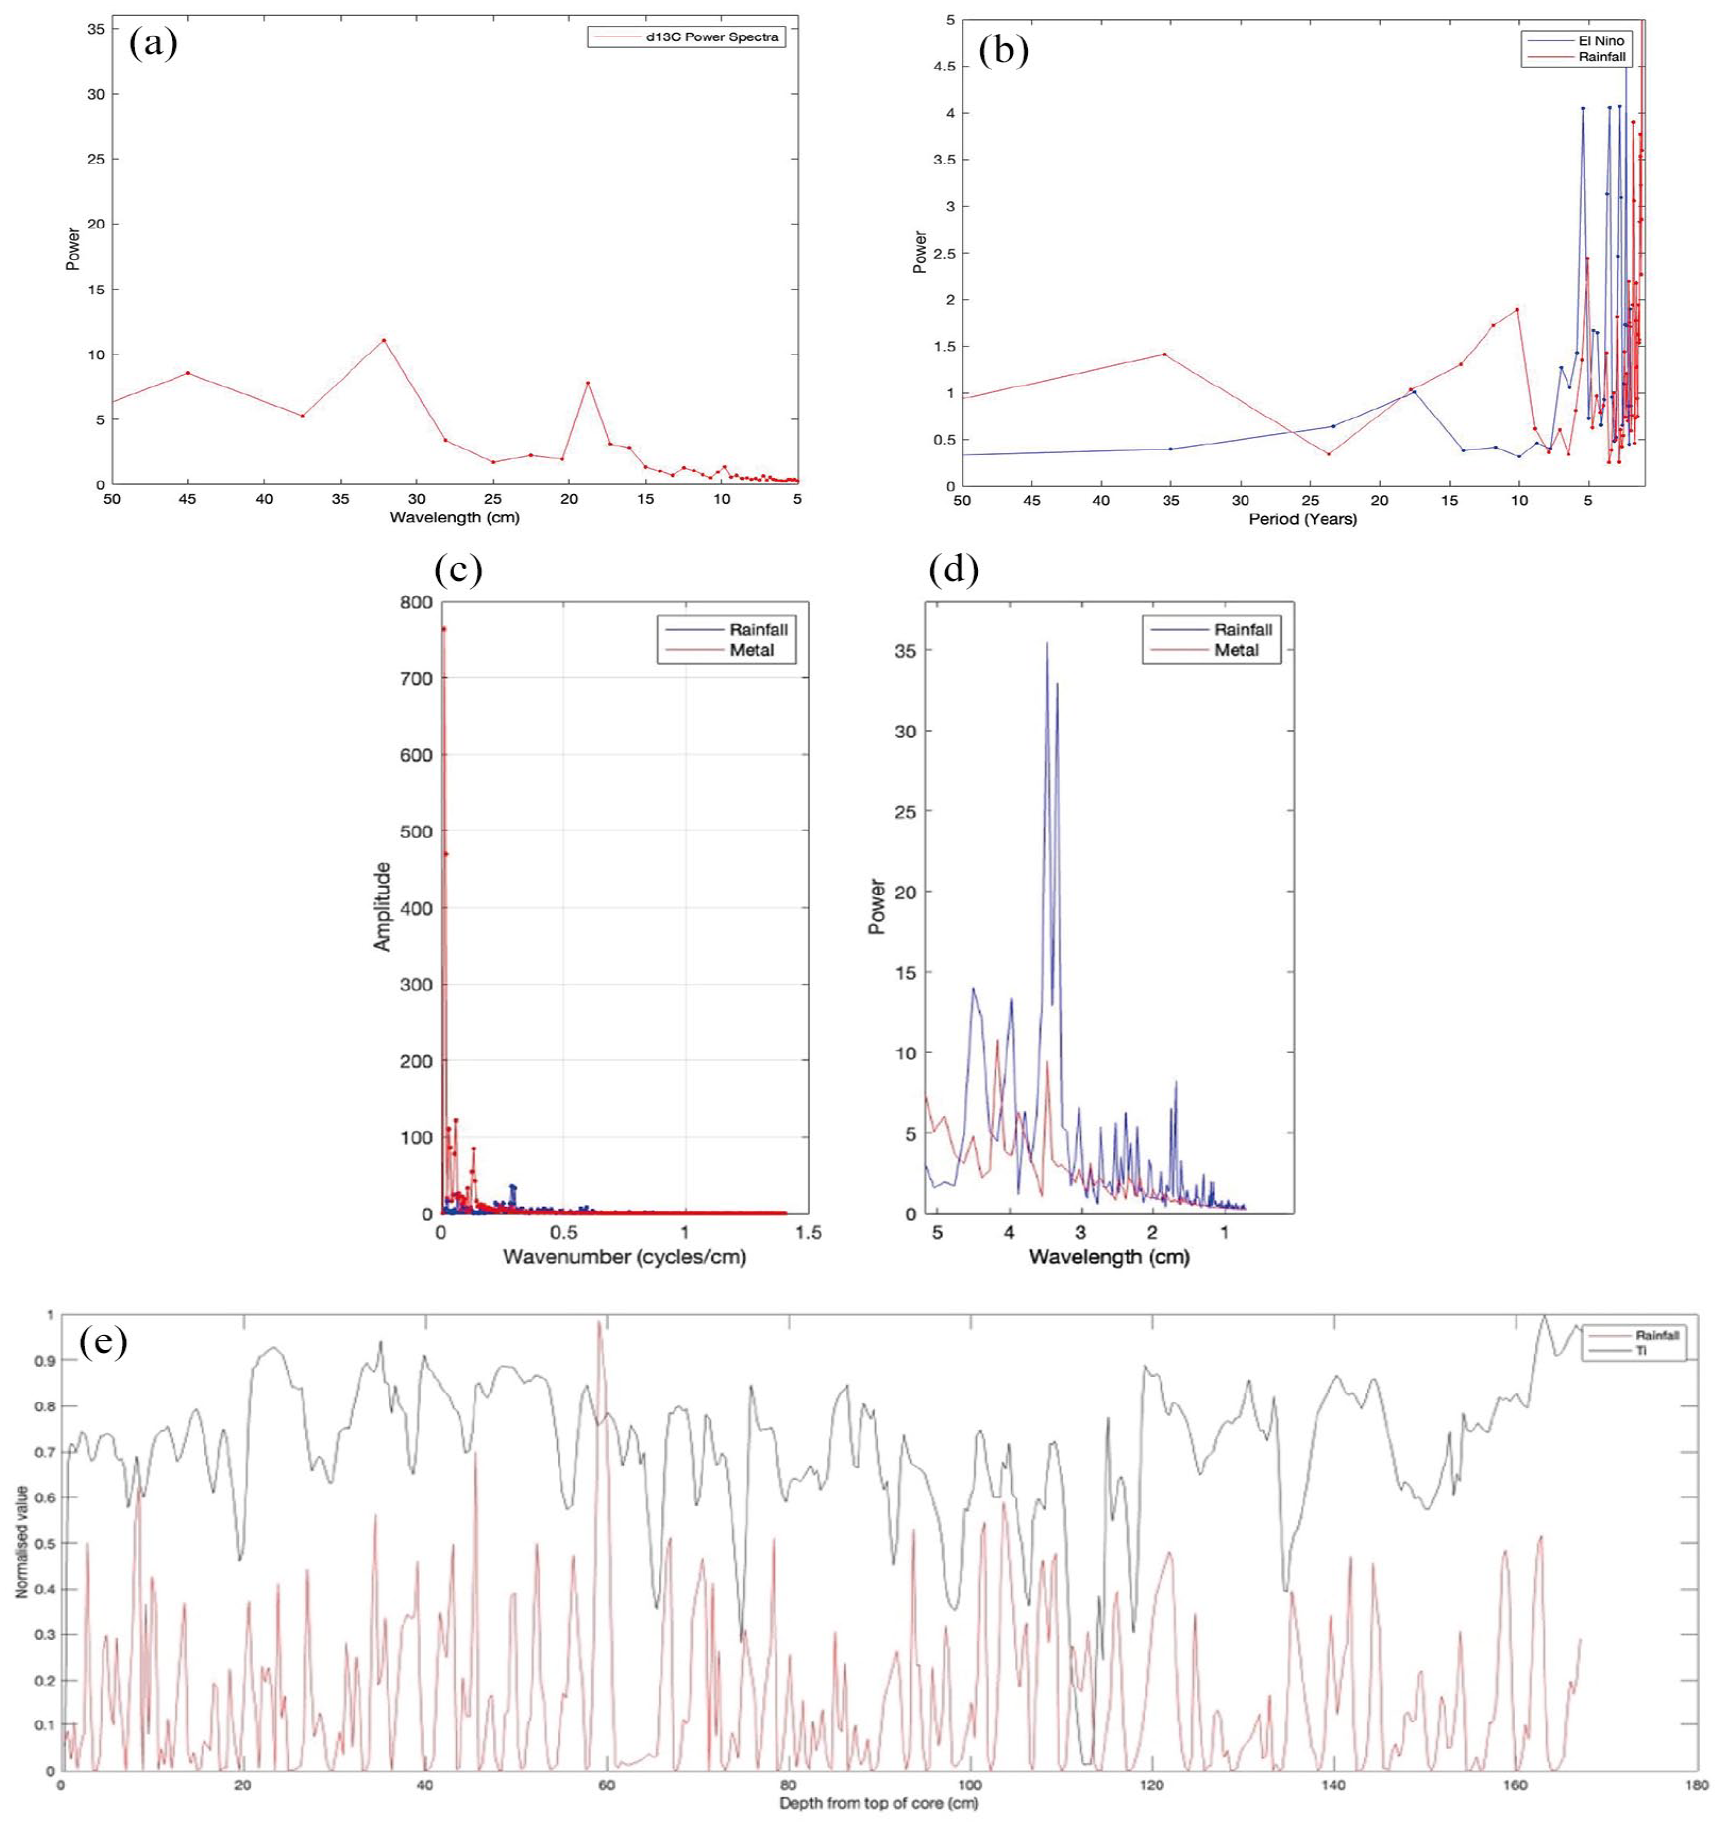
(a) Time series power spectra of δ13Corg analyses from the sediment core, (b) combined time series spectra for observed monthly rainfall and El Niño events, (c) spectra and plot of rainfall and heavy metal data used in construction of the depth to time conversion for the top 167 cm of the core, (d) comparison of the spectra of the heavy metal and rainfall measurements with depth, after adjusting the datasets using sediment load data for the San Francisco Estuary to account for variations in sediment flux, (e) comparison of the rainfall and subsampled heavy metal data (Ti) for the top 167 cm of the core (note: both datasets have been normalised to their maximum values to aid comparison). The dates of the peaks and troughs in the rainfall data are known, enabling a chronology for the core to be constructed. Further explanation of these analyses is presented in the main text and Supplemental File. Reproduced in colour in online version.
The peaks do not match well with the observed El Niño records, but this might be a function of the coarse sampling of the El Niño occurrence data (GG Weather, 2022). To attempt to provide a higher resolution time to depth scaling, monthly records of sediment load data from the Sacramento River (U.S. Geological Survey, 2022; available back to 1967) were used to scale the sample interval of the monthly rainfall data. The rainfall data were then resampled to the same sample interval as the XRF data, which enabled a direct comparison of their spectra (Figure 3). This comparison shows a correspondence between the annual peak in the rainfall and the XRF Ti data (an indicator for precipitation/fluvial runoff) (Peterson and Haug, 2006) at a period of 3.47 cm. The known ages of peaks and troughs in the rainfall data were then mapped to approximate depths in the core to define an estimated time–depth conversion, with data points at monthly intervals (Figure 4). Using this time–depth conversion the XRF Ti data were converted from depth to time and a cross-plot of Ti concentration versus the sediment load data gives an R2 correlation of .64. Further details are included in Supplemental File 1. The resulting chronology is the most precisely defined for core SFB-20A. However, it should only be used as an approximate guide. The mean sedimentation rate, calculated to 3.4 cm yr−1, is comparable with peak sedimentation rates measured elsewhere in the San Francisco Estuary (Fuller et al., 1999). The minimum error (±1 sample interval) of 0.64 cm, or ±2.4 months using the mean sedimentation rate, is likely to be a considerable underestimate. This underestimate, together with the R2 value of 0.64 for the relationship between Ti and sediment load, suggest that mismatches between the time–depth curve derived from the time series analysis and stratigraphic data would not be unexpected (Figure 4). A visual comparison of the rainfall data and the Ti data (Figure 3) suggests that there is a relatively good match between peaks and troughs in the data between 0 and 110 cm, but below this the match is less good.
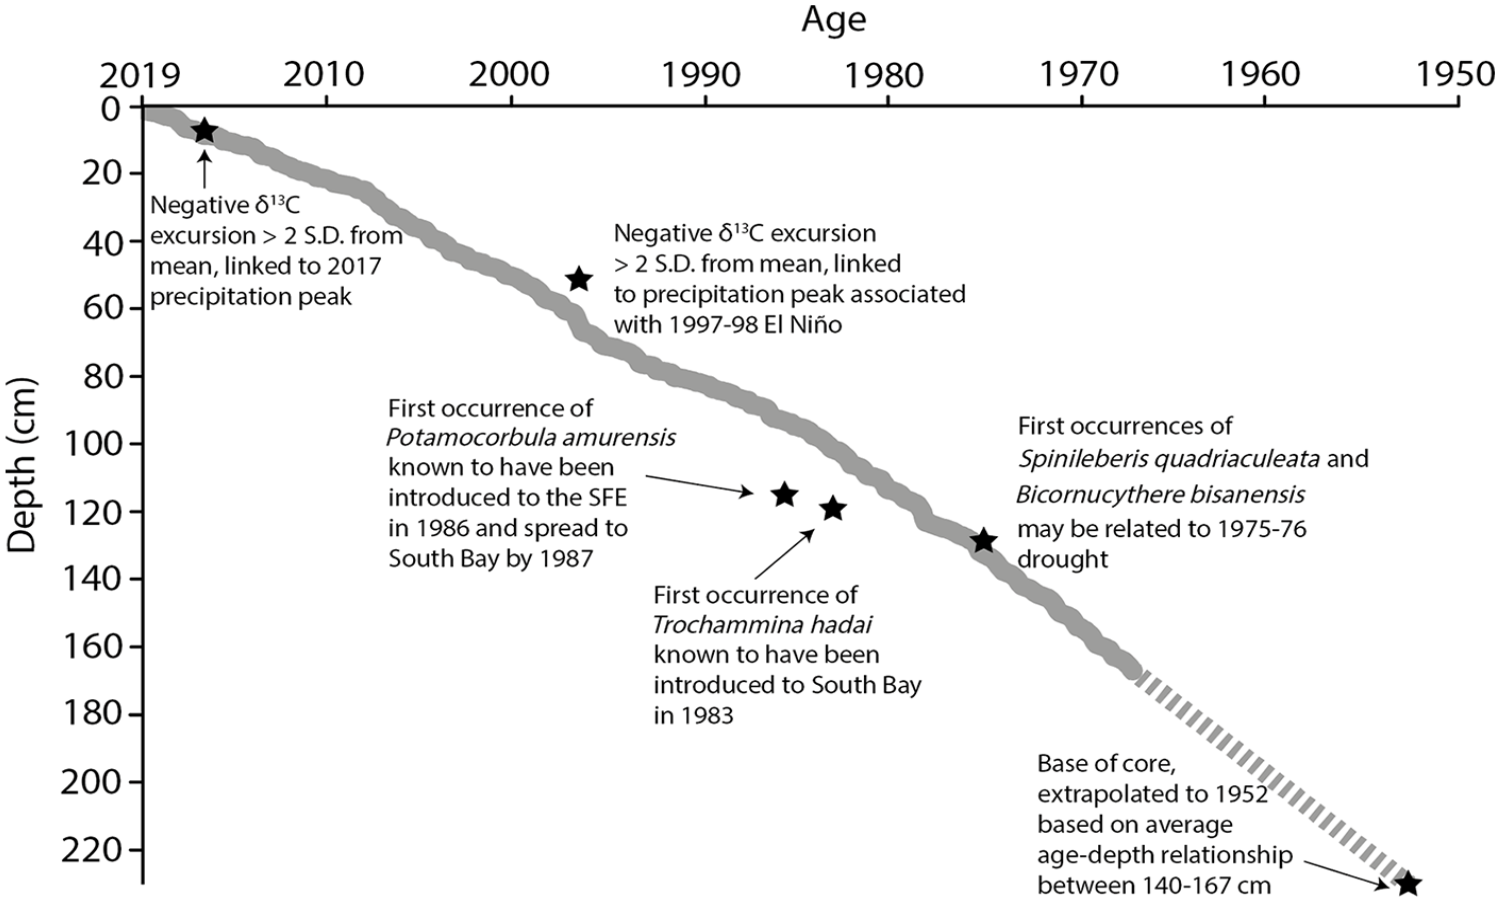
Age–depth profile of core SFB-20A derived from the times series analysis (grey curve width includes sampling error). The top of the core represents 2019 CE. The chronology is based on the conversion of rainfall to depth (see main text and Figure 3). Plotting key biostratigraphical events here suggests that the time series analysis gives an approximation of age, but for some intervals may be a few years in error. Thus, the lowermost core occurrences of the foraminifer Trochammina hadai and mollusc Potamocorbula amurensis are taken as 1983 and 1986 CE, respectively based on widely observed data from the estuary, whereas time series analysis would suggest these levels to be in the late 1970s. The age profile is defined to 167 cm depth (solid grey line) and then extrapolated to the base of the core (dashed grey line).
However, discretely dated stratigraphic events show relatively good agreement with the time series chronology. The most notable offset is of the lowest occurrences of Trochammina hadai and Potamocorbula amurensis. The time series chronology dates these introductions to 1978 and 1979 CE, respectively. However, they are known to have been introduced to the San Francisco Estuary in 1983 and 1986 CE, the latter spreading to the southern San Francisco Estuary by 1987 CE (Carlton et al., 1990; McGann, 2014).
Radioisotopes
Only three samples contained traces of 241Am at 0, 20 and 75 cm depth (Figure 5c). The maximum 241Am activity was 1.99 ± 0.65 Bq kg−1, observed at 75 cm depth. Due to the low activities of 241Am and resulting discontinuous concentration profile, it is not possible to observe confident lowest occurrence and peak abundance datums.
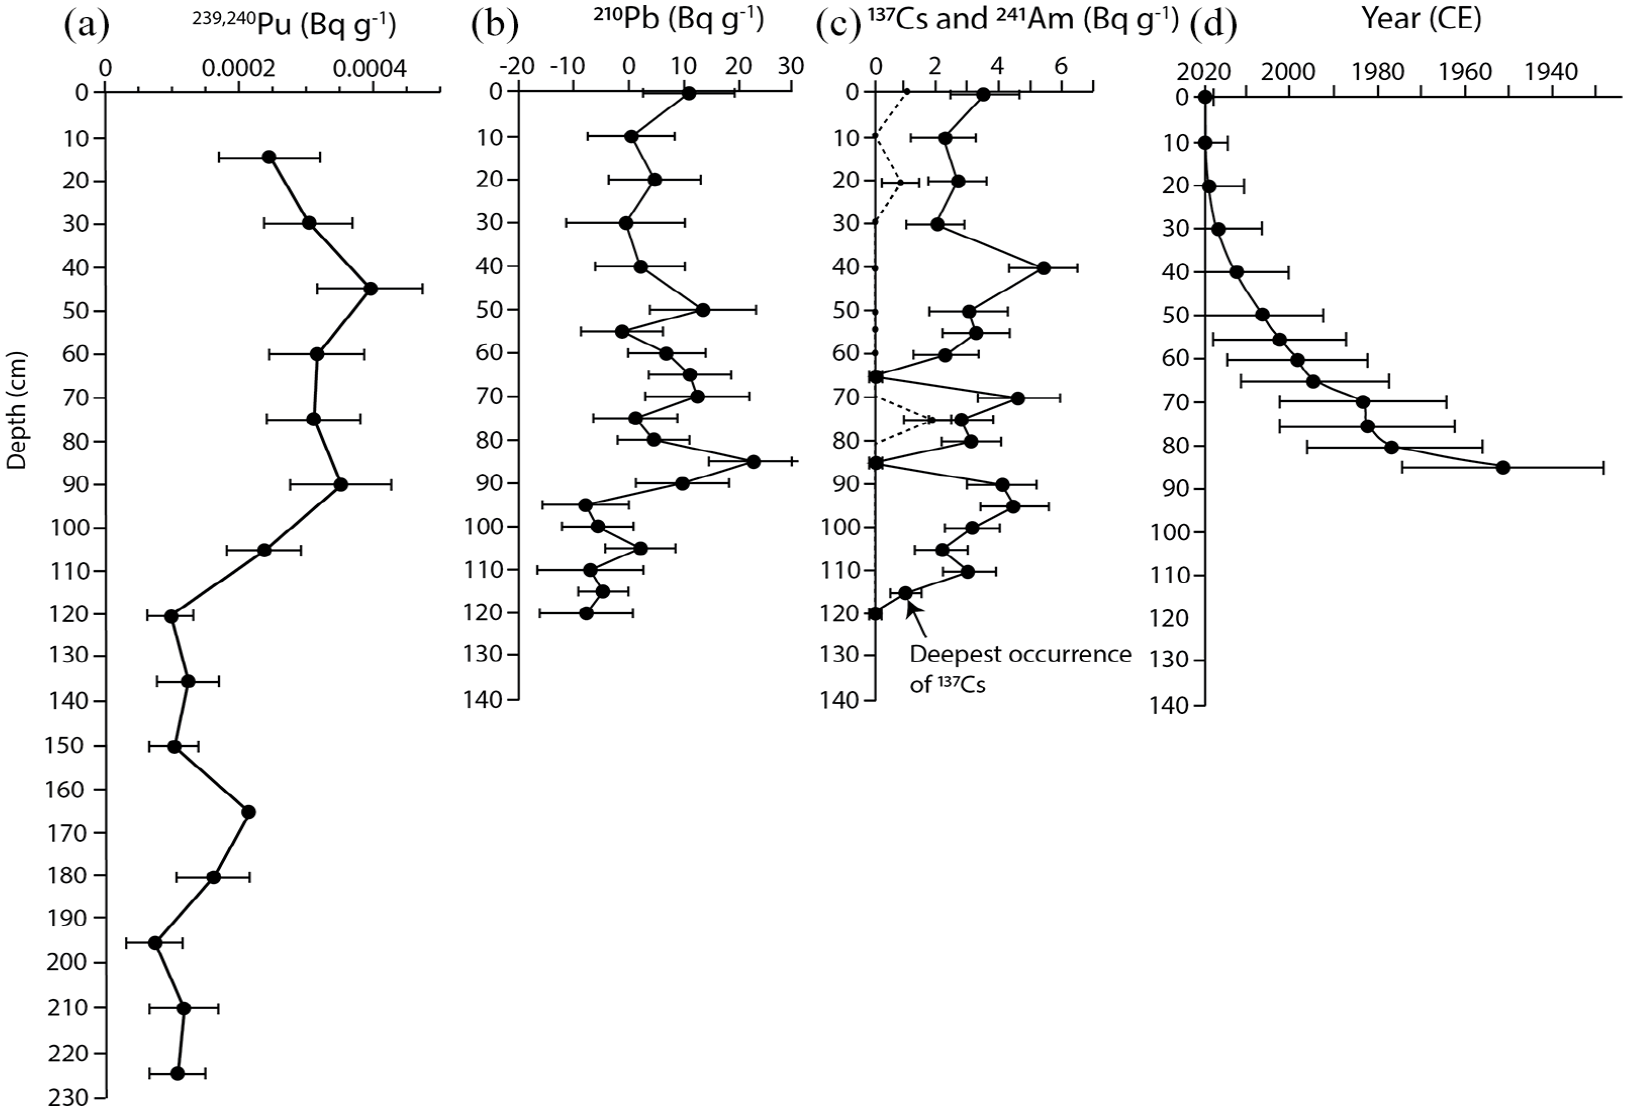
(a) Profile of 239+240Pu (the sample at 165 cm represents the Limit of Detection, LOD, value as 239+240Pu was not definitively quantified in that sample), (b) Profile of excess 210Pb, (c) Profile of 137Cs (solid black line) and 241Am (dashed black line), (d) the age model derived from excess 210Pb. Initial recovery of 137Cs occurs at 115 cm depth. The age model has large error bars, which prevent high-resolution dating of the uppermost section of the core.
Low 137Cs activities were detected to a depth of 115 cm (Figure 5c). The highest activityof 137Cs of 5.42 Bq kg−1 occurs at 40 cm depth (2003); however, it is not a clearly defined peak in contrast with that observed in other core sites across the San Francisco Estuary, which do record a clear maximum associated with global nuclear weapons fallout (Fuller et al., 1999). The errors associated with individual samples are relatively large, ranging from 108 ± 0.49 to 3.06 ± 1.24 Bq kg−1. The sandy lithological marker bed at 102–112 cm depth is situated 3 cm above the lowest occurrence of 137Cs in the core.
Low activities of 239+240Pu are recorded towards the base of the core between 225 and 120 cm (early-1950s to 1978 CE) (Figure 5a), averaging 0.00013 Bq g−1. The sample at 165 cm depth (1967 CE) records the level of detection as 239+240Pu was not definitively recorded in this sample. Activities of 239+240Pu increase from 120 cm, peaking in activity at 0.0004 Bq g−1 at 45 cm depth. Activities of 239+240Pu decrease towards the surface of the core, reaching 0.00025 Bq g−1 at 15 cm depth.
Calculation of flux rates
The Dry Bulk Density (DBD) shows two peaks of 1.2 and 1.17 g cm−3 at 115 cm and 105 cm depth, respectively (Figure 6). This closely corresponds with the sand layer observed at 102–112 cm (Figure 2). The DBD increases towards the base of the core due to the basal sand layer and towards the surface of the core due to an increase in organic matter.
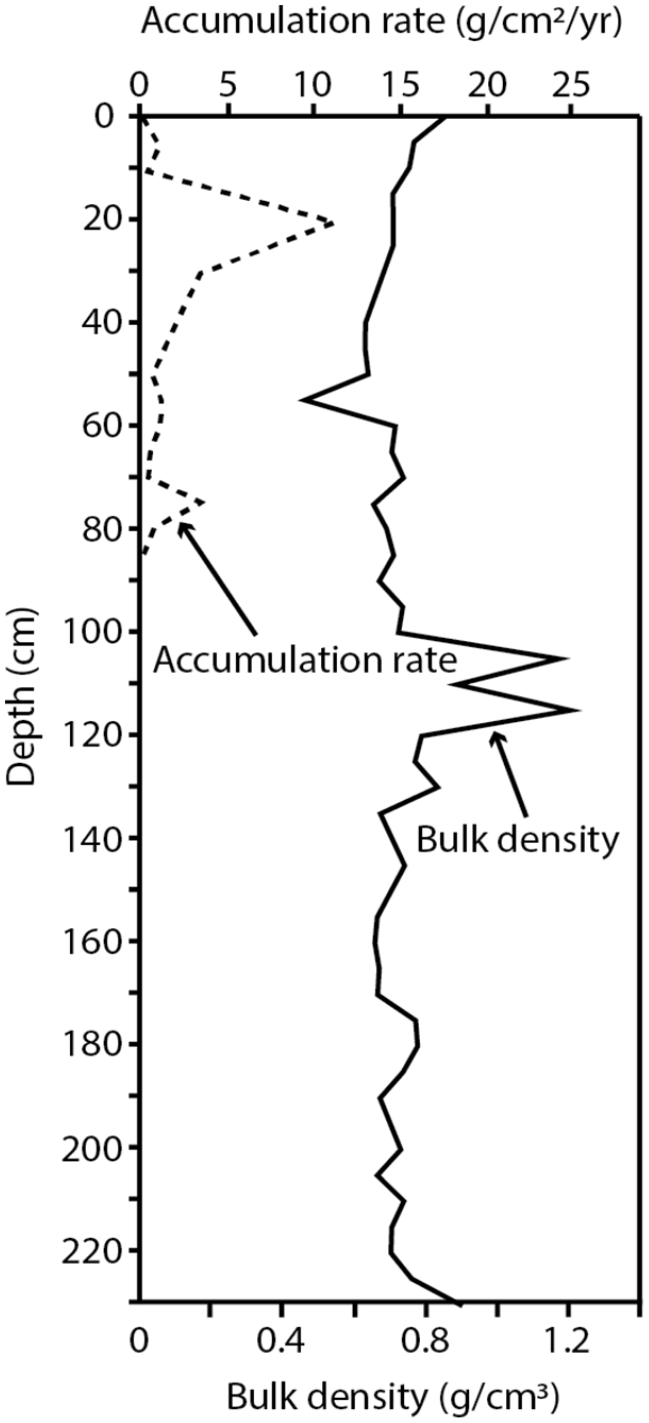
Sediment flux accumulation rate and bulk density downcore profiles. The accumulation rate is plotted to a depth of 85 cm below which excess 210Pb activities are too low to quantify the sediment accumulation rate.
The sediment mass accumulation rate (MAR) is quantified to a depth of 85 cm, below which excess 210Pb values are too low to derive the MAR (Figure 6). MARs for the core are generally between 0 and 5 g cm−2 yr−1, reaching up to 11.24 g cm−2 yr−1 at 20 cm depth. However, due to the low activity levels of excess 210Pb in the core, the error of the MARs for individual samples are as much as ±5796% at 40 cm depth and in some instances (e.g. 55 and 60 cm depth), the error values are negative. Therefore, the MARs have high uncertainties and can only be used for reference. These high uncertainties may be a result of fluctuating 210Pb level in the sedimentary and water columns, influenced by processes such as precipitation and surface runoff.
Novel materials
Spheroidal carbonaceous particles (SCPs)
The lowest appearance of SCPs is at 165 cm depth (Figure 7) and this level may equate to the 1960s (Figure 4), with a concentration of 186 SCPs gDM−1. Between 165 and 97 cm depth, the concentration of SCPs is relatively low, averaging around 100 SCPs gDM-1. The peak abundance of SCPs is at 81 cm depth where almost 1300 SCPs gDM−1 were observed. A smaller peak is observed slightly earlier at a depth of 97 cm where 1174 SCPs gDM−1 were observed. Zero SCPs were recorded in the analytical blank, while analysis of SCP reference material (Rose, 2008) showed reasonable agreement with expected concentrations.
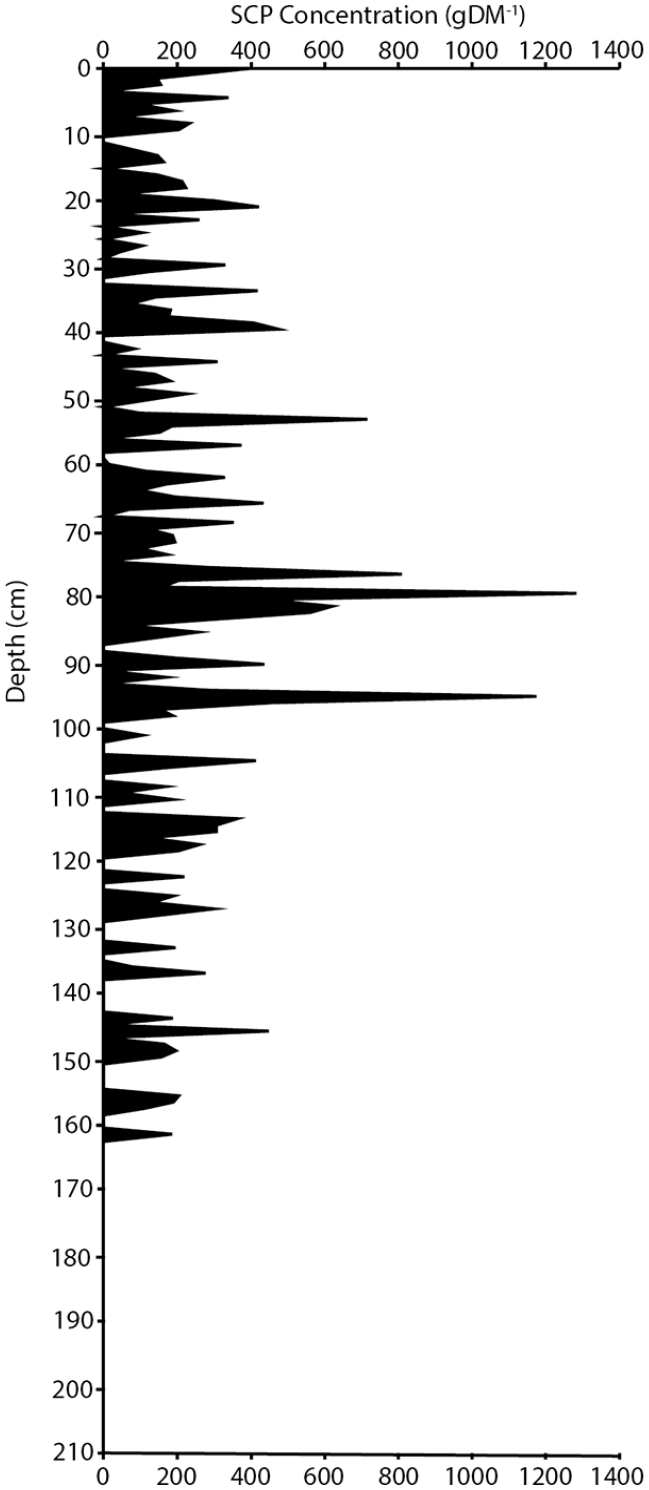
Downcore trends in the concentration of spheroidal carbonaceous particles (SCPs). The lowest occurrence of SCPs at 165 cm approximates 1967.
Organic matter proxies
Total carbon (TC)
The total carbon profile is presented in Figure 8a. In the lower portion of the core, between 222.5 and 132.5 cm depth, the total carbon values exhibit an upwards decreasing average trend from 11 to 6 μg mg−1, with a peak in concentration of 13 μg mg−1at 185 cm. Total carbon reaches a minimum concentration of 6 μg mg−1at 117.5 cm, subsequently rising to 11 μg mg−1at 102.5 cm. Between 102.5 and 0 cm total carbon values are relatively consistent, albeit fluctuating, around a mean concentration of 10 μg mg−1.
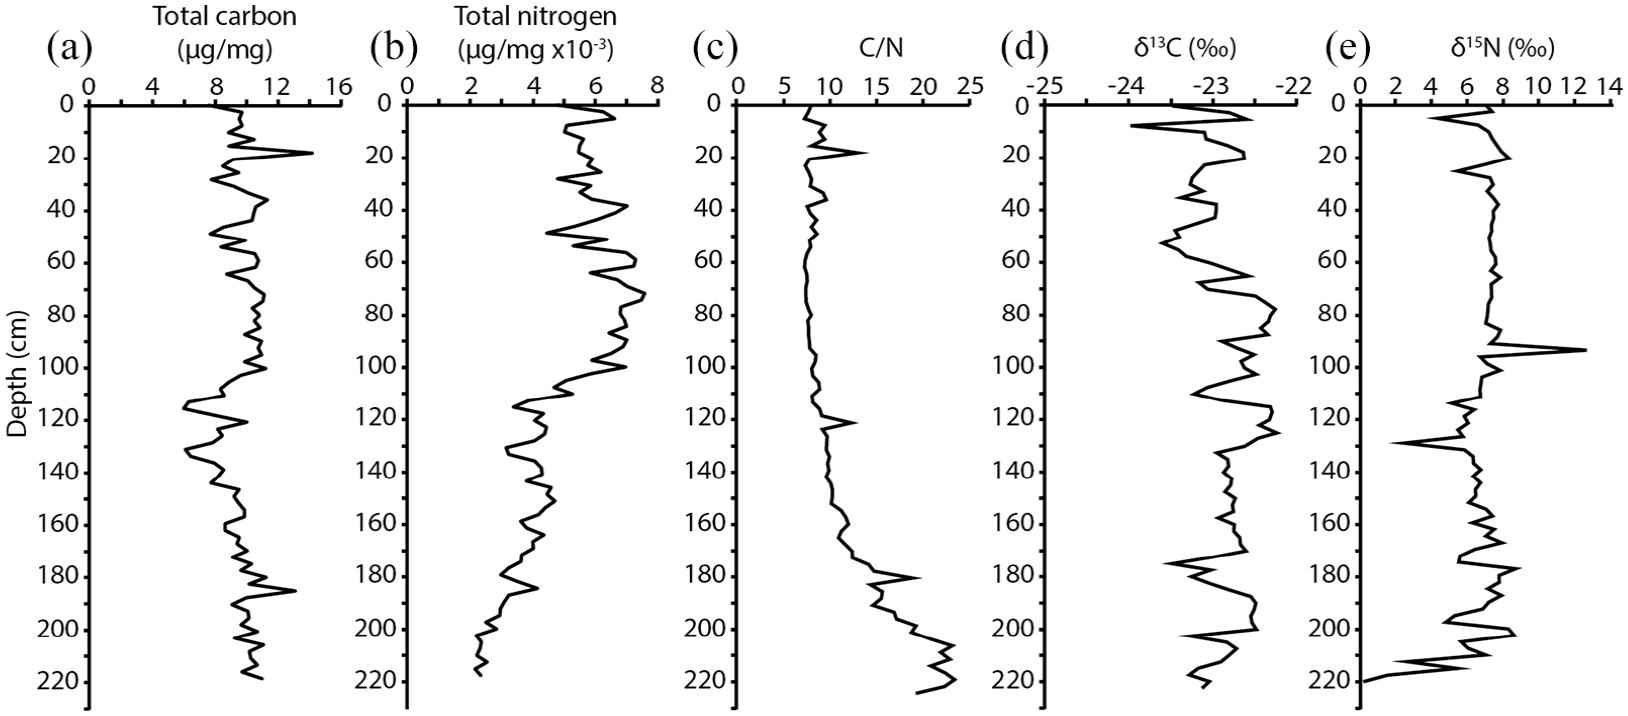
Downcore profiles of (a) total carbon, (b) total nitrogen, (c) the C/N ratio, (d) δ13Corg, and (e) δ15N.
Total nitrogen (TN)
Initially the total nitrogen concentration increases from 2 × 10⁻³ μg mg−1 at 222.5 cm to 4 × 10⁻³ μg mg−1 at 120 cm (Figure 8b). Between 117.5 and 77.5 cm total nitrogen increases more rapidly from 3 × 10⁻³ μg mg−1 to 7 × 10⁻³ μg mg−1. Total nitrogen is relatively stable from 102.5 to 72.5 cm with an average concentration of 7 × 10⁻³ μg mg−1. Total nitrogen decreases slightly between 62.5 and 0 cm reaching a concentration of 5 × 10⁻³ μg mg−1 at the surface of the core.
C/N ratio
The ratio of total carbon to total nitrogen (C/N) in the core (Figure 8c) decreases from the base to the surface. This decrease is initially relatively rapid and slows towards the surface with three spikes in C/N at 180, 122.5, and 17.5 cm. Peaks in C/N at 217.5 cm depth with a value of 23 and decreases to 8 at the surface of the core.
Stable carbon isotopes (δ13C)
The profile of δ13Corg fluctuates significantly (Figure 8d). The highest δ13C value of −22.25‰ occurs at 77.5 cm depth, while the lowest δ13C value of −23.98‰ occurs at 7.5 cm. There is a slight increase in average δ13C values from the base of the core at 225.5–77.5 cm, while from 77.5 cm to the surface of the core there is an average decrease in δ13C values.
Stable nitrogen isotopes (δ15N)
The δ15N ratio is close to 0 at the base of the core and rises rapidly to an average of 6.86‰ between 205 cm and 135 cm (Figure 8). The δ15N ratio decreases sharply to 2.48‰ at 132.5 cm depth and then increases steadily to 100 cm depth before exhibiting a sharp positive shift to 12.69‰ at 97.5 cm. Between 95 and 30 cm depth δ15N is relatively stable around a mean value of 7.4‰ before fluctuating more significantly in the upper 27.5 cm of sediment.
Between 117.5 and 102.5 cm, total carbon increases; total nitrogen increases significantly, more than doubling its pre-117.5 cm concentration; the C/N ratio transitions from a decreasing trend to an increasing trend; and there is a steady increase in δ15N, beginning slightly earlier at 130 cm. The only marker that does not appear to significantly change in this interval between 117.5 and 102.5 cm is δ13C.
Inorganic geochemical signatures
Concentrations of Hg show an excursion between 190 and 130 cm (Figure 9), and this may approximate the interval of the early 1960s to mid-1970s (Figure 4). In the lowermost portion of the core, between 230 and 190 cm depth, mercury concentrations are relatively low, ranging from 73 to 156 μg l−1. The peak Hg concentration is 417 μg l−1 at 170 cm. Between 130 cm and the surface the Hg concentration remains relatively consistent, but at slightly higher concentrations (116–211 μg l−1) than prior to the excursion.
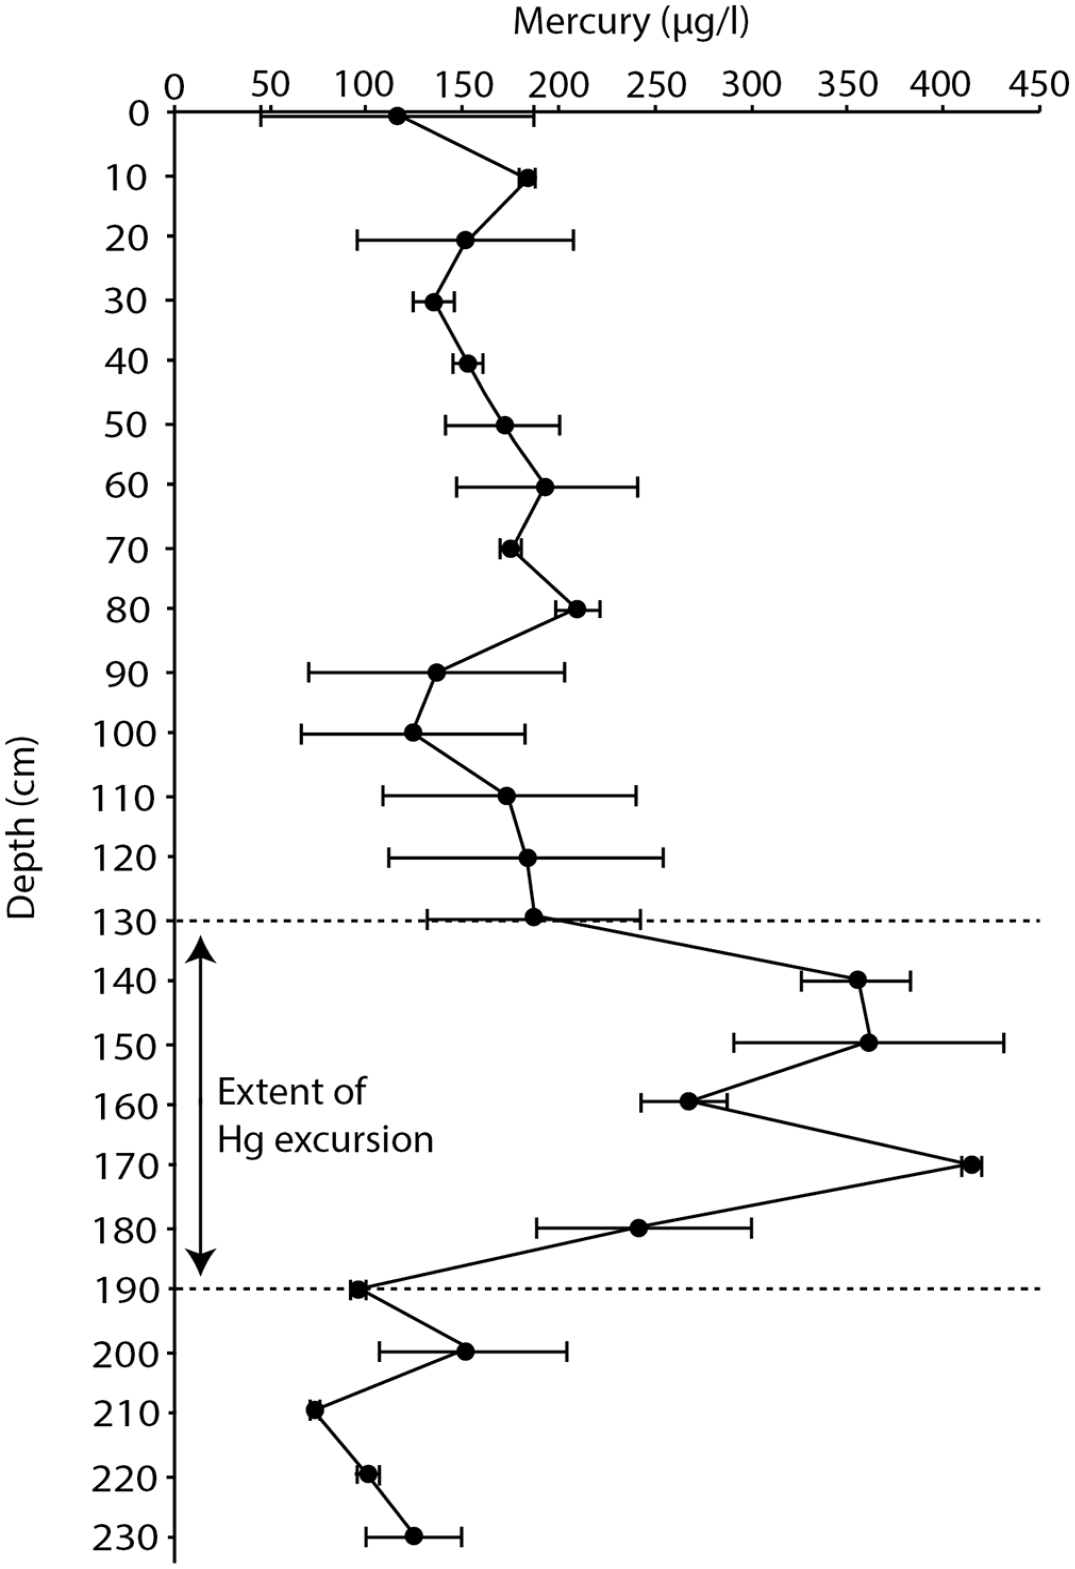
Downcore profile of Hg in core SFB-20A. A spike in concentration can be observed between 190 and 130 cm depth, which approximates the period from the early 1960s to 1975.
Heavy metals XRF
The profiles of Ti, V, Cr, Fe, Ni, Cu, Zn and Ag (Figure 10) exhibit fluctuating but relatively constant concentrations through the core. Sharp increases and decreases that can be seen at isochronous horizons across many of the elemental profiles appear to correspond with cracks in the core that scatter the XRF scanning (see Figure 2). A significant perturbation to the profiles of all the elements is observed at 112.5–108.5 cm. In this interval, the profiles of Ti, V, Cr, Fe, Ni and Cu decrease significantly with V decreasing to nearly zero. In contrast, the profiles of Zn and Ag increase dramatically. These excursions correspond almost precisely with the sandy lithological marker bed at 112–108 cm. Similarly, a smaller negative excursion is recognised in the profiles of Ti, V, Cr, Fe, Ni, Cu and Zn that coincides with the basal sand layer.
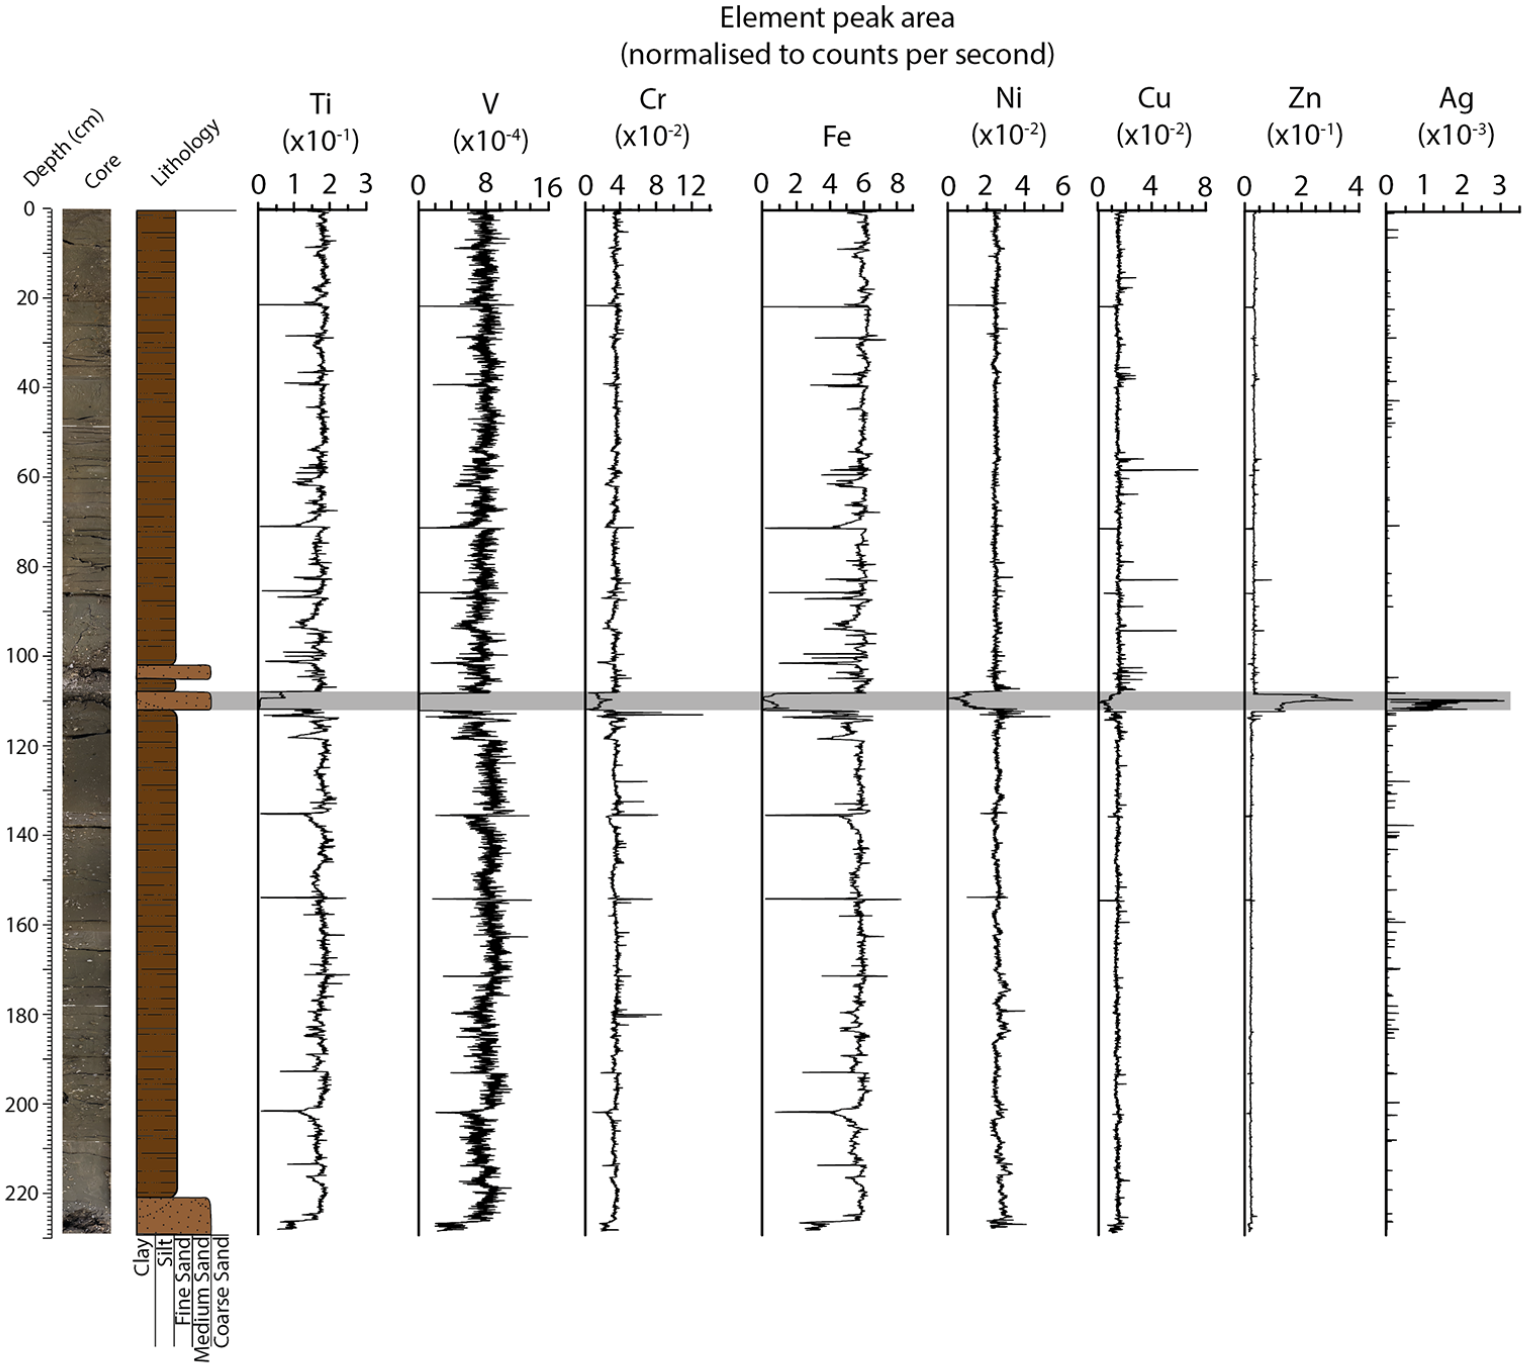
Profiles of heavy metals. The raw XRF data were provided as element peak areas, that is, the area under each of the peaks in the measured spectra. These values have been normalised to counts per second (CPS), which can account for variations in the detector’s ability to measure each interval of a sample. Variations in total CPS downcore may be related to variations in the sample surface morphology, texture, and matrix, rather than the sample’s elemental composition. Normalising the data to CPS eliminated this sedimentological artefact in the data. A significant perturbation in the elemental profiles is observed between 112.5 and 108.5 cm and is highlighted in grey. This change is associated with the influx of coarser sediment. Reproduced in colour in online version.
Biotic markers
Macrofauna
Bivalve molluscs are found at 229, 228, 213, 115 and 112–106 cm depth (Figure 12) and are generally associated with the coarser sand marker beds (Figure 2). The species observed in the core are the native oyster Ostrea lurida and the introduced clam Potamocorbula amurensis. The specimens are intact and non-articulated. Ostrea lurida is observed at 229, 228, 213 and 110 cm, and Potamocorbula amurensis at 115 cm (its first appearance datum; approximating to 1986) as well as individuals (<5 mm diameter) at each 1 cm interval between 112 and 106 cm. Potamocorbula amurensis reaches its maximum abundance at 111 cm.
Microfauna
Nine species of ostracod are recognised in the core (Figure 11). It is difficult to determine whether the ostracod taxa Cytherois sp., Leptocythere sp., Loxoconcha sp. are native due to the difficulties in identifying them to species level. Cytherois sp. is uncommon in the core and individuals lack ornamentation. Leptocythere sp. and Loxoconcha sp. appear to be primarily represented by juveniles, which often lack the characteristic morphology of their adult counterparts. However, Loxoconcha sp. resembles L. tamarinoidea (Swain, 1967), which is native to the Pacific Coast of northern Mexico (Swain and Gilby, 1974). Two non-native species of ostracods, Bicornucythere bisanensis and Spinileberis quadriaculeata, both native to the northwest Pacific Ocean, are first recorded at 128 cm, a level that approximates to 1975–1976 CE (see Figure 4) and continue to occur to the top of the core.
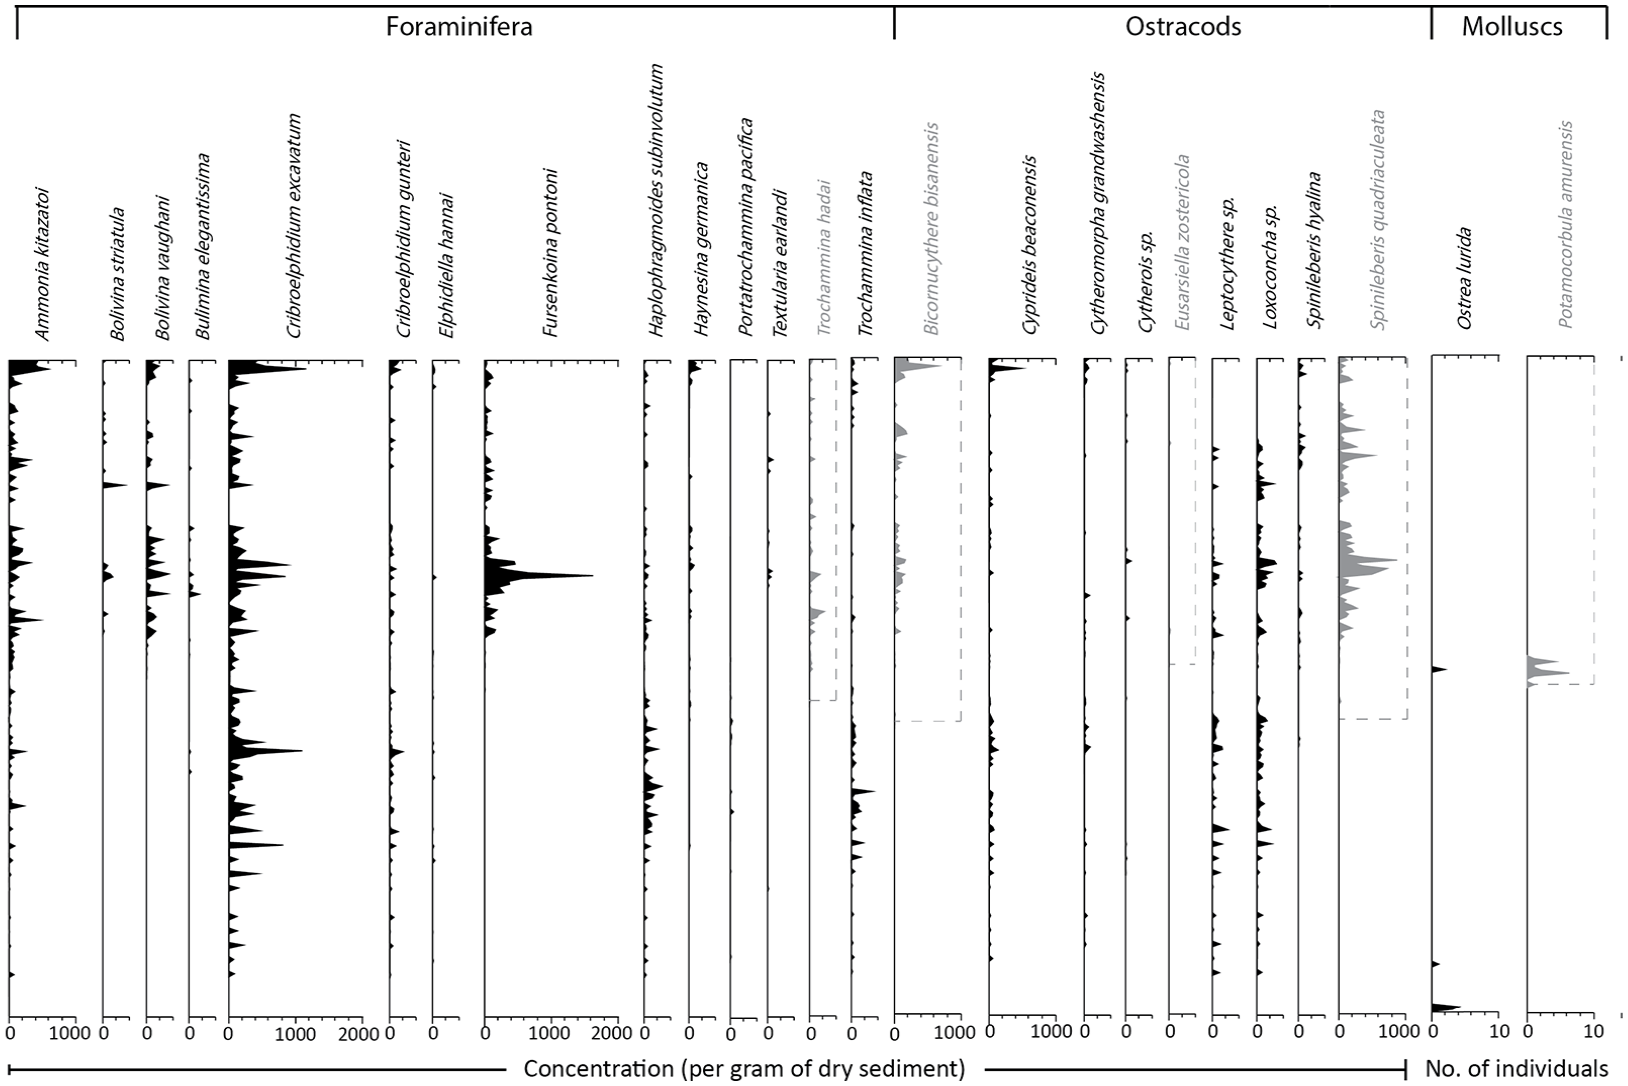
Profiles of the 14 foraminifer, 9 ostracod and 2 mollusc species recorded in core SFB-20A. Native species are plotted in black while non-native species are plotted in grey. The dashed grey boxes highlight the total stratigraphic ranges of the non-native species.
Fourteen species of foraminifera (estuarine and estuarine/marine) are observed in the core. The foraminifera are largely intact and are calcareous, with the exception of Textularia earlandi, Trochammina hadai and Trochammina inflata. Cribroelphidium excavatum is the most abundant foraminifer, mirroring other studies throughout the estuary (Lesen and Lipps, 2011; Sloan, 1992). The first appearance of the non-native foraminifer T. hadai is at 119 cm depth (approximating to 1983, Figure 4) with a concentration of 12.9 ind. gDM−1. The peak concentration of T. hadai is at 88 cm depth, with a concentration of 233.9 ind. gDM−1, comprising 23.5% of the assemblage. Trochammina hadai concentrations are lower towards the surface of the core, averaging 12.2 gDM−1 between 87 and 0 cm depth.
Microflora
Cyperaceae pollen has been used as a biostratigraphic marker of the 1982–83 El Niño event in a core sequence in the marshland south of the San Francisco Estuary (Conaway et al., 2004) and is therefore a potential chronological marker in core SFB-20A. The maximum observed abundance of Cyperaceae pollen occurs at 130 cm, though there is no clear peak in abundance relative to the rest of the dataset as the abundance of Cyperaceae throughout the core is consistently low, ranging from 0.65 to 3.79%.
Stratigraphic discussion
Mixing of the sedimentary column
The cores were transported in sealed aluminium core tubes from the United States to the United Kingdom to minimise transportation disturbance. The ITRAX core scanning (Figure 2) demonstrates that prolonged periods of silt deposition between 0–102 and 112–221 cm depth are relatively homogenous, although cracks in the core may pick out lamination boundaries. This could be explained by a surface mixed layer that may have been homogenised by a combination of physical and biological processes (Nittrouer et al., 1979). However, there is no evidence of bioturbation in the cut surface of the core and few deep-burrowing infauna are preserved.
The 210Pb-derived age profile exhibits a continual increase in age with depth (Figure 5), suggesting wholesale homogenisation of the sedimentary column via mixing has not occurred. The age–depth profile derived from the time series analysis of historical rainfall, Ti concentration and El Niño events also shows a continuous increase in age with depth (Figure 4). This time series age–depth relationship can be reconciled with discrete historical stratigraphic events with known ages in the cores to within a small number of years (Figure 4), suggesting it is a more accurate approximation of the chronology than that defined using 210Pb.
Analysis of 210Pb and the limited internal structure in the upper 108 cm of the core observed through X-ray imaging suggests that SFB-20A may have undergone a degree of sediment remobilisation. This may have occurred through a combination of current action, meiofaunal activity, and in the top centimetres, via bioturbation from benthic infauna. However, lack of wholesale homogenisation is supported by the order of stratigraphic occurrence of non-native species (Figure 11). It is predicted that the chronology of the stratigraphic signatures recorded in the core is relatively representative of the geological, including anthropogenic, history of the estuary and surrounding region, from the Gold Rush in the mid-19th century through industrialisation in the late 19th–20th centuries (Bouse et al., 2010).
Time series analysis of stratigraphic data
The annual peak in the scaled rainfall and the XRF measurements of Ti in the core correspond at periods of 3.4 cm (Figure 3), suggesting this is the average amount of sediment accumulating per year, which is consistent with the stratigraphic data. A chronology has been derived from these data, which is relatively consistent with the historical records of events in the core (Figure 4). However, it is noted that the conversion of depth to time using this approach is dependent on the validity of using the sediment load data from the Sacramento River as a proxy for the amount of sediment deposited at the location of the core in a specific period of time. The weak correlation (R2 = .6442) between the monthly rainfall and the Ti (Figure 3) (and other) heavy metal data is likely to be due to factors, such as marine input and local water currents, that are likely to influence sediment accumulation at the core site. In the absence of available data, marine input and local water currents have not been taken into account. Reworking and early compaction and diagenesis would also contribute to the mismatch between the results of the time series analysis and the stratigraphic data.
The time series chronology dates the lowermost occurrence of T. hadai at 119 cm to 1978 CE. This is 5 years earlier than its lowest recorded occurrence in the southern San Francisco Estuary in 1983 CE. Due to the intensity of benthic surveys in the late 20th century, this introduction date is thought to be well-resolved (McGann, 2014). The time series chronology dates the lowermost occurrence of P. amurensis at 115 cm to 1979 CE. This is 7 years earlier than its lowest recorded occurrence in the San Francisco Estuary in 1986 CE and 8 years earlier than its lowest recorded occurrence in the southern San Francisco Estuary in 1987 CE (Carlton et al., 1990). This offset could in part be due to the uncertainties associated with the time series chronology of at least ±0.64 cm per time horizon. However, as the inferred sedimentation rate is 3.4 cm per year, and the time series chronology is resolved to monthly resolution, this error represents a temporal range of ±2.4 months and is not significant enough to contribute to the 5 years offset of the biostratigraphy in the 1980s alone. Either this means that T. hadai and P. amurensis were introduced earlier (there is no observational data to support this) or there were changes in sedimentary patterns that are not detected by the spectral analysis, resulting from natural episodic events, outwashing of material from anthropogenic sources, or redistribution of sediments during dredging.
The time series chronology, defined using sediment load data from the Sacramento River to scale the time intervals to depth, results in a small increase in the sediment thickness per unit time (Figure 4), which contradicts the expected trend of sediment compaction with depth. Thus, small inaccuracies within the time series age model may account for the offset in the dates of events with the known historical evolution of the San Francisco Estuary. Refining the age model in future may reduce the offset with the biostratigraphy.
Inorganic geochemical markers
Elemental and isotopic concentrations in San Francisco Estuary are strongly linked to environmental conditions, in particular the relative influence of freshwater fluvial discharge versus saline marine influx into the estuary. Strong seasonality in water column salinity has been demonstrated in samples taken near Palo Alto at the southern end of the estuary, with annual salinity minima generally occurring between January and March and annual salinity maxima generally occurring between August and October (Moon et al., 2005). Analyses of sedimentary samples from Palo Alto from 1994 to 2004 CE show that concentrations of Cr, V, Ni, Cu, Zn, Ag, Hg and Se correlate positively with periods of higher freshwater discharge in late winter (Moon et al., 2005). Profiles of several of these elements, in addition to other heavy metals such as Ti and Fe in core SFB-20A derived from XRF core scanning are shown in Figure 10. They may be used as a record of fluvial discharge that can be directly compared with measured rates of discharge into the bay in addition to their indirect use in the time series analysis.
Organic matter proxies
Freshwater inflow and its associated nutrient loads are linked to primary productivity in San Francisco Estuary (Jassby and Powell, 1994). In wetter conditions, higher suspended nutrient loads are flushed into the estuary, which often lead to phytoplankton blooms (Cloern, 1996). Organic carbon generally has a lower δ13C signature in freshwater, potentially leading to negative shifts in δ13C in the sedimentary record of San Francisco Estuary during wetter conditions. In contrast, organic carbon from estuarine–marine sources generally has a higher δ13C signature, potentially leading to positive shifts in δ13C in the sedimentary record of San Francisco Estuary during drier conditions when there was reduced fluvial influence in the estuary. Approximately 67% of samples analysed for 13C and 15N have an isotopic composition of 6 to 8‰ δ15N and −22 to −24‰ δ13Corg. This isotopic composition is characteristic of benthic diatoms and estuarine–marine phytoplankton in San Francisco Estuary (Cloern et al., 2002) and indicates that these may be one of the primary sources of organic carbon and nitrogen in the core sediments. Negative excursions of both δ13C and δ15N are recognised in sedimentary deposits from the late 19th century. Analysis of deeper core sequences in the future may reveal negative shifts in these isotopic ratios that provide additional markers of the Anthropocene.
Radioisotopes
The stratigraphic record of 241Am in core SFB-20A is temporally sporadic, having only been recovered at 75, 20 and 0 cm depth. In comparison, 137Cs is recorded relatively continuously from its lowest occurrence at 115 cm to the surface of the core. The first record of 137Cs occurs in at 115 cm, 4 cm above the lowest occurrence of Trochammina hadai, which was introduced to the San Francisco Estuary in 1983 CE and concurrently with the lowest occurrence of Potamocorbula amurensis, which was introduced the San Francisco Estuary in 1986 CE. The first record of 137Cs at 115 cm suggests initial recovery of 137Cs is in the 1980s, approximately three decades later than it is typically observed in stratigraphic successions both in San Francisco Estuary and across the globe (Fuller et al., 1999; UNSCEAR, 2000) and after atmospheric testing of nuclear weapons had ceased in the 1960s (UNSCEAR, 2000). There is also no clear peak in concentration in the radiometric isotope data that would indicate the peak in atmospheric nuclear weapons testing in 1963–1964 CE (UNSCEAR, 2000), or with any theoretical inputs from local nuclear handling and defence activities in the mid-1940s to the late 1960s. The lowest occurrence of 137Cs at 115 cm depth may not represent the true lowest occurrence of 137Cs in San Francisco Estuary as this depth should be in the 1980s based on the biostratigraphy.
In estuarine sediment cores from Australia, 137Cs is observed in the upper sedimentary column as a result of fluvial discharge containing sediment-bound 137Cs (Pfitzner et al., 2004). Another mechanism that could result in re-deposition of 1950s–1960s 137Cs is selective re-suspension and relocation of fine-grained particles into regions of lower wave and current energy (Edgington and Robins, 1990; Orpin and Woolfe, 1999), including following dredging or land redevelopment activity. Additionally, 137Cs diffusion in sedimentary pore waters has been observed to move 137Cs 2–4 cm vertically up or down in successions (Torgersen et al., 1983). Any one or a combination of these factors could account for the continued presence of 137Cs in the upper sedimentary column of the southern San Francisco Estuary into the 21st century.
The profile of 239+240Pu shows relatively low activities between 225 and 120 cm, an increase between 120 and 45 cm, and a decrease above 45 cm. Based on extrapolation of the age profile between 167 and 140 cm, the base of the core (230 cm) is dated to about 1952 CE. The increase in 239+240Pu at 120 cm occurs within 1 year of the lowest occurrence of T. hadai at 119 cm, which was introduced to the San Francisco Estuary in 1983 CE, suggesting the resuspension, remobilisation and re-deposition of sediments or soils labelled with mid-20th century Pu (including that generated during the 1963–1964 CE weapons fallout maximum) from elsewhere in the Bay or its catchment, as argued for 137Cs (above). Within oceans, plutonium is strongly sediment-bound, the result of which is that its distribution is affected by currents and the movement of sediment (Zheng and Yamada, 2006). Overall, the broad similarity (given the differing sampling resolution) between the timing of the increases in 137Cs and 239+240Pu (i.e. in the early 1980s), effectively generating a sedimentary unit of slightly higher activity overlying a unit where activities are lower (or, in the case of 137Cs below detection limits) indicates that these sediments do not retain an accurate record of temporal fallout variations, but instead record a signal of sedimentary reworking of these anthropogenic radionuclides from the wider Bay and its catchment.
Hg
The earliest anthropogenic marker identified in core SFB-20A is the upturn in Hg concentration observed between 190 and 170 cm depth, here interpreted to be no younger than the early 1960s, based on the age model produced to 167 cm depth (Figure 4). Across this interval Hg concentrations increase more than fourfold from 96 μg l−1 at 190 cm to 417 μg l−1 at 170 cm (Figure 9). In the southern San Francisco Estuary the principal source of Hg is the New Almaden mines located approximately 30 km south-east of the estuary (Conaway et al., 2004; Thomas et al., 2002). Conaway et al. (2004) quantified a Hg peak in a tidal marsh coring site between the Guadalupe River and Coyote Creek in the lower southern San Francisco Estuary beginning in 1870 CE. The Hg concentration peaks post-World War II (WWII) and the Hg concentrations reduce significantly by 1983 CE (Conaway et al., 2004).
The Hg excursion in core SFB-20A begins at 190 cm and culminates at 130 cm, 2 cm below the lowest occurrences of Bicornucythere bisanensis and Spinileberis quadriaculeata at 128 cm, which are dated to approximately 1975–1976 CE based on the time series chronology and their potential correlation with a drought period at that time (Figure 4). In this interval, the lowest annual average precipitation was recorded in the San Francisco Estuary since 1950 (GG Weather, 2022). High post-WWII demand for Hg resulted in a spike in Hg production in the 1960s and 1970s, during which time much of the production at the New Almaden mines was achieved through open-cut mining, exposing and potentially mobilising large areas of soil (Cargill et al., 1980; Yee et al., 2011). The Hg spike corresponds closely with this period of increased Hg demand and consumption. However, given that a large peak in Hg concentrations is also observed in a core near Oakland, distant from mining sources, and given urbanisation of much of the San Francisco Estuary, local industrial sources may also be the primary driver of the post-WWII maximum (Yee et al., 2011). Therefore, the Hg spike observed in core SFB-20A is likely a result of late-20th century increases in Hg production and consumption rather than the deposition of Hg washed into the estuary during the heyday of Hg production in California in the late 19th century (Yee et al., 2011). Indeed, deeper stratigraphic sections may record a higher Hg peak in the late 19th/early 20th centuries as has been recorded in other stratigraphic sections across San Francisco Estuary. Core sequences with a longer temporal range may be expected to record a signature of early Hg production in the late 19th century associated with industrial activities in the late Holocene, followed by a second increase in Hg concentrations from the 1960s, which would demarcate sedimentary deposits of Anthropocene age.
Biotic markers
The lowermost stratigraphical records of non-native species in core SFB-20A are of the Asian ostracods, Bicornucythere bisanensis and Spinileberis quadriaculeata, at 128 cm depth, which approximates to 1975–1976 CE based on the time series chronology and their possible correlation with a drought event (Figure 4). Both B. bisanensis and S. quadriaculeata are abundant on silty substrates and in brackish waters (with salinity ranging from 20 to 30 psu) in their native enclosed inner bays of Japan (Irizuki et al., 2006). Their salinity preference in their native range suggests that both species are better adapted to relatively higher salinities in estuarine settings. They first occur during a shift towards positive δ13Corg values, which culminates in the highest δ13Corg observed at 125 cm. In 1975–1976 CE, the lowest average annual precipitation (AAP) since 1950 CE was recorded, during which just 39% of the AAP recorded since 1950 CE fell in the San Francisco Estuary. The resulting brackish conditions in San Francisco Estuary may have facilitated the establishment of both ostracod species. Bicornucythere bisanensis is also known to be pollution resistant (Yasuhara et al., 2007, 2012, 2019), which may have aided its establishment in San Francisco Estuary.
This biostratigraphy assumes that the first record of these taxa in core SFB-20A represents the lowest occurrences of these taxa in San Francisco Estuary. Coring from an additional six locations in the southern San Francisco Estuary has recorded these taxa in the upper parts of the sedimentary succession. Across these core successions, a consistent, biostratigraphically useful order of appearance of non-native taxa was recorded that allowed correlation of the cores. As they are readily distributed by water currents and are some of the most abundant native ostracod taxa in estuaries across Japan, it is possible that these taxa spread quickly across the brackish areas of San Francisco Estuary in a similar manner to the foraminifer T. hadai, which was distributed across all of the southern San Francisco Estuary within 3–4 years of its introduction (McGann, 2014). The introduction of T. hadai is well-resolved in San Francisco Estuary through detailed ecological studies in the late 20th century and it is reported to have arrived in 1983 CE and proliferated rapidly through the southern San Francisco Estuary (McGann, 2014).
The lowest appearance of Potamocorbula amurensis is at 115 cm and is represented by a single juvenile. This is dated to circa 1986 CE based on the known arrival time of this species into San Francisco Estuary. Some 93.8% of individuals are observed between 112 and 106 cm and coincide with the sandy lithological marker beds at 112–108 and 105–102 cm depth. Potamocorbula amurensis has been found across the estuary in subtidal locations occurring on all sediment types, although is most abundant on mixed mud–sand substrates (Carlton et al., 1990), such as the sandy lithological marker beds observed in core SFB-20A. The presence of the biostratigraphic markers T. hadai, P. amurensis, B. bisanensis and S. quadriaculeata in the late 20th century would enable identification of sedimentary deposits of Anthropocene age.
Spheroidal carbonaceous particles
The lowermost stratigraphic occurrence of spheroidal carbonaceous particles (SCPs) in core SFB-20A is at 165 cm depth (Figure 7), dated to the 1960s (Figure 4). The peak abundance of SCPs in the core is at 81 cm depth. Approximately 74.5% of samples containing SCPs are represented by a single SCP. In some cases, such as in the sample at 83 cm depth, the single SCP recovered represents a concentration of 620 gDM−1. This is significantly higher than the detection limit of 80–100 gDM−1 (Rose, 1994), suggesting that many of the samples analysed which contained zero SCPs may not represent the true concentrations across the estuary at that time. The concentration of a single SCP exceeding the detection limit could account for the relatively late inferred lowest occurrence of SCPs in core SFB-20A as the confidence intervals on the data are very large. Across the globe, SCPs in sediment records typically are first observed in the late 19th and early 20th century, peaking in abundance in the late 20th century (Rose, 2015). Core SFB-20A does not extend deep enough to test for the presence of SCPs in the late 19th century. The inferred lowest occurrence of SCPs in core SFB-20A appears to be in the mid/late 1960s (a little later than the start of the Hg excursion, and in part supported by the time series chronology) and likely post-dates their introduction in the stratigraphic record of the estuary, as the San Francisco Estuary has an industrial history dating back to the mid-19th century. Indeed, this is significantly later than the first observations of SCPs in sediments taken from the West Woast of the USA, including in Sequoia National Park (Landers et al., 2008). Absence of SCPs in the sedimentary record below 165 cm may be due to concentrations being below detection limits prior to the 1960s. The absence of SCPs below this depth is likely accounted for by the relatively high sedimentation rates in the estuary causing the concentration to be diluted and also may be influenced by the westerly prevailing wind direction, while the majority of combustion-powered plants are to the east of San Francisco Estuary (although other sites in the western USA show more complete SCP profiles) (Landers et al., 2008). The variations in sedimentation rate through time may account for the multiple peaks in the dataset. As the entire SCP record in core SFB-20A post-dates the proposed mid-20th century onset of the Anthropocene, identification of SCPs in the stratigraphic record of the southern San Francisco Estuary would enable the identification of sedimentary deposits of Anthropocene age.
Nitrogen
After WWII agricultural nitrogen consumption in the USA increased, though most agricultural areas still received relatively low nitrogen fertiliser input. Due to the expansion of cropland and the rapid increase in N fertiliser usage from 1960 to 1980 CE, the area receiving high N input across the USA greatly increased. In particular, the West Coast showed a dramatic increase in N usage by 1980 CE. This is potentially reflected in the profile of N in core SFB-20A. Between 117.5 and 77.5 cm depth the total nitrogen increases from 3.39 × 10⁻³ to 7.49 × 10⁻³ μg mg−1 (Figure 8b). The increase in total nitrogen coincides closely with the lowermost stratigraphic occurrences of Trochammina hadai and Potamocorbula amurensis and is consistent with the dramatic increase in N usage in the western USA by 1980 CE. The increase in total nitrogen associated with the 1980s coinciding with the lowest occurrences of T. hadai and P. amurensis supports the lowest occurrence datums of T. hadai and P. amurensis in 1983 and 1986 CE respectively (Figure 12), rather than the late 1970s (Figure 4) defined through the time series chronology and suggests variations in sedimentation rate occur across this interval.
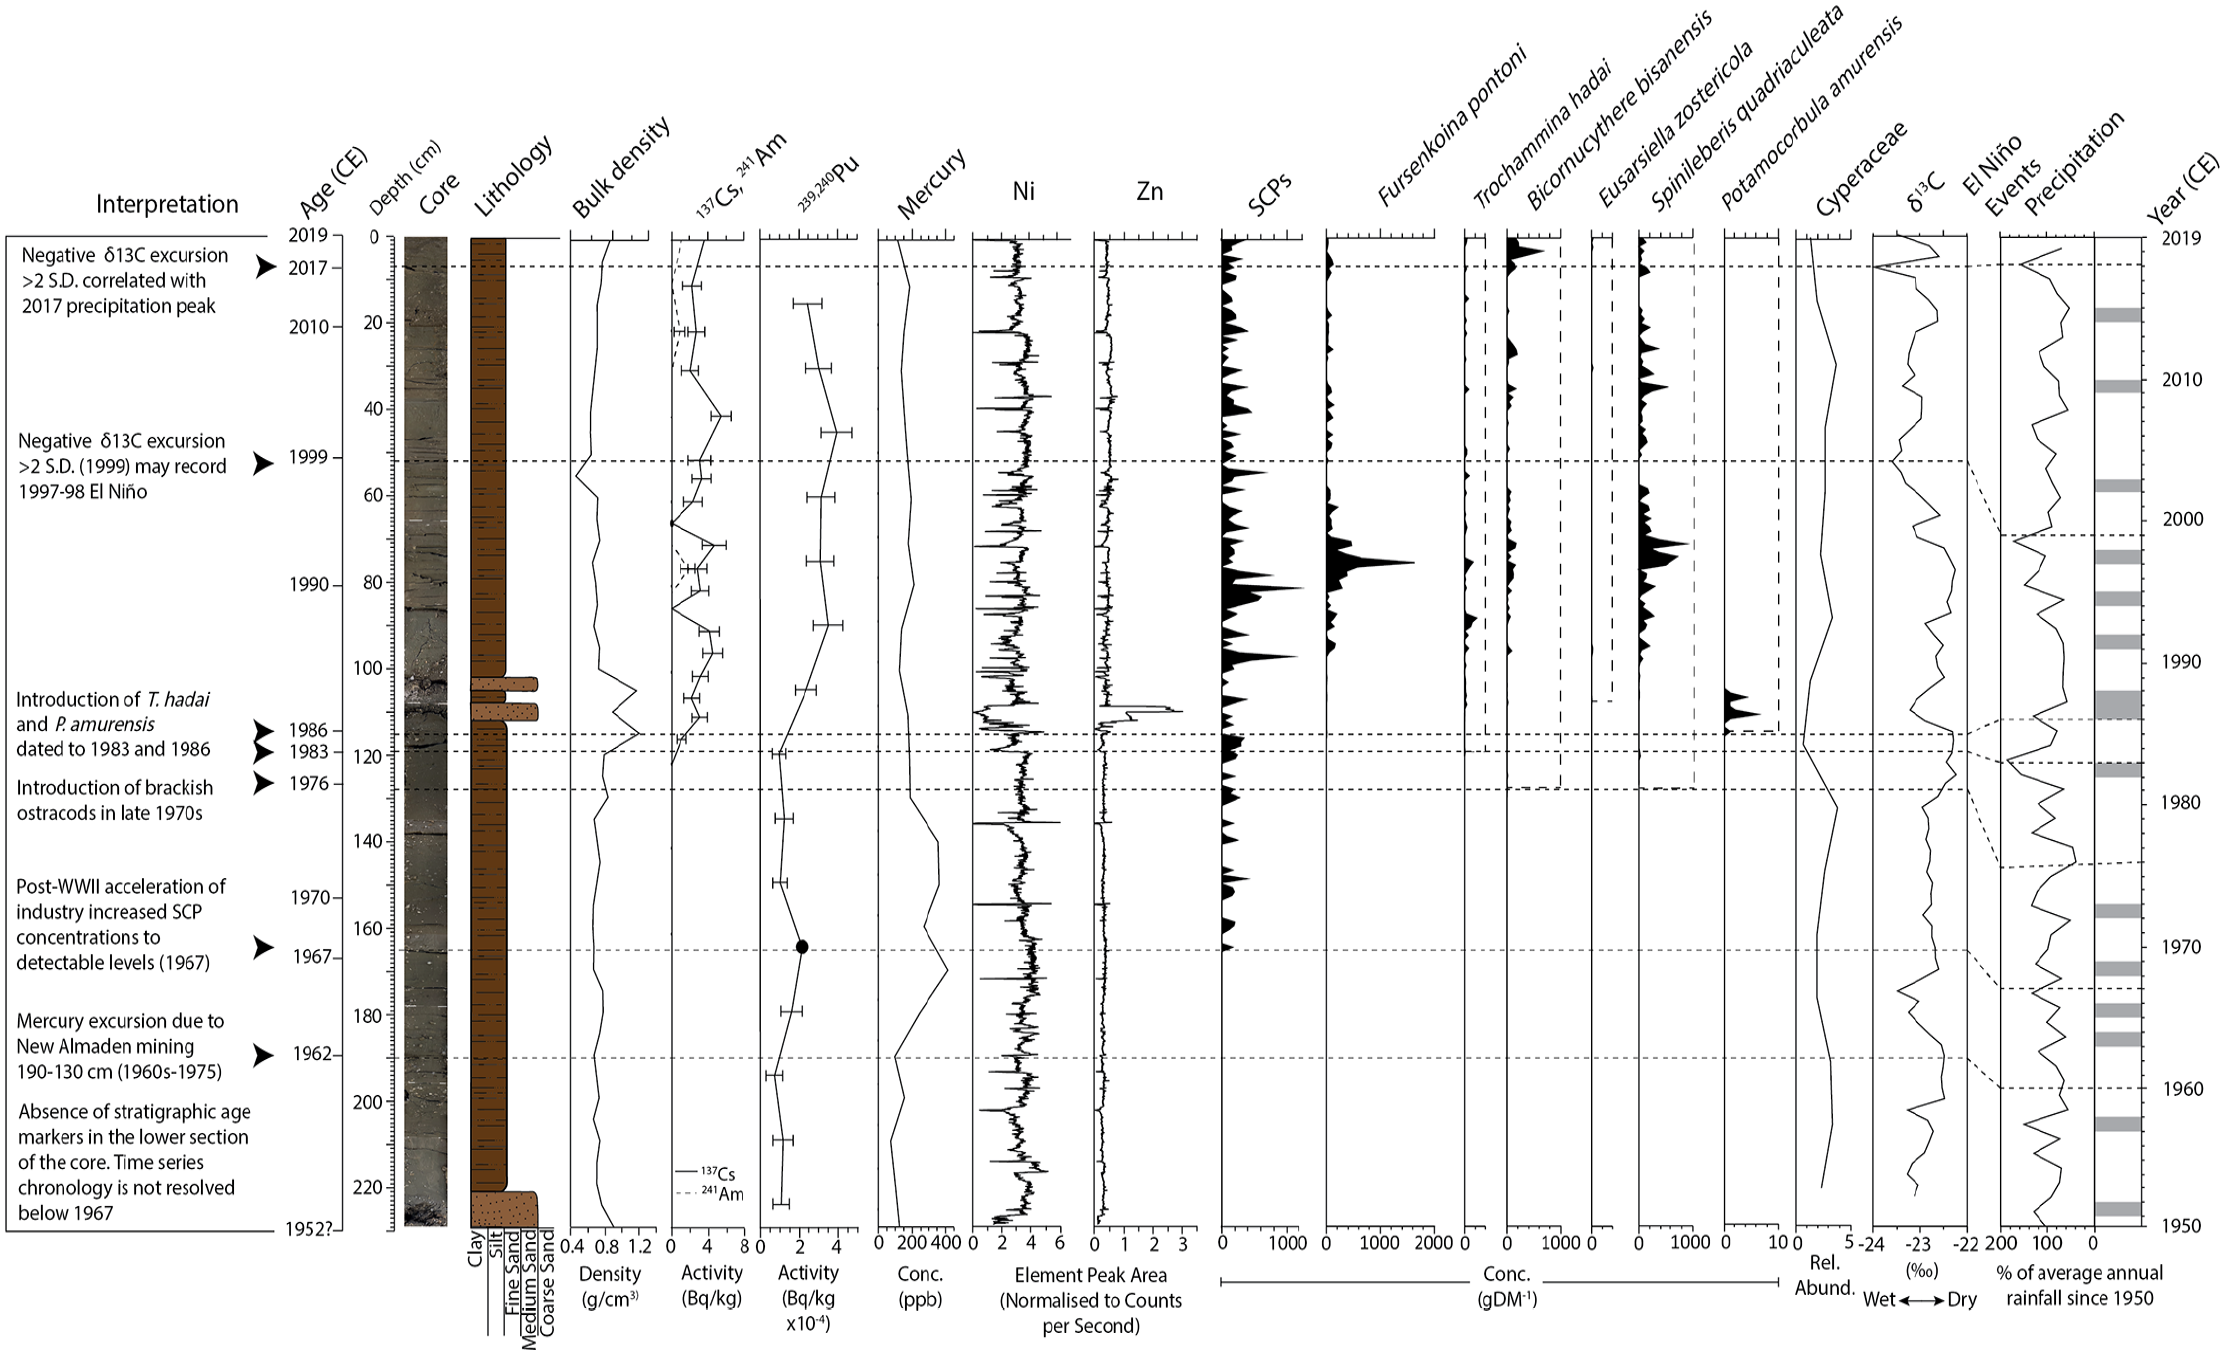
Summary of the stratigraphic signature of anthropogenic markers recorded in core SFB-20A. The chronology on the left is derived from the time series analysis and should be considered approximate for some intervals (see Figure 4), with the exception of the biostratigraphic signatures in 1983 and 1986, which are considered more robust age markers. The chronology on the right is from historical records of precipitation and El Niño events. Interpreted events are represented by black dashed lines and include the mercury excursion and lowest occurrence of SCPs in the 1960s, the lowest occurrence of the East Asian ostracods Bicorncythere bisanensis and Spinileberis quadriaculeata, which may be associated with the 1975–76 drought, and negative δ13C excursions greater than 2 standard deviations from the mean at 52.5 and 7.5 cm which are correlated with peaks in the precipitation profile and dated to 1999 and 2017. The sample at 165 cm in the profile of 239,240Pu represents the Limit of Detection, LOD, value as 239,240Pu was not definitively quantified in that sample. The surface of core is 2019. Reproduced in colour in online version.
In the southern San Francisco Estuary, Public Owned Treatment Works (POTWs) account for more than 90% of direct total dissolved inorganic nitrogen loads (Novick and Senn, 2014). Most POTWs around San Francisco Estuary only carry out secondary treatment of their wastewaters, which generally does not remove nitrogen (Grossinger and Beyeler, 2015). The closest POTW to core SFB-20A is the Silicon Valley Clean Water POTW (BOAI, 2022), the outfall of which is approximately 4 km west of core 20A (Figure 1). This POTW was constructed in 1980 CE (Sea Change SMC, 2022) and may further contribute to the observed increase in total nitrogen between 117.5 and 102.5 cm. The increased concentration of nitrogen in the 1980s is a marker of late 20th century industrial activity that demarcates sedimentary deposits of Anthropocene age.
Conclusions: Assessment for GSSP candidacy
The time series analysis based on assuming a relationship between heavy metal concentrations and the sediment load entering the estuary suggests a continuous chronology to circa 167 cm depth that extends to approximately 1967 CE, which is the earliest available sediment load data for the San Francisco Estuary. Absence of a clear mid-20th century bomb spike and lack of laminations within the core makes calibration of the chronology challenging. No firm dates can be assigned below 167 cm, but the base of the core at 230 cm may extend to the early 1950s or possibly a little earlier. The core is missing substantial sedimentary successions below this time that would allow the stratigraphic signatures prior to the proposed Holocene–Anthropocene boundary to be quantified. Future work could target the sedimentary deposits in South Bay with a more powerful coring rig in order to extend the stratigraphic record deeper in time.
The time series chronology shows reasonably close agreement with some events in the core. However, in some instances there is an offset of a small number of years that may be accounted for by uncertainties in the time to depth conversion used in the time series. The discrete biostratigraphic events appear to be the most accurate time points for defining age horizons and for correlation of sedimentary successions across the estuary.
The lowermost stratigraphical marker of anthropogenic activity in core SFB-20A is the Hg excursion beginning at 190 cm that may reflect mining activities beginning in the early 1960s. Biostratigraphical markers are extensive from 128 cm, with the ostracods Bicornucythere bisanensis and Spinileberis quadriaculeata probably indicating the mid-1970s, and at depths 119 and 115 cm, respectively the foraminifer Trochammina hadai and mollsuc Potamocorbula amurensis, indicating the 1980s. Trochammina hadai has been recovered in 20 cores across San Francisco Estuary, while P. amurensis, B. bisanensis and S. quadriaculeata have been recovered in a further six cores (unpublished information of the authors), suggesting they are widespread and useful biostratigraphical markers of Anthropocene deposits therein. Although there is no evidence of a gap in the sedimentary succession or wholesale reworking of the sediments, some of the later dates of the stratigraphic markers may have resulted from a degree of sedimentary recycling within the estuary in addition to some degree of bioturbation. Core SFB-20A does not meet the criteria for a GSSP because failure to recover core material that can be clearly dated to the 1950s and earlier means that it is not possible to demonstrate a clear transition from late Holocene to early Anthropocene sediments. Nevertheless, it is of considerable value in demonstrating a discrete and clear palaeontological signature of an Anthropocene series.
Supplemental Material
sj-docx-1-anr-10.1177_20530196221147607 – Supplemental material for The San Francisco Estuary, USA as a reference section for an Anthropocene series
Supplemental material, sj-docx-1-anr-10.1177_20530196221147607 for The San Francisco Estuary, USA as a reference section for an Anthropocene series by Stephen Himson, Mark Williams, Jan Zalasiewicz, Colin Waters, Mary McGann, Richard England, Bruce E Jaffe, Arnoud Boom, Rachael Holmes, Sue Sampson, Cerin Pye, Juan Carlos Berrio, Genevieve Tyrrell, Ian P Wilkinson, Neil Rose, Pawel Gaca and Andrew Cundy in The Anthropocene Review
Supplemental Material
sj-docx-2-anr-10.1177_20530196221147607 – Supplemental material for The San Francisco Estuary, USA as a reference section for an Anthropocene series
Supplemental material, sj-docx-2-anr-10.1177_20530196221147607 for The San Francisco Estuary, USA as a reference section for an Anthropocene series by Stephen Himson, Mark Williams, Jan Zalasiewicz, Colin Waters, Mary McGann, Richard England, Bruce E Jaffe, Arnoud Boom, Rachael Holmes, Sue Sampson, Cerin Pye, Juan Carlos Berrio, Genevieve Tyrrell, Ian P Wilkinson, Neil Rose, Pawel Gaca and Andrew Cundy in The Anthropocene Review
Supplemental Material
sj-docx-3-anr-10.1177_20530196221147607 – Supplemental material for The San Francisco Estuary, USA as a reference section for an Anthropocene series
Supplemental material, sj-docx-3-anr-10.1177_20530196221147607 for The San Francisco Estuary, USA as a reference section for an Anthropocene series by Stephen Himson, Mark Williams, Jan Zalasiewicz, Colin Waters, Mary McGann, Richard England, Bruce E Jaffe, Arnoud Boom, Rachael Holmes, Sue Sampson, Cerin Pye, Juan Carlos Berrio, Genevieve Tyrrell, Ian P Wilkinson, Neil Rose, Pawel Gaca and Andrew Cundy in The Anthropocene Review
Footnotes
Acknowledgements
We would like to acknowledge the Haus der Kulturen der Welt (HKW, Berlin) for collaborating with the Anthropocene Working Group in the assessment of the candidate GSSP-sites. The collaboration was realised in the framework of HKW’s long-term initiative Anthropocene Curriculum, an international project for experimental forms of Anthropocene research and education developed by HKW and the Max Planck Institute for the History of Science (MPIWG, Berlin) since 2013. We would like to thank the U.S. Geological Survey for access to their core repository and for use of their facilities to process and analyse core samples. We would also like to thank the British Ocean Sediment Core Research Facility for undertaking the XRF core scanning. Stephen Himson is grateful to the University of Leicester for a College of Science and Engineering PhD scholarship. Any use of trade, firm, or product names is for descriptive purposes only and does not imply endorsement by the U.S. Government.
Declaration of conflicting interests
The author(s) declared no potential conflicts of interest with respect to the research, authorship, and/or publication of this article
Funding
The author(s) disclosed receipt of the following financial support for the research, authorship, and/or publication of this article: The authors received financial support from the Haus der Kulturen der Welt (HKW, Berlin).
Supplemental material
Supplemental material for this article is available online.
References
Supplementary Material
Please find the following supplemental material available below.
For Open Access articles published under a Creative Commons License, all supplemental material carries the same license as the article it is associated with.
For non-Open Access articles published, all supplemental material carries a non-exclusive license, and permission requests for re-use of supplemental material or any part of supplemental material shall be sent directly to the copyright owner as specified in the copyright notice associated with the article.