
Abstract
Annually laminated stalagmites ER77 and ER78 from Grotta di Ernesto provide an accurate annual record of environmental and anthropogenic signals for the last ~200 years. Two major transitions are recorded in the stalagmites. The first coincides with the year 1840 CE, when a change from porous and impurity-rich-laminae to clean, translucent laminae occurs. This is accompanied by a steady increase in the growth rate, a decrease in fluorescence and a sharp increase in δ13C values. These changes concur with the end of the Little Ice Age. The second transition takes place around the year 1960 CE and corresponds with an increase in both annual growth rate and sulfur concentration in stalagmite ER78 at 4.2 mm from the top, and with the deflection point in the 14C activity curve in stalagmite ER77 at 4.8 mm from the top. This latter is the stratigraphic signal proposed as the primary guide for the definition of the Anthropocene series. The following shift toward depleted δ34S–SO4 in stalagmite ER78 suggests that industrial pollution is a major source of sulfur. The interpretation of atmospheric signals (S, δ34S, 14C) in the stalagmites is affected by attenuation and time lags and the environmental signals are influenced by soil and ecosystem processes, while other anthropogenic signals (δ15N, 239Pu) are not recorded. For these reasons, the stalagmite record is here proposed as an auxiliary (reference) section rather than a global standard. In summary, Grotta di Ernesto contains one of the best stalagmite records documenting the Anthropocene, and one of only two stalagmite records where the S peak has been measured at high resolution.
Keywords
Introduction
This special issue, part of the work of the Anthropocene Working Group (AWG), presents data on 12 candidate archives for definition of the Anthropocene series. A primary record will be chosen for consideration as a Global boundary Stratotype Section and Point (GSSP). The other archives may serve as additional references (auxiliary sites) to assist in global correlation of the Anthropocene signals. At this stage, the Grotta di Ernesto site is put forward as an auxiliary site because of natural delays in recording some signals through the overlying soil and ecosystem and lack of detectability of some signals of radioactive fallout.
The preparatory activities of the Anthropocene Working Group, including events leading to the submission of GSSP proposals and the binding decision that the base of the Anthropocene should align with stratigraphic signals dating to the mid-20th century, are detailed in the introductory article to this special issue (Waters et al., 2023).
Speleothems, and in particular annually laminated stalagmites, are increasingly being utilized for high-resolution paleoenvironmental and paleoclimate reconstructions as the presence of growth laminae ensures an annually resolved chronology, and their thickness chemical and isotopic composition are valuable proxies of paleoclimate information (Baker et al., 2021).
In this regard, Grotta di Ernesto is an excellent site because it is largely undisturbed and contains numerous active annually laminated stalagmites (Frisia et al., 2003). Moreover, it is one of the most extensively monitored cave sites worldwide where detailed hydrochemical monitoring, which has been carried out since 1993, established the relationships between speleothem proxy data and climate and environmental parameters (Borsato, 1995; Borsato et al., 2007; Borsato, 1997; Borsato et al., 2015a, 2015b, 2016; Fairchild et al., 2000, 2001; Frisia and Borsato, 2010; Frisia et al., 2000, 2003, 2005, 2008, 2011; Huang et al., 2001; Johnston et al., 2013; McDermott et al., 1999; Miorandi et al., 2010; Scholz et al., 2012; Smith et al., 2006, 2009; Wynn et al., 2010, 2013, 2014b, 2018).
Grotta di Ernesto came to light in the autumn of 1983, during excavation work for the construction of a forest road in the municipality of Grigno (Trento). In July 1984, the Museo Tridentino di Scienze Naturali (now Science Museum of Trento), began a systematic exploration and archeological survey and started an excavation intervention coordinated by Dr. G. Dalmeri. The cave, in fact, provided data on Mesolithic (ca. 9000 years BP) hunter-gatherers subsistence strategies related to ibex and red deer hunting (Dalmeri, 1985). At the conclusion of the archeological research, the Cultural Heritage Service of the Autonomous Province of Trento, promptly proceeded to safeguarding the cave by closing its entrance with a solid iron door, thus preventing human and animal intrusion as well as excessive air circulation. In the following years the cave became the subject of further in-depth paleoethnological and paleoenvironmental investigations (Awsiuk et al., 1991).
Monitoring of soil and cave air pCO2, drip water chemistry and in situ calcite precipitation allowed recognizing that calcite crystals mostly grow during the cold season, when cave CO2 concentration is at its lowest. This enhances dripwater CO2 degassing, hence raising the pH and the calcite supersaturation of the solution (Fairchild et al., 2000; Frisia and Borsato, 2010; Frisia et al., 2000; Huang et al., 2001; Miorandi et al., 2010).
The Holocene climate variability at Grotta di Ernesto was studied in detail by comparing the annual growth rate, fabrics, geochemical and isotopic composition of three stalagmites (ER76, ER77, ER78). All three stalagmites show visible laminae for most of their growth, which commenced ca. 8500 years BP (McDermott et al., 1999; Scholz et al., 2012). Each lamina is a couplet consisting of a translucent, non-fluorescent calcite layer (up to ~200 µm thick) and a thin brown (0.5–4 µm) fluorescent calcite layer enriched in soil-derived organic matter and a number of trace elements (Borsato et al., 2007; Fairchild et al., 2001; Frisia et al., 2000). Laminae are developed in calcite with a predominantly compact, columnar fabric for the past ca. 500 years, and in porous, microcrystalline and dendritic fabrics for most of the Late and Middle Holocene sections (Frisia et al., 2000; McDermott et al., 1999; Scholz et al., 2012).
The development of annual lamination in stalagmite ER78 was further investigated by using synchrotron-radiation-micro-X-ray fluorescence (SR-µXRF) and ion microprobe analyses to reveal chemical variability across the visible layers (Borsato et al., 2007, Figure 1). A series of elements display gaussian-shaped peaks centered around the thin brown fluorescent calcite layer, with peak concentration intensity ordered Y > Zn, Cu and Pb > P and Br. This hierarchy reflects the selectivity of transport of these elements, which are bound to organic colloids flushed from the soil zone during autumn infiltration (Hartland et al., 2012). Ion microprobe analyses indicate that H, Na, and F also increase (Fairchild et al., 2001). Sr displays a trough around the thin brown autumn layer, implying that its incorporation may be limited by competition with other elements and/or controlled by the growth mechanisms and growth rate (Borsato et al., 2007).
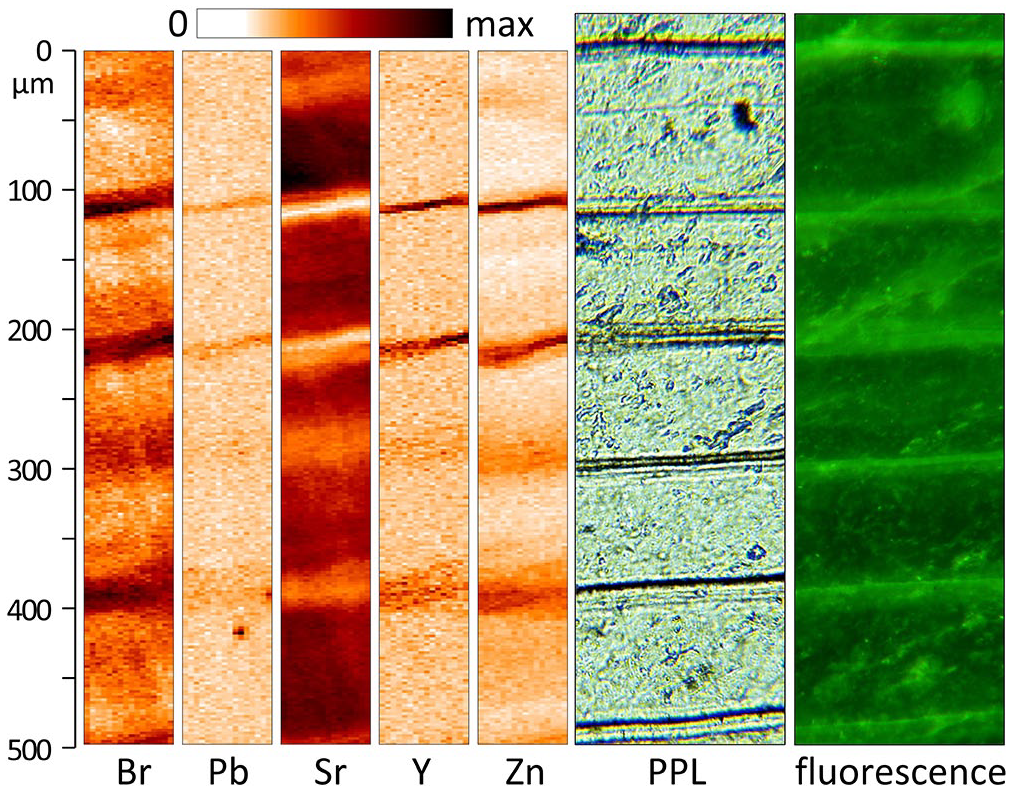
Annual laminae in stalagmite ER78 investigated with SR-µXRF (Borsato et al., 2007), optical (PPL plane polarized light) and fluorescence microscopy. Each lamina is a couplet consisting of a translucent, non-fluorescent calcite layer (~100 µm thick) enriched in Sr, and a thin brown fluorescent calcite layer enriched in soil-derived organic matter and a number of trace elements (Br, Cu, Pb, Y, Zn). In several laminae, the brown layer comprises a series of discrete thin (0.5–4 µm) layers, possibly marking distinct infiltration events. Reproduced in colour in online version.
Stalagmite growth rate at Grotta di Ernesto is positively correlated with surface air temperature (Frisia et al., 2003; Miorandi et al., 2010; Smith et al., 2006, 2009). By contrast, no such correlation exists with mean annual surface precipitation. Significant spectral density at 3, 7–8 and 11 years suggests an influence of both the North Atlantic Oscillation (NAO) and solar activity on stalagmite growth rates (Frisia et al., 2003). In particular, significant periodicities of ca. 7–8 and 3 years, which are typical for the winter time NAO index, have been identified in ER76, ER77, and ER78 data series. Critically, the same periodicities were detected in instrumental temperature series of Northern Italy (Frisia et al., 2003). Spectral analysis of the δ13C and δ18O records of ER76 revealed that climate variability at Grotta di Ernesto was influenced by both solar activity and the NAO throughout the Holocene, which led to the identification of six periods of warm winter climate with a duration between 100 and 400 years centered at 7.9, 7.4, 6.5, 5.5, 4.9, and 3.7 ka (Scholz et al., 2012).
In the last two decades, cave monitoring also included the analysis of colloidal transport in dripwater (Hartland et al., 2012), as well as sulfate concentrations and sulfate isotopes in both drips and stalagmites, aimed at establishing a speleothem archive of atmospheric sulfur composition (Borsato et al., 2015b; Fairchild and Frisia, 2014; Fairchild et al., 2009; Frisia et al., 2005, 2008; Wynn et al., 2010, 2013, 2014b). Soil carbon dynamics were investigated by analyzing the 14C activity and δ13C values of C dissolved in soil and cave drip water (Frisia et al., 2011). A 2-year-long monitoring study also revealed a pronounced annual cycle in 14C activity which is a function of drip-rate variability, soil moisture, and ultimately hydrology (Fohlmeister et al., 2010, 2011).
Materials and methods
Geographic and climatic setting
Grotta di Ernesto is located in the Province of Trento (Italy), in the Italian Pre-Alps (longitude 11.65751°E, latitude 45.97723°N) at 1167 m above sea level (asl). The cave opens on the north-facing slope of Sette Comuni karst plateau, and overlooks the Valsugana Valley (valley bottom at 230 m asl) (Figure 2). The cave consists of a single descending gallery, which opens into three successive chambers named (from the entrance to the innermost part) Sala del Focolare, Sala Grande, and Sala Terminale, for a total length of ca. 70 m. Most of the passages are decorated by actively forming stalagmites, stalactites, flowstones, pools, and spray deposits. The cave is cut in partially dolomitized, Jurassic limestone, overlaid by clay-rich calcareous brown soil (Calcari-Mollic Cambisols, pH 6.5–7.7) up to 100 cm thick. The present-day vegetation above the cave is a mixed conifer–deciduous forest association, composed of Fagus sylvatica, Picea abies, and Abies alba (Fairchild et al., 2009; Miorandi et al., 2010). Most trees started to grow around 1920 CE, after the forest clearance carried out to facilitate military operations before World War 1 (Apolloni, 1996; Lageard et al., 2007). This major ecosystem disturbance is recorded in stalagmite ER78 by organic-rich laminae enriched in heavy metals (Cu, Pb, Y, and Zn) in the period from 1900 to 1920 CE, which suggest enhanced leaching of trace elements through a disturbed soil profile (Borsato et al., 2007).
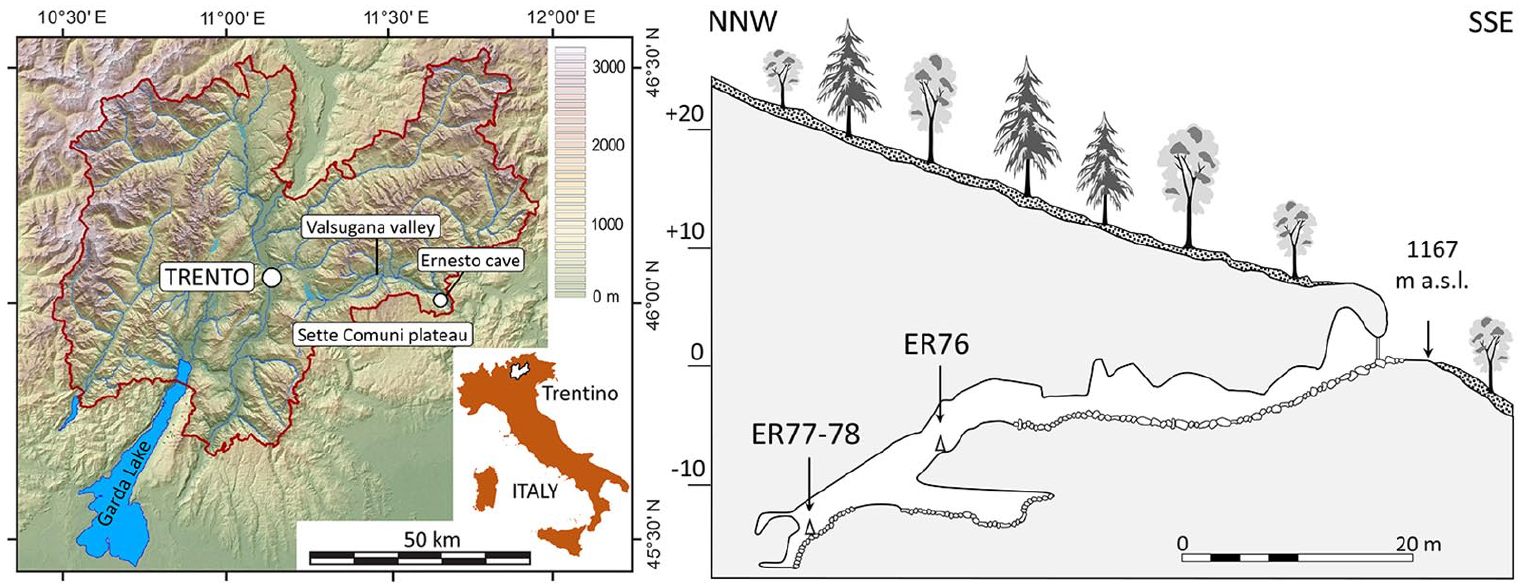
Location map and projected cross section of Grotta di Ernesto in Trentino (Province of Trento). The sampling sites of stalagmites ER76, ER77, and ER78 is shown. Reproduced in colour in online version.
The north-facing cliff location of the cave results in cool temperatures at the surface, with mean monthly air temperatures ranging from 0°C during winter to 15°C during summer. Annual precipitation varied from 531 to 2268 mm/year between 1921 and 2007, with a mean value of 1289 mm/year. The majority of precipitation occurs in spring/early summer (May/June) and late autumn (October/November). Lagrangian computation of wind trajectories applied to a large ensemble of precipitation events in the region highlighted the important contribution of Mediterranean cyclones to local precipitation and a strong dispersion within 5-day back-trajectories (Bertò et al., 2004).
Field collection of core, sampling, and core imagery
For the study of Holocene climate and environmental variability, three active stalagmites were removed from the cave: ER76 (length 368 mm) in June 1993, ER77 (length 450 mm) in November 1995 and ER78 (length 60 mm) in October 2000 (Frisia et al., 2003). ER76 was taken toward the end of Sala Grande, whereas ER77 and ER78 were retrieved near the bottom of the cave (Figure 2). The entire stalagmites were extracted at their base by chisel and hammer and transported to the Science Museum in Trento. The stalagmites were then cut along their growth axis and the two halves were successively sliced in 10–12 mm slabs. The stalagmite slabs were then polished and scanned with a flatbed scanner (600 dpi resolution) (Figure 3) and used to obtain thin sections and carry out all geochemical analyses. Most of the stalagmite slices and thin sections are now archived in the geological specimen collection at the Science Museum in Trento. ER76, ER77, and ER78 are unique samples and it is not possible to obtain the same stalagmite material from the cave.
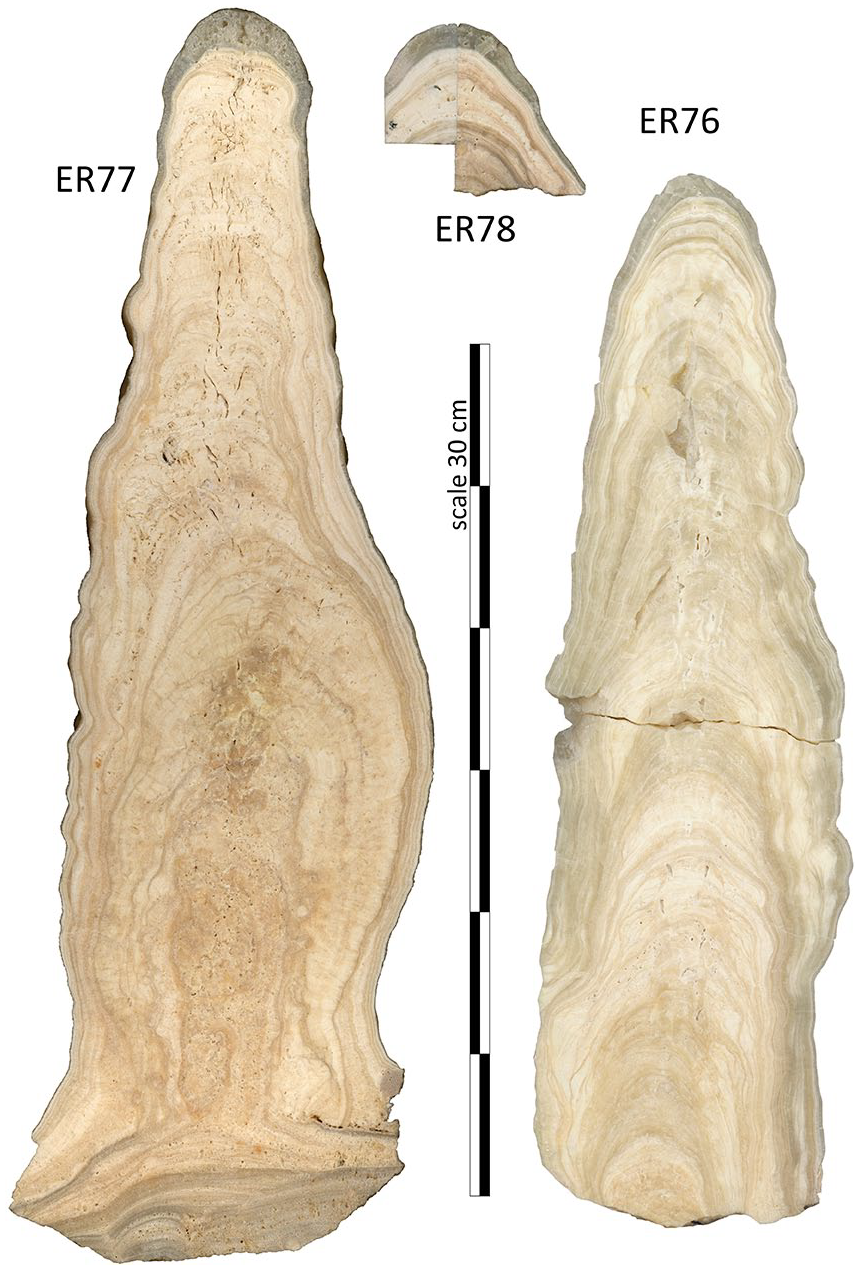
Scanned images of ER76, ER77, and ER78 stalagmites cut along their growth axis. Note the characteristic translucent calcite layer in the topmost part of the three stalagmites (topmost 9–14 mm). Reproduced in colour in online version.
Uncoated 30 µm-thick, polished thin sections were obtained from the top section of stalagmites ER76, ER77, and ER78 and imaged by optical transmitted light with a Zeiss Axioplan microscope, and by fluorescent light stimulated by UV (365 nm) and blue wavelength (470 nm) lasers, with a Zeiss Axio Imager A1 fluorescence microscope.
Chronological controls
ER76 stalagmite was dated by two series of U/Th analyses (McDermott et al., 1999; Scholz et al., 2012). The first batch was analyzed using a Finnigan MAT 262 RPQ-2 mass spectrometer at University College Dublin, Ireland (McDermott et al., 1999) while the second series were analyzed using a Finnigan MAT 262 RPQ thermal ionization mass spectrometer (TIMS) with a double filament technique at the Heidelberg Academy of Sciences, Germany (Scholz et al., 2012). The age model of ER76 was then implemented by annual laminae counting (Frisia et al., 2003; Scholz et al., 2012). The annual layers were counted from the top down as far as the first hiatus at 19.8 mm distance from top (dft) (420 years) and between 42 mm dft and the base of the speleothem (368 mm dft) where no hiatuses were detected. This provided a floating, annually resolved chronology that was then adjusted to the U-series age model. The age for the base of the stalagmite was determined by minimizing the average age difference between the U/Th and the lamina age models. The best agreement was obtained for a basal age of 8.038 ka, which is in good agreement with the U-series age model (i.e. 8.2 ± 0.8 ka). Both age models generally show a good agreement, with the lamina counting age model always within the 95% confidence limits of the U-series age model. This confirmed the annual origin of the lamination (Scholz et al., 2012). The topmost sections of stalagmites ER77 (24 mm) and ER78 (10 mm) were only dated by annual laminae counting, given that the annual origin of the laminae was confirmed by petrographic correlations, statistical and spectral analyses (Frisia et al., 2003; Scholz et al., 2012). The annual origin of the topmost section of stalagmite ER77 was further confirmed by radiocarbon analyses (Fohlmeister et al., 2011).
The layer counting was undertaken using thin section images obtained at the Zeiss Axioplan optical microscope. For stalagmites ER76 and ER78 the layer count was also carried out on fluorescent light images from thin sections stimulated by blue-wavelength (470 nm) lasers, obtained at the Zeiss Axio Imager A1 fluorescence microscope. The layer counting was performed along three separate alignments and by using discrete markers between different sections of the stalagmite (typically every 20–40 layers). The final distances and thicknesses were then calculated as the arithmetic averages of the three counts, and the counting error was evaluated from the discrepancy between the three counts.
Anthropocene proxies
The specimens for synchrotron-radiation-micro-X-ray fluorescence (SR-µXRF) analyses of ER78 stalagmite were prepared by double polishing a 200 µm-thick stalagmite slice cut in the axial portion, from which the thin section used to derive the age model was obtained (Frisia et al., 2003). The SR-µXRF experiments were performed at the ID21 and the ID22 beamlines of the European Synchrotron Radiation Facility. At the ID21 X-ray microscopy beamline, measurement of elements with low atomic numbers was performed (see Frisia et al., 2005 for analytical details). At the ID22 beamline, a 17.3 keV excitation energy allowed detecting the K-lines of all the elements up to Y and the L-lines of Pb, with an average detection limit of 0.06–0.15 ppm (depending on the element and the dwell time, Borsato et al., 2007).
Sulfur isotope analyses of speleothem carbonate were undertaken using polished, gold-coated thin sections 150 μm thick using a Cameca 1270 ion probe at the University of Edinburgh, School of Geosciences. 34S/32S ratios are expressed using the delta convention in per mil notation standardised to VCDT (Wynn et al., 2010).
Samples for stable carbon and oxygen isotope ratios analyses were micromilled at 100 µm intervals in the upper 20 mm dft of ER77 and the upper 0 and 8 mm dft of ER76. The stable carbon and oxygen isotope ratios for the remainder of stalagmite ER76 were micromilled at ~250 µm intervals (Scholz et al., 2012). All measurements were performed using an on-line, automated carbonate preparation system linked to a triple collector gas source isotope ratio mass spectrometer at the University of Innsbruck. Values are reported relative to the VPDB standard. Precision of δ13C and δ18O values, estimated as 1σ standard deviation of replicate analyses, is 0.06 and 0.08 ‰, respectively.
Results
Petrography, microstratigraphy, and chronology
ER76, ER77, and ER 78 consist entirely of low-Mg calcite (Frisia and Borsato, 2010; Frisia et al., 2000). A clear and sudden change from porous, opaque to compact translucent calcite (see fabric description in Frisia et al., 2000, 2003) is evident in their topmost section. The transition occurs at 9.8, 13.1, and 8.8 mm from the top in ER76, ER77, and ER78 respectively, coinciding with the year 1840 ± 12 CE (Frisia et al., 2003).
The upper 150 laminae, which correspond to the interval from 1840 to 1991 CE, are typically ca. 100 µm thick and are stacked regularly to form a columnar fabric. Two bands of extremely reduced lamina thickness (4–20 µm) dominated by dark layers mark the period from ca. 1650 to 1713 and from 1798 to 1840 in ER76 and ER77 (in ER78 laminae are too thin to be resolved prior to 1840). These UV-luminescent, organic- and trace-element-enriched brown layers are clustered together to form “dark bands” as observed with the optical microscope. Such bands typically occur in the 16th–19th centuries in all three stalagmites, and have not been observed in the mid-Holocene parts of ER76 and ER77. This suggests that the slowest growth rates occurred from ca. 1650 to 1840 CE, in the so-called “Little Ice Age.” By contrast, some of the thickest laminae occur in the last 100 years. This change reflects the consequences of surface air temperature increase following the end of the “Little Ice Age” in the Italian Alps at around 1850 CE (Frisia et al., 2003; Smith et al., 2006).
In ER78, 165 ± 25 laminae were counted in the topmost 9 mm, with a mean annual growth rate of 54.6 ± 44 µm. At 2 mm dft, which coincides with the year 1984 CE, there is a sudden increase in growth rate up to 265 ± 19 µm/year. This value stands up as exceptional in the whole series, as it surpasses by 4σ the mean annual growth rate of the uppermost 9 mm (Figure 4). The sudden and short-lived peak in the growth rate concurs with an increase in the Si content marked by a thin, micro-detrital layer. This marks the opening of the cave entrance in autumn 1983 followed by the archeological excavation carried out during summer 1984 (Dalmeri, 1985). The closing of the cave entrance with an iron door at the end of the archeological excavation in autumn 1984 inhibited the natural ventilation of the cave and is reflected by the almost steady growth rate between 1985 and 2000 CE (Figure 4).
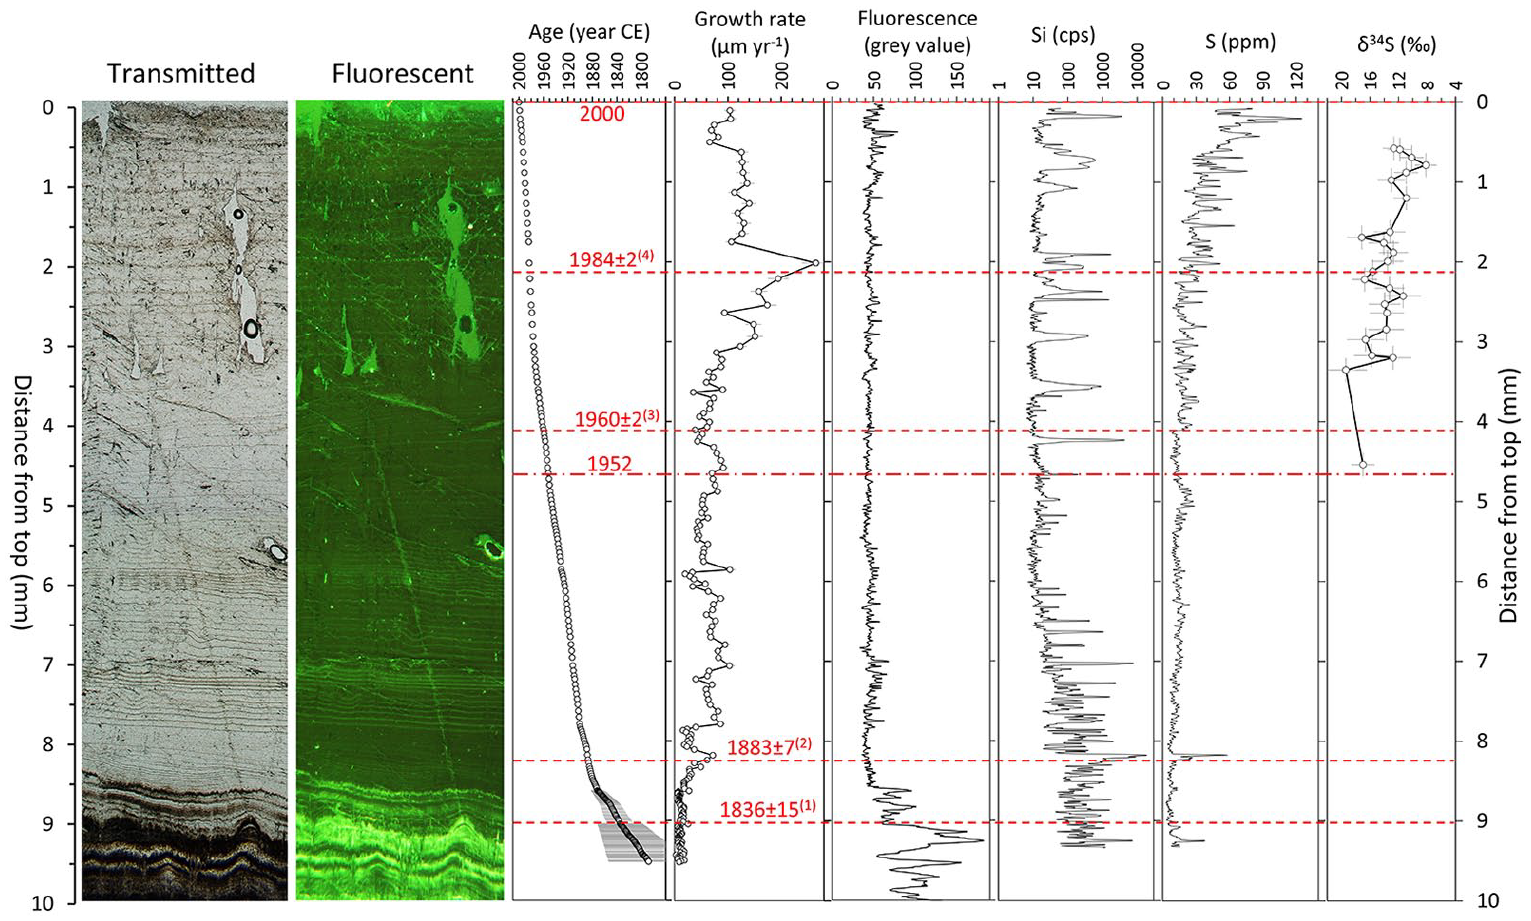
Thin section image in transmitted and fluorescent light (470 nm) of the topmost section of ER78 stalagmite compared with the annual growth rate and age model derived from layer counting (Frisia et al., 2003), the fluorescence signal (this work), the S and Si concentration composition (Borsato et al., 2015b; Frisia et al., 2005), and δ34S-SO4 (Wynn et al., 2010). Four time markers are highlighted: (1) The passage from porous microcrystalline to compact columnar calcite at 8.6 mm dft (lamina age 1836 ± 16 CE); (2) the peak in sulfur concentration at 8.4 mm dft (lamina age 1884 ± 7 CE), possibly related to the Krakatoa volcanic eruption in August 1883 (Frisia et al., 2005, 2008); (3) the increase in the annual growth rate and S concentration (lamina age 1960 ± 3 CE), followed by the shift toward depleted δ34S–SO4 that suggests an additional source of stalagmite sulfur originating from industrial pollution (Wynn et al., 2010); (4) the sudden increase of growth rate and Si content along a thin micro-detrital layer that corresponds to the opening of the cave entrance in autumn 1983 followed by archeological excavations during summer 1984 (Dalmeri, 1985). Note the inverted scale for δ34S and the logarithmic scale for Si (concentration reported in count per seconds). The horizontal dash-dot line on 1952 is the reference to the first global Pu fallout, the preferred boundary for the Anthropocene series (Waters et al., 2018). Reproduced in colour in online version.
Another chronological marker in ER78 is a sharp peak in sulfur concentration at 8.4 mm dft (lamina age 1884 ± 7 CE), which is likely to be related to the Krakatoa volcanic eruption in August 1883 (Frisia et al., 2005, 2008).
In stalagmite ER77 280 ± 20 laminae were counted in the topmost 15.6 mm, with a mean annual growth rate of 55.6 ± 50 µm. The passage between brown-fluorescent, porous microcrystalline to translucent, compact columnar calcite fabrics at 13.1 mm dft (lamina age 1841 ± 10 CE) is marked by a steady increase in the growth rate (Figure 5).
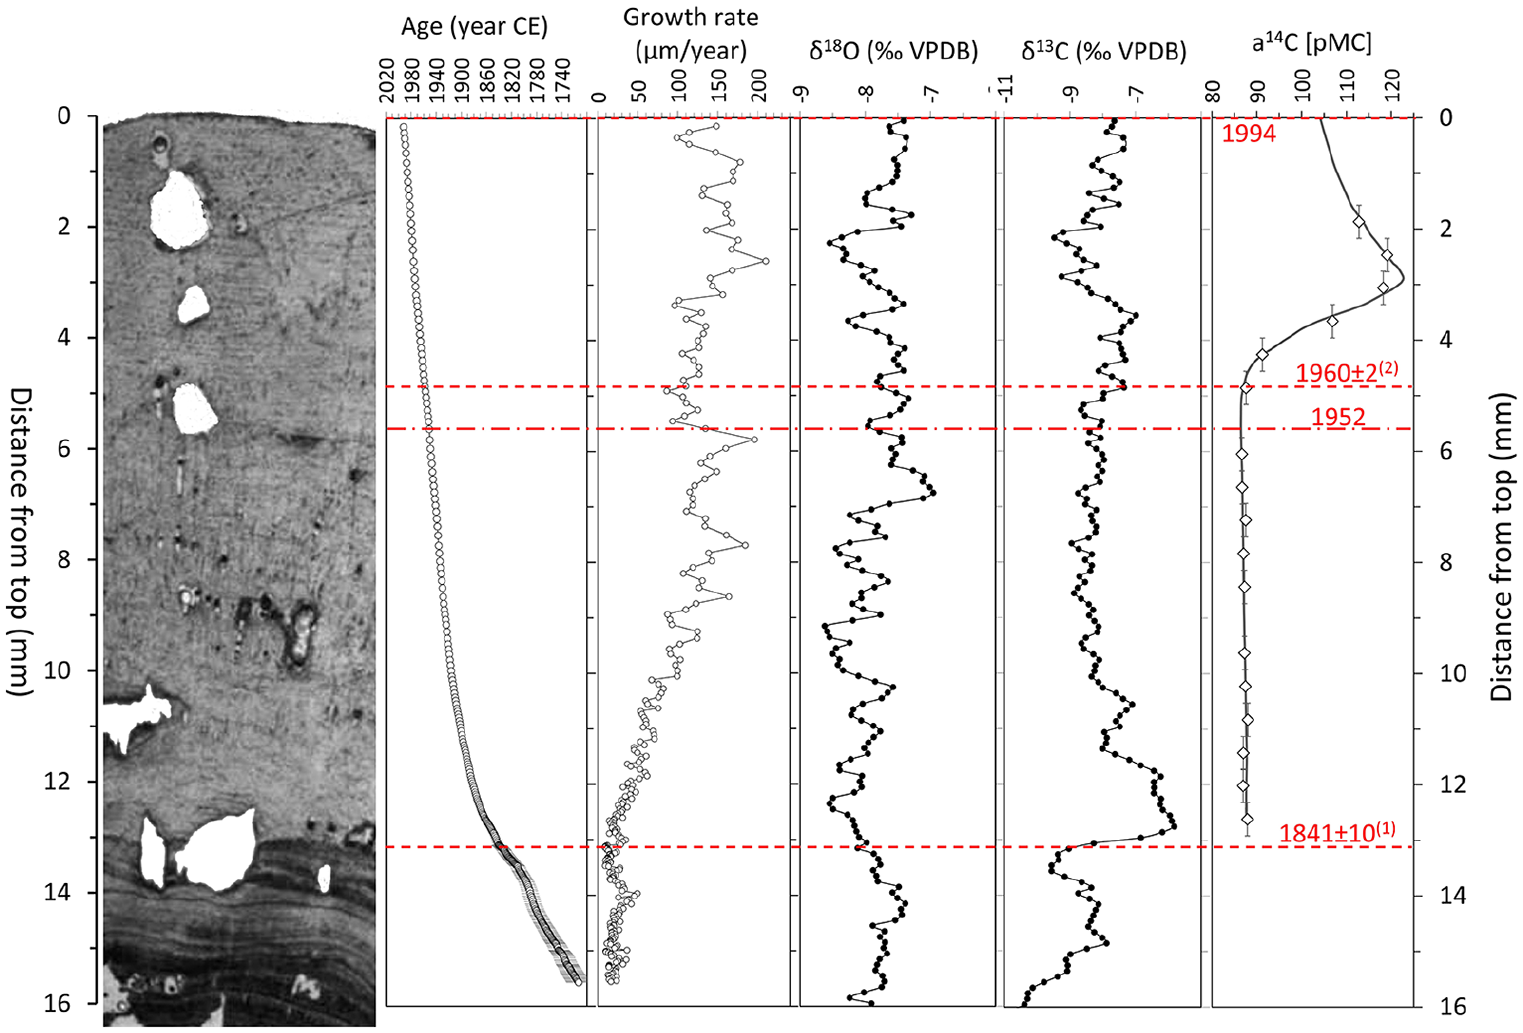
Thin section image in transmitted light of the topmost section of ER77 stalagmite compared with the age model derived from annual layer counting (Frisia et al., 2003), the oxygen and carbon isotope ratios (Scholz et al., 2012), and the 14C activity (Fohlmeister et al., 2011). The gray line in the a14C graph is the modeled 14C activity. Two time-markers are highlighted: (1) The passage from porous microcrystalline to compact columnar calcite at 13.1 mm dft (lamina age 1841 ± 10 CE) marked by a steady increase in the growth rate and a sharp rise in δ13C; (2) the deflection point in the 14C activity curve at 4.8 mm dft (lamina age 1960 CE) which corresponds to the stratigraphic signal proposed as the primary guide for the definition of the Anthropocene series in stalagmite ER77. The horizontal dash-dot line on 1952 is the reference to the first global Pu fallout, the preferred boundary for the Anthropocene series (Waters et al., 2018). Reproduced in colour in online version.
Radioisotopes
Seventeen powder samples from the top 13 mm of stalagmite ER77 were obtained using a dental drill at a spatial resolution of 0.6 mm, resulting in a temporal resolution of 4 years (in the 1970s) up to 10 years (in the 1890s) depending on the growth rate. Due to technical limitations, it was not possible to drill the samples in a CO2-free atmosphere. However, the background used (Iceland spar) did not show a significant enrichment in 14C than other background samples, which were commonly drilled in a CO2-free atmosphere. Therefore, the powdered samples were not affected by recent atmospheric 14CO2 values (Fohlmeister et al., 2011). The calcite powders were acidified under vacuum and the evolved CO2 gas was dried and captured. This CO2 was then combusted under a H2 atmosphere to carbon, which was pressed into cathodes for accelerator mass spectrometry (AMS) analysis at the University of Lund AMS facility (Fohlmeister et al., 2011).
The Grotta di Ernesto ER77 stalagmite radiocarbon values can be precisely compared to atmospheric values because of the accurate age-depth control provided by the annual layer counting. The stalagmite 14C measurements for the early 20th century reflect the atmospheric plateau-like behavior (Figure 6). In addition, the slightly decreasing trend of 14C atmospheric values in this period is well represented by the stalagmite data, although showing small fluctuations. The level of radiocarbon concentration (around 87 pMC) is on average about 13% less than that in the atmosphere and identifies the radiocarbon reservoir effect at the site. The 14C reduction is attributed to dissolved carbon from the host-rock. However, a cave-site specific contribution to the reservoir effect can also originate from the 14C age spectrum of soil organic matter (Markowska et al., 2019; Noronha et al., 2015). The best modeled fit with respect to the soil organic matter age spectrum of the measured data show a peak at 122.7 pMC in 1972.5 CE, with a delay of about 10 years with respect to the atmospheric 14C activity peaking up to 197.3 pMC in 1963.6 CE (Figure 6). Therefore, the shape of the bomb peak in stalagmite ER77 is smoothed relative to the atmosphere and shifted toward younger times, which is likely related to the vegetation above the cave (Fohlmeister et al., 2011; Griffiths et al., 2012). A vegetation contribution to the radiocarbon reservoir effect is supported by the shape of the radiocarbon bomb peak in stalagmite ER77. The atmospheric radiocarbon levels in the mid to late 20th century underwent a rapid increase due to tropospheric nuclear weapon tests, resulting in an almost doubled radiocarbon concentration compared to the pre-bomb period. This was followed by a slower decrease in atmospheric 14C back to almost pre-bomb peak levels.
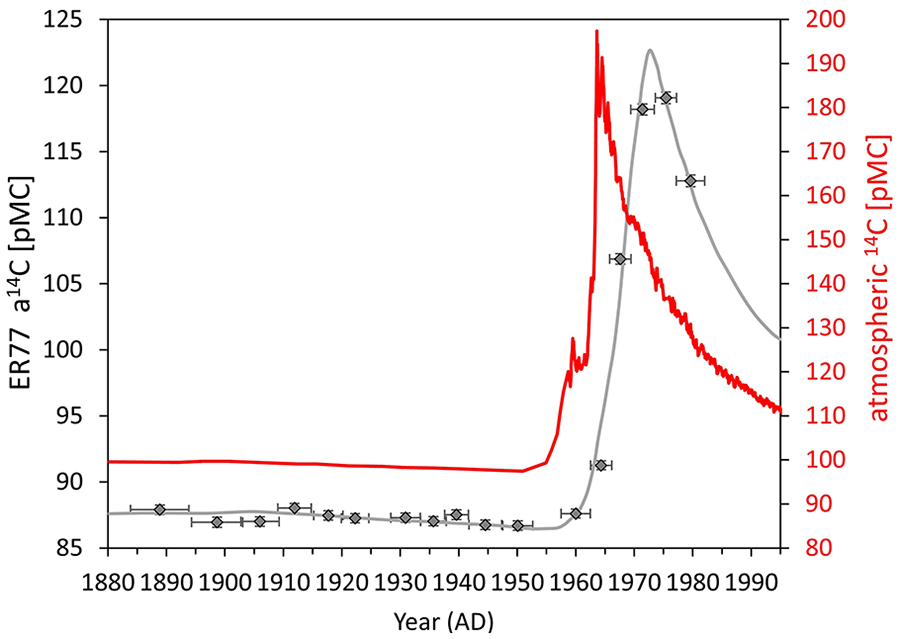
The atmospheric 14C activity compared to ER77 stalagmite data (Fohlmeister et al., 2011). The atmospheric 14C activity (red line) shows a plateau before 1950 CE, followed by the bomb pulse anomaly peaking up to 197.3 pMC in 1963.6 CE. The stalagmite data (black circles) are shown with 1-σ uncertainty in the 14C measurements. The gray line is the best modeled fit with respect to the soil organic matter age spectrum of the measured data peaking at 122.7 pMC in 1972.5 CE. Note the different scales for the stalagmite and atmospheric pMC. The deflection point in the 14C activity curve of stalagmite ER77 in the year 1960 CE corresponds to the stratigraphic signal proposed as the primary guide for the definition of the Anthropocene series. Reproduced in colour in online version.
Respired soil CO2 at any given time contains C of the year (CO2 from root respiration) and of older origin (microbial decomposition of old organic matter). For ER77 this resulted in a shift for the onset of the bomb peak by about 5 years. A 1- to 5-year delay of the deflection point is also often visible in other speleothems (Hua et al., 2017). The extent of the delay has been ascribed to processes related to transfer of the signal (via water) from soil to cave and to the ratio of soil CO2 evolved from root respiration to that evolved from microbially decomposed old organic matter (Markowska et al., 2019). The peak of the bomb-pulse in stalagmite ER77 is shifted by about 10 years compared to the atmosphere. Furthermore, the peak 14C values in the speleothem are about one-fifth compared to the overall atmospheric radiocarbon increase. This can be explained by a smoothing action of the vegetation above the cave. Radiocarbon analysis of monthly collected drip water samples, performed in 2006 and 2007 CE, reveal mean values of ca. 101 pMC (Fohlmeister et al., 2011), which agree with the observed decline in the cave site-specific radiocarbon levels derived from the stalagmite measurements.
Geochemical and organic matter proxies
The comparison of the δ18O records in ER76 and ER77 revealed that the δ18O signal in Grotta di Ernesto stalagmites is influenced by several and partly competing factors (Scholz et al., 2012) that render its interpretation challenging. The influence of the amount effect to the δ18O signal, as proposed in the first study (McDermott et al., 1999), was not confirmed by the δ18O signal of the rainfall (Scholz et al., 2012), although reanalysis on the summer δ18O signal in the region shows a positive, statistically significant linear correlation between rainfall δ18O and rainfall amount (Johnston et al., 2021). The interpretation is further complicated by the fact that most of the summer precipitation, as well as a significant amount of snowfall in winter, does not contribute to the drip water balance of the stalagmites.
As a result, the δ18O records in ER76 and ER77 do not show any particular trend, or clear feature, in the last 200 years (Scholz et al., 2012, Figure 5). On the other hand, spectral analysis of the stalagmite δ18O signal revealed significant peaks at 110, 60–70, 40–50, 32–37, and around 25 years. With the exception of the 32–37 years cycle, all periodicities correspond to peaks in power spectra of NAO (25 years cycle) and solar variability (Scholz et al., 2012). This corroborates the spectral analysis of the lamina thickness of ER76, ER77, and ER78 stalagmites, which revealed high spectral density at 3 and 7–8 years (winter time NAO index) and 11 years (solar magnetic field cycles) (Frisia et al., 2003).
Monitoring data show that soil pCO2, soil gas and water δ13C values reflect temperature changes through the temperature sensitivity of vegetation cover, root respiration and bacterial decomposition of soil organic matter, with more negative δ13C values corresponding to denser vegetation cover and warmer surface temperatures (Borsato et al., 2015a). However, drip water δ13C values are also modified by dissolution of the host rock and rapid in-cave degassing of CO2 as a response to cave ventilation (Frisia et al., 2011; Johnston et al., 2013). Grotta di Ernesto stalagmite δ13C values, thus, reflect both vegetation and cave ventilation signals (Frisia et al., 2011; Scholz et al., 2012).
In stalagmite ER76, the millennial-scale decrease in δ13C from 8.0 to 2.5 ka was interpreted as a progressive evolution in soil development and vegetation cover, in response to regional-scale warming (Scholz et al., 2012). On the other hand, the sharp shift from −10‰ to −6‰ at around 1841 CE in both ER76 and ER77, marked by a steady increase in the growth rate and a sudden shift from porous microcrystalline to compact columnar calcite (Figure 5), is related to the disturbance of the vegetation cover and enhanced cave ventilation. This event, marking the end of the Little Ice Age in this region of the Alps (Frisia et al., 2003), is likely a response to deforestation and associated disturbance in both soil and scree that obstructed the cave entrance. Deforestation above the cave caused the rapid degradation of the organic matter in the soil zone, whereas the disturbance in the scree enhanced cave ventilation and caused an increase in dripwater CO2 degassing (Frisia et al., 2011).
Therefore, the growth rate increase following the regional warming starting at around 1840 CE was further amplified by the human activity at the cave site. The disturbance of both vegetation and soil above the cave continued throughout the 19th century and, therefore, the stalagmite δ13C signal likely reflects human activity and not specific climate events (Scholz et al., 2012).
Sulfur and sulfur isotopes
Sulfur concentration was first measured by S-µXRF analyses on ER78 stalagmite (Frisia et al., 2005, 2008) at the ESRF ID22 beamline in Grenoble. A 17.3 keV excitation energy made possible the detection of the K-lines of all the elements up to Y and of the L-lines of Pb, with an average detection limit of 0.06–0.15 ppm depending on the element and the dwell time (Borsato et al., 2007). Sulfur speciation as determined by XANES spectra (X-ray Absorption Near Edge Fine Structure), was dominated by sulfate species. S-µXRF relative concentration data were calibrated using absolute concentrations obtained from High Resolution Inductively Coupled Plasma Mass Spectrometry (HR-ICPMS) (Borsato et al., 2015b).
The sulfur concentration analyses revealed an increasing trend through time, which peaked in approximately 1997 (Frisia et al., 2005) and followed the trend in calculated sulfur emissions to the atmosphere associated with the anthropogenic combustion of fossil fuels (European Environmental Agency, 2014; Mylona, 1996, 1997; Vestreng et al., 2007). The rising trend of sulfur concentrations from 1850 to the year 2000 (time of stalagmite removal from the cave) were then analyzed by Secondary Ionisation Mass Spectrometry (SIMS) at the NERC ion probe facility of the University of Edinburgh, to identify the environmental source of sulfur.
Sulfur isotope data from 1850 to 1967 are omitted, due to low concentrations of sulfur (typically <20 ppm) causing poor precision of isotopic analysis (Wynn et al., 2010). Data from 1967 to 1995, demonstrate a secular shift in isotopic composition (Figure 7), with the isotopic signatures becoming depleted in 34S toward the point of peak atmospheric emissions. Given that precipitation in the northern hemisphere sourced predominantly from anthropogenic emissions of SO2 typically have a δ34S–SO4 composition between −3 and +9‰ (Mayer, 1998), this shift was interpreted as representing increased atmospheric sulfur pollution relative to a background signal composed of sulfur sourced mainly from bedrock dissolution (δ34S–SO4 bedrock signal ~20.5 ‰: Wynn et al., 2010).
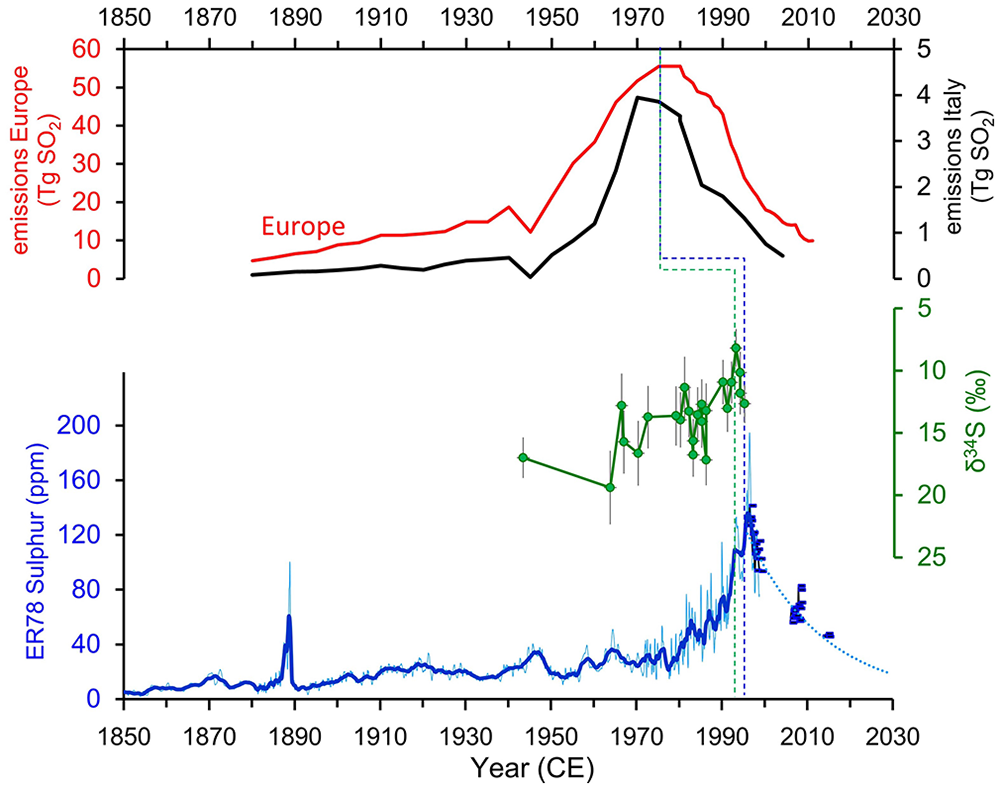
Sulfur and sulfur isotope records for ER78 stalagmite (Borsato et al., 2015b; Frisia et al., 2005; Wynn et al., 2010) compared with the sulfur dioxide emissions in Europe and Italy (European Environmental Agency, 2014; Mylona, 1996, 1997; Vestreng et al., 2007). The sulfur actual data are shown by a blue thin line, whereas the bold line represents the 2-year Gaussian filter. The squared dots are the stalagmite series reconstructed by the measured dripwater S/Ca ratio for ER78 stalactite, and the dotted line the projected trend until 2030 (Borsato et al., 2015b). The green and blue dashed lines identify a delay of about 20 years between the peak in the sulfur dioxide emissions and the corresponding points in ER78 sulfur series due to biogeochemical cycling in the soil and vegetation above the cave (Borsato et al., 2015b; Wynn et al., 2013). The black star at 1889 ± 6 CE marks the S peak, likely correlated to the Krakatoa 1883 CE eruption (Frisia et al., 2008). Note the inverted scale for δ34S. Reproduced in colour in online version.
Peak sulfur concentrations and isotopic signatures reflect the timing of peak sulfur emissions into the atmosphere prior to the introduction of environmental control measures, albeit displaying a time lag of approximately 20 years. This delay has been attributed to the uptake and biogeochemical cycling of sulfur through the vegetation, followed by transit through the karst. In this respect, it is interesting to note that the sharp S peak in 1889 ± 6 CE, which was attributed to the 1883 CE Krakatoa volcanic event (Frisia et al., 2008), is delayed by only 6 ± 6 years. This was interpreted as due to limited biogeochemical cycling related to cooling and less dense vegetation in the 19th century that favored a faster transmission of the sulfur signal, with a delay similar to that of the mean residence time of the water within the aquifer (4–5 years) (Borsato et al., 2015b).
The equivalent excursion in sulfur isotopic signatures can be seen within tree ring archives analyzed from the vicinity of the cave (Wynn et al., 2014a). The isotopic fractionation associated with biogeochemical cycling is minimal under the oxidizing conditions typical of karst environments, and has little impact on the sulfur isotopic composition within the drip waters and speleothem archive in the cave below (Wynn et al., 2013). The onset of a return trajectory toward background sulfur signals relatively enriched in 34S was not observed in ER78, due to the spatial resolution of analysis and the time of stalagmite collection, although it was recorded in the dripwater feeding the stalagmite a few years after stalagmite collection (Borsato et al., 2015b, Figure 7). By contrast, the return trajectory was observed in a speleothem from a nearby cave in the Austrian Alps, covering a slightly extended time-period of deposition (Wynn et al., 2010).
It appears that stalagmite ER78 identifies a true record of atmospheric sulfur emissions from anthropogenic combustion of fossil fuels. This can be reconstructed with a high degree of confidence imparted through the use of sulfur isotopes, albeit with a time delay of approximately 20 years between the point of emission to the atmosphere and appearance in the speleothem paleorecord.
So far only one other high-resolution S stalagmite record has been published from Obir cave in Austria (Wynn et al., 2014b). In this case, the delay is limited to approximately 10 years as the stalagmite peak occurs in the mid-1980s.
Discussion
Grotta di Ernesto is an excellent site for paleoclimate and paleoenvironmental studies being one of the most extensively monitored cave sites worldwide. Studies on the soil dynamics and transport of trace elements and organics through the aquifer facilitate the interpretation of the climate and environmental signals encoded in the stalagmites. The ubiquitous presence of visible annual laminae in the three studied samples implement the dating of the last few 100 years and makes the stalagmites the ideal material for precisely dated high-resolution studies.
A slow annual growth rate (around 100 µm/year) and limited number of active stalagmites hindered the execution of additional analyses for which a large amount of material is required. The major problem in the evaluation of the anthropogenic signals encoded in the ER76, ER77, and ER78 stalagmites, however, is related to the modulation and smoothing action of the thick soil, the dynamic of cave ventilation and the vegetation cover, which has been strongly impacted by human activity in recent times. This is mostly evident in the trace-elements and in the δ13C records. Trace metals linked to colloidal transport from the soil (Cu, Zn, Pb, Y) increased at the beginning of the 20th century as a result of deforestation (Borsato et al., 2007), whereas the δ13C time series was strongly impacted by both deforestation and enhanced cave ventilation that took place around 1840 CE and shifted the δ13C toward less negative values (Scholz et al., 2012). These processes completely masked the atmospheric Suess effect, the reduction of atmospheric δ13C values by ~2‰ that has occurred since the start of the Industrial Revolution ~1820 CE. Such behavior is common in many recent speleothem records (Hua et al., 2017; Markowska et al., 2019) because stalagmite δ13C values are dominated by the soil signal, given that soil CO2 concentration is typically more than one order of magnitude higher with respect to the atmospheric values (Borsato et al., 2015b). The Suess effect, however, is noticeable in the radiocarbon pre-bomb period data. There is a slight, but robust decrease, mimicking the atmospheric one (Figure 6). This is plausible, as 14C does not depend on soil dynamics and changes in cave ventilation as much as the δ13C record (Frisia et al., 2011).
The modeled peak of the bomb-pulse in stalagmite ER77 occurred in 1972.5 CE, delayed by about 9 years compared to the atmosphere. The bomb pulse radiocarbon in the speleothem increases by about 30 pMC compared to pre-bomb times and, thus, is about one-third compared to the overall atmospheric radiocarbon increase. The delay and reduction in the peak 14C values are likely related to soil and vegetation above the cave and to the homogenizing effect of the porous aquifer (Fohlmeister et al., 2011; Griffiths et al., 2012). The comparison with other stalagmite records worldwide clarifies the role of soil and aquifer in smoothing the atmospheric bomb-pulse 14C signal. Two recent papers employed a new unsaturated zone C model which considers C decomposition as a continuum, to better understand 14C dynamics (Faraji et al., 2023; Markowska et al., 2019). In particular, the study from two Cook Islands stalagmites from the South Pacific characterized by patchy soil cover and limited rock overburden that allowed a fast transmission of the atmospheric signal shows the highest peak pMC value (134.4) and the earliest inflection points (1956 and 1957 CE) documented worldwide in speleothems (Faraji et al., 2023). Remarkably, Pu17 stalagmite shows a sharp and early bomb peak in 1966, with a delay of just 2.5 years with respect to the atmospheric signal. On the other hand, stalagmites characterized by thick soil cover display much damped bomb 14C rising and much lower peak pMC values (Faraji et al., 2023; Markowska et al., 2019). Overall, the 14C record in ER77 is one of the most prominent and little-delayed records compared to over 20 stalagmite records published worldwide.
Whilst the stalagmite record represents an accurate reconstruction of environmental sulfur loading to the atmosphere, which can be traced to source using sulfur isotopes, the timing of the signal is modified by biogeochemical cycling and storage/mixing within the epikarst. The extent of signal modification is largely dependent on karst hydrology and antecedent soil dynamics. A karst system dominated by rapid fracture flow through soil and epikarst allows any modification by biogeochemical cycling to be bypassed. Likewise, if the ecosystem above the cave is replete in sulfur content, addition of sulfur in excess of that which can be taken up by the biomass will enter unmodified into the karst system beneath. However, in most environmental situations, biogeochemical cycling of sulfur in the soil-vegetation system above the cave will be extensive, leading to storage dynamics controlled by biomass recycling. In most instances, the redox conditions in the soil overlying karst bedrock will be predominantly oxidizing and the associated biogeochemical processes of assimilation (uptake of sulfur compounds into vegetation and soil biomass) and mineralization (the return of carbon bonded sulfur compounds into the soil zone as sulfate) comprise only minimal net fractionation to the sulfur isotopes. Within the karst, storage and mixing with sulfate pools can further delay and modify the source sulfur signature. For stalagmite ER78, the archived sulfur signal originated predominantly from a pathway of biogeochemical cycling and storage/mixing in the karst. Isotopic integrity of the sulfur signal is retained, allowing tracing of sulfur signals to source, even though the timing of key events may be offset (Wynn et al., 2013).
When compared, the ER77 and ER78 stalagmite records show a similar behavior (Figure 8), highlighted by two major events. (1) Year 1840 CE marked by the passage between microcrystalline impurity-rich to compact columnar laminae. This corresponds to the steady increase in the growth rate, the sudden decrease in fluorescence in ER78 and the sharp increase in δ13C values in ER77 which mark the end of the Little Ice Age in this part of the Alps. It is important to note that the increase in the growth rate as well as the sharp increase in δ13C values at around 1840 CE were also documented in ER76 stalagmite (Frisia et al., 2003; Scholz et al., 2012). (2) Year 1960 CE which corresponds to the proposed position of the GSSP in ER77 based on the deflection point in the 14C activity curve, whereas in ER78 corresponds to the increase in the annual growth rate and S concentration, and the following shift toward depleted δ34S–SO4 suggesting an additional source of sulfur originating from industrial pollution.
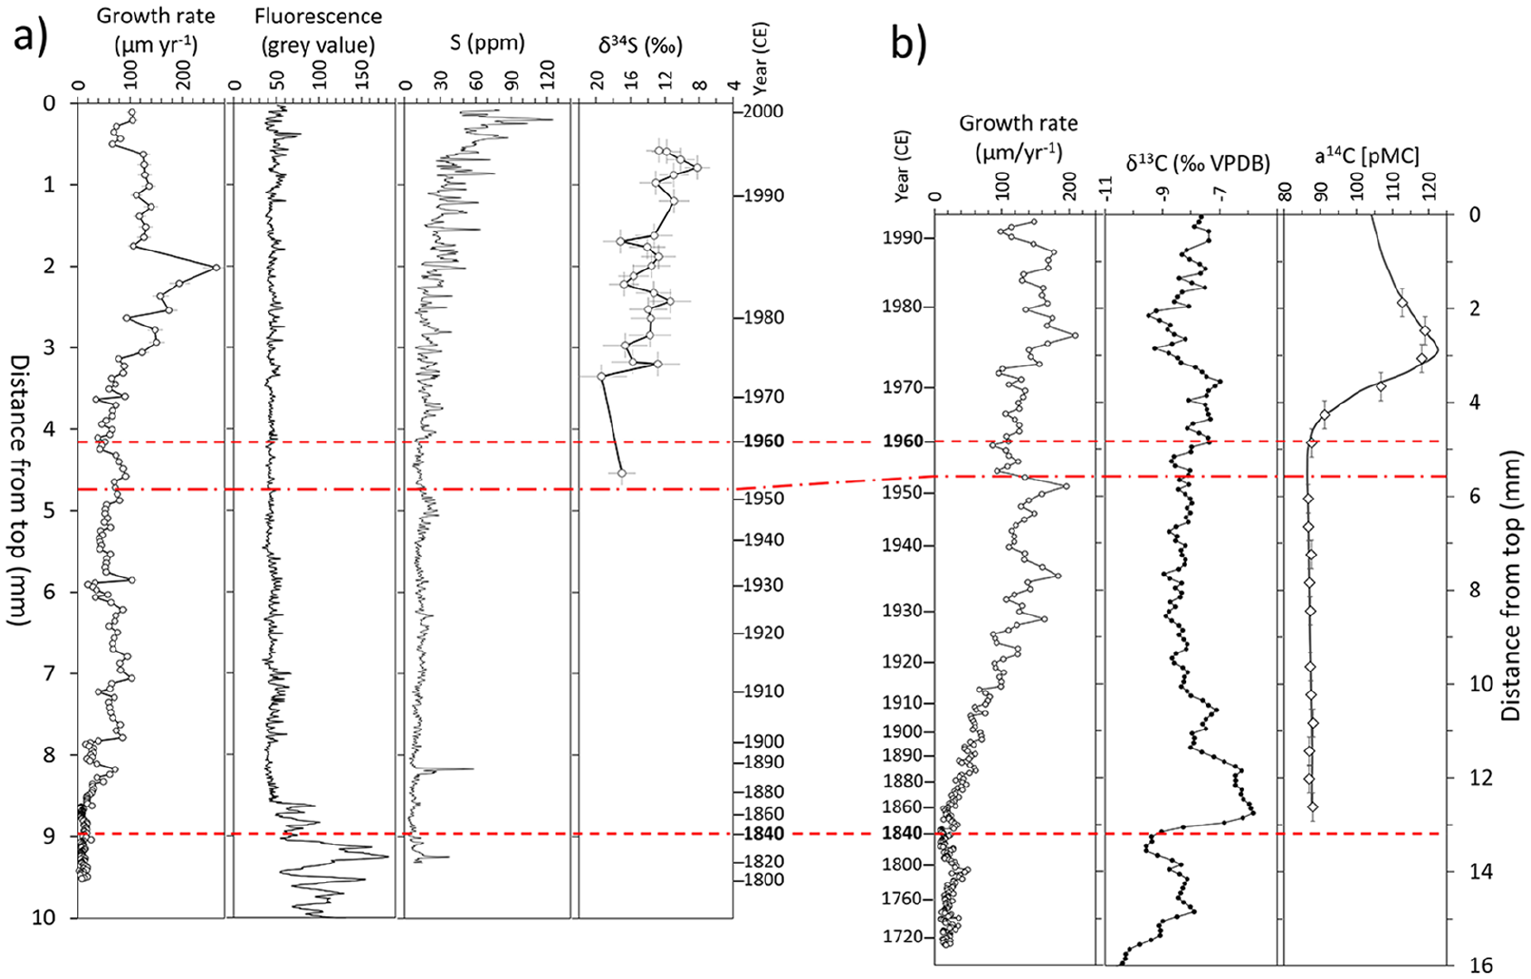
Summary of the Anthropogenic proxies in ER78 (a) and ER77 (b). In order to compare the two stalagmites, the series have been aligned using the years 1840 and 1960, reported in bold in the age column and highlighted by dashed horizontal red lines (note that in this way the ER77 series had to be “compressed” along the dft vertical axis in order to accommodate its faster growth rate with respect to ER78). Year 1840 CE corresponds to steady increase in the growth rate, the sudden decrease in fluorescence value in ER78 (change from microcrystalline impurity-rich to clear columnar laminae) and the sharp increase in δ13C values in ER77 which marks the end of the Little Ice Age in the region. Year 1960 CE corresponds to the proposed position of the GSSP in ER77 based on the deflection point in the 14C activity curve, whereas in ER78 corresponds to the increase in the annual growth rate and S concentration, and the following shift toward depleted δ34S–SO4 that suggests an additional source of sulfur originating from industrial pollution. The horizontal dash-dot line on 1952 refers to the first global Pu fallout, the preferred boundary for the Anthropocene series (Waters et al., 2018). Reproduced in colour in online version.
Ernesto Cave as a reference section for the Anthropocene series
In summary, Ernesto Cave is so far one of the best cave sites documenting the Anthropocene, and is one of only two stalagmites where the S peak was measured at high resolution. Several anthropogenic indicators are clearly recorded in the three coeval stalagmites:
(i) the growth rate increase as a consequence of the global temperature rise starting at around 1840 CE.
(ii) the clear rise and peak in sulfur starting at around 1850 CE and peaking at 1997 CE.
(iii) the enrichment in δ34S starting at around 1960 CE and peaking at 1993 CE.
(iv) the radiocarbon bomb-peak starting at around 1960 CE and peaking at 1972.5 CE.
In particular, the inflection point of the radiocarbon bomb-peak at 4.8 mm dft in ER77 corresponding to year 1960 CE is the proposed reference stratigraphic signal serving as the primary guide to the Anthropocene series.
An advantage of Ernesto Cave with respect to sedimentary sequences is that stalagmites are hard geological samples unaffected by possible diagenetic effects, and can be easily stored and displayed in museum collections and exhibits. Other actively growing stalagmites are present in the cave and they are potentially available for additional analyses and to cover the interval from year 2000 when the last of the three stalagmite (ER78) was collected. In fact, given the hydrological differences of stalagmites within the cave (Miorandi et al., 2010) it is likely that some of the Anthropogenic signals, in particular S concentration and 14C can be replicated with lower attenuation and time lags.
On the other hand, several interferences and complications in the transmission of the atmospheric signal render the interpretation of the Anthropogenic proxies more difficult and argue against this site being the primary GSSP location. The concentration in heavy metals is linked to colloidal transport from soil, and their increase tends to reflect soil disturbance and/or deforestation events, masking the possible contribution of heavy metals (Pb) from atmospheric sources. At the same time, other atmospheric signals (S, δ34S, 14C) have a tendency for attenuation and time lags, while some key Anthropogenic signals (δ15N, 239Pu) (Waters et al., 2018) are absent or poorly presented.
Footnotes
Acknowledgements
This review paper has been facilitated by the Anthropocene Working Group (AWG) to ratify the stratigraphic Anthropocene. The AWG is co-ordinating the assessment of candidate GSSP sites in collaboration with the Haus der Kulturen der Welt (HKW, Berlin) in the framework of its long-term project Anthropocene Curriculum. The Anthropocene Curriculum is an international project for experimental forms of Anthropocene research and education developed by HKW and the Max Planck Institute for the History of Science (MPIWG, Berlin) since 2013. Long-term soil and cave monitoring were performed by Renza Miorandi with logistical assistance from Michele Zandonati (Science Museum of Trento) Additional sulfur dripwater analyses were performed by Dr. Flavio Corradini (Hydrochemistry Laboratory of Istituto Agrario di San Michele all’Adige, Trento). R. Hinton and J. Craven facilitated work at the ion microprobe facility at Edinburgh University and K. Linge (Kingston University) provided essential ICP-MS support. The synchrotron XRF analyses were performed at the European Synchrotron Radiation Facility (Experiment grant CH-1458) and facilitated by Jean Susini and Andrea Somogyi. The accelerator mass spectrometry (AMS) analyses were performed by Göran Skog at the AMS laboratory of Lund University. The high-resolution stable isotope analyses on ER77 were performed by Christoph Spötl at the University of Innsbruck (Austria) and the U/Th analyses on ER76 and ER77 were performed by Denis Scholz at the Heidelberg Academy of Sciences (Germany). The Cultural Heritage Service of the Autonomous Province of Trento granted access to the cave, while the stalagmite sampling has been authorized by the Geological Survey of the Autonomous Province of Trento. Gino Gasperini, the custodian of Grotta di Ernesto, is thanked for his kind co-operation.
Declaration of conflicting interests
The authors declared no potential conflicts of interest with respect to the research, authorship, and/or publication of this article.
Funding
The author(s) disclosed receipt of the following financial support for the research, authorship, and/or publication of this article: This work was supported by the Haus der Kulturen der Welt, Berlin. Long-term soil and cave monitoring, the 14C work and the ion microprobe analyses were supported by the University and Scientific Research Service of the Autonomous Province of Trento (Project AQUAPAST), the UK Natural Environment Research Council (NERC grant NE/C511805/1), and the Deutsche Forschungs-gemeinschaft (DFG) Research Group 668 DAPHNE.