
Abstract
The subalpine, atmospherically fed Śnieżka peatland, located in the Polish part of the Sudetes, is one of the nominated candidates for the GSSP of the Anthropocene. Data from two profiles, Sn1 (2012) and Sn0 (2020), from this site are critical for distinguishing the proposed epoch, while an additional core Sn2 is presented to support main evidence. The Sn0 archive contains a wide array of critical markers such as plutonium (Pu), radiocarbon (F14C), fly ash particles, Hg and stable C and N isotopes which are consistent with the previously well documented 210Pb/14C dated Sn1 profile, which provides a high-resolution and comprehensive database of trace elements and rare earth elements (REE), Pb isotopes, Pu, Cs, pollen and testate amoebae. The 1952 worldwide appearance of Pu, owing to its global synchronicity and repeatability between the cores, is proposed here as a primary marker of the Anthropocene, supported by the prominent upturn of selected chemostratigraphic and biostratigraphic indicators as well as the appearance of technofossils and artificial radionuclides.
Keywords
Introduction
Peatlands cover around 2%–3% of the Earth continental surface (Xu et al., 2018) and, owing to sequestration/release of CO2, play a crucial role in the regulation of global climate (Gallego-Sala et al., 2018; Loisel et al., 2014; Yu, 2012). At the same time, peatlands are excellent repositories of past and recent environmental changes (De Vleeschouwer et al., 2010a; Shotyk, 1988). The stability of peatlands and their ability to accumulate carbon (C) is affected by climate, in particular air temperature and precipitation, atmospheric pollution, fire, sea level, permafrost thawing and land use (Loisel et al., 2021). Even though these factors operate on different temporal and spatial scales, the peatlands vulnerability to environmental change varies geographically (Turetsky et al., 2014). Millar et al. (2017) claimed that subalpine mires were more stable C reservoirs compared to lowland peatlands, and consequently, they provide highly reliable records of environmental changes (Rangwala and Miller, 2012), as confirmed by many studies (e.g. Bao et al., 2015; Fiałkiewicz-Kozieł et al., 2022; Hansson et al., 2017).
The Sudetes are a central European mountain range located between Poland and the Czech Republic, within the so-called Black Triangle, one of the most polluted areas of Europe (Figure 1). The subalpine Śnieżka peatland within the highest Karkonosze mountain range of the Sudetes provides an excellent opportunity to gain an insight into the long-ranged dispersal of transboundary traces of human activity and thus to investigate the negative human impact on the environment within the recent past.
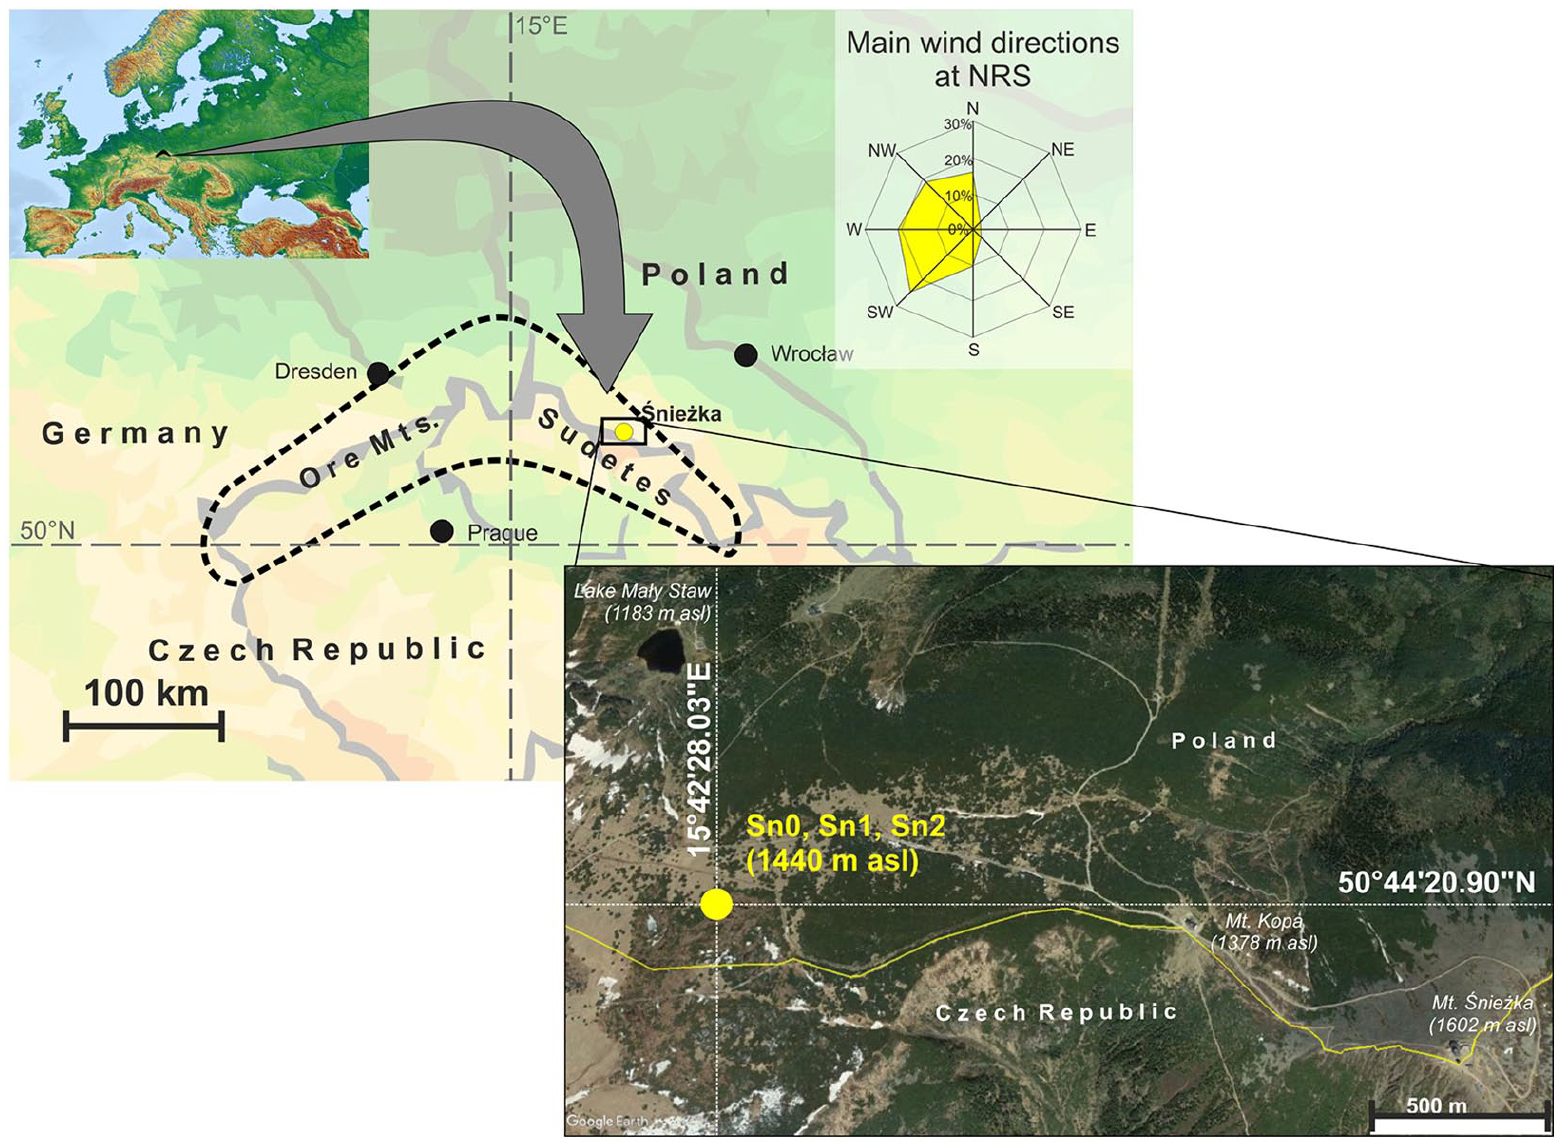
Map of the study site. The wind rose after Sobik et al. (2014). Reproduced in colour in online version.
Evidence of human activity in the Sudetes extends back to Palaeolithic settlements and later Neolithic agriculture (Valde-Novak, 1999). From the third century BCE, there is evidence of the exploitation of river-deposited gold by Celts (Woźniak, 1970). The intense mining of rich metal ores (gold and precious minerals) in the region commenced in the 12th century (Julkowska, 2016). By the 20th century, numerous mines, factories and power plants made the region one of the most polluted in Europe (Grübler, 2002; Kolář et al., 2015). In the 1970s, the synergistic impact of extremely high levels of acid rain, alkali ashes and insect outbreaks caused significant damage to coniferous forests in this area and directly affected human health (Mazurski, 1986). The signing of a joint declaration on cooperation in solving environmental problems in the Black Triangle by the German, former Czechoslovakian and Polish governments in 1991 prompted the improvement and protection of the area (Grübler, 2002; Kolář et al., 2015).
The unprecedented pollution level in the Sudetes region created a need for scientific assessment of the quality of the environment. The most severely affected Izery Mts range (Glina and Bogacz, 2012; Magiera et al., 2019; Zuna et al., 2011) received major attention. Since the time the problem was identified, many reports on acid rain (Mazurski, 1986), dust mineralogy, pollen analysis, sulphur and carbon isotopes (i.e. Kajukało et al., 2016; Popowski, 2005; Skrzypek et al., 2009; Speranza et al., 2000), magnetic susceptibility and geochemistry (i.e. Bińczycki et al., 2020; Fiałkiewicz-Kozieł et al., 2015; Strzyszcz and Magiera, 2001), ecology and anthropopressure (Pech et al., 2022; Wojtuń et al., 2018) have been published.
However, the Śnieżka peatland (Sn) has the most comprehensive, high-resolution geochemical and palaeoecological record in the Sudetes. Concentrations of Pb, Zn, Cu, Ni, Cr, Ti, Al, U, Sc, rare earth elements (REE), mineralogy and 204Pb, 206Pb, 207Pb, 208Pb, 234U, 137Cs, 239+240Pu have been determined (Fiałkiewicz-Kozieł et al., 2020). This study revealed the presence of both regional and global trends in the stratigraphic record, such as the combustion of fossil fuels, the catastrophic release of artificial radionuclides during the Chernobyl accident, and atmospheric nuclear weapon tests. The quality of the record was the basis for nominating the Śnieżka Peatland as a GSSP candidate for the Anthropocene series (AWG, 2020; Luciano, 2022).
The preparatory activities of the Anthropocene Working Group, including events leading to the submission of GSSP proposals and the binding decision that the base of the Anthropocene should align with stratigraphic signals dating to the mid-20th century, are detailed in the introductory article to this special issue (Waters et al., 2023).
This paper aims to review the geochemical and palaeoecological data from the Śnieżka candidate site. The data presented involves three cores (Sn0, Sn1 and Sn2). Special focus is placed on the Sn0 core (2020), which provides the most representative continuous record containing the possible GSSP. This is supported by additional detailed data from Sn1 (2012), and the summary is based on both profiles. Data from Sn2 (2012) are also presented to support these results.
Materials and methods
Geographic setting
The study site is located in the Polish part of the Sudetes mountains. The Śnieżka peatland (50°44′N, 15°42′E) is developed on a plateau (1440 m a.s.l.) in the Karkonosze range, close to the highest summit of Mt. Śnieżka (1602 m a.s.l.; Figure 1).
The mountain range is a significant orographic barrier for regional-continental air masses, and the dominated winds are westerlies (Sobik et al., 2014). For 64% of the year, the area is directly influenced by the zonal circulation of oceanic air masses from the North Atlantic, flowing over the lowlands of Western Europe. About 30% of the year is characterised by polar continental air masses flowing from the east, 4% by arctic air from the north and 2% by tropical air masses from the south (Sobik et al., 2014). The mean annual air temperature at Mt. Śnieżka, based on 1881–2012 measurements, is +0.5°C. The lowest annual mean temperature of −1.2°C was observed in 1941, and the highest value of +2.3°C was registered in 2000, 2006 and 2011 (Urban and Tomczyński, 2017). The annual precipitation is ∼1500 mm (Migała et al., 2016; Sobik et al., 2014). The present plant community of the peatland consists of Sphagnum lindbergii, Sphagnum balticum, Carex limosa, Carex rostrata, Baeothryon caespitosum, Eriophorum vaginatum, Empetrum hermaphroditum, Andromeda polifolia, Oxycoccus palustris and Rubus chamaemorus as well as dwarf Pinus mugo (Wojtuń, 2006).
Sampling
Cores Sn1 and Sn2 (63 and 67 cm in length, respectively) were retrieved in the spring of 2012, and 50 cm long GSSP core – Sn0 was collected in the summer of 2020 using a stainless-steel 10 × 10 × 100 cm Wardenaar corer (Wardenaar, 1987). The distance between all three cores is approximately 15 m (Sn0: 50°44′20,90″N, 15°42′28,03″E; Sn1: 50°44′21,40″N, 15°42′28,23″E, Sn2: 50°44′20,67″N, 15°42′29,44″E). The monoliths were sealed in plastic bags, transported to the laboratory in Poznań (Adam Mickiewicz University – AMU) and stored in the laboratory fridge. Cores were cut into 1-cm thick slices (except the top 6 cm of Sn1 and Sn2, which were cut in 2-cm slices) using a carbon steel knife.
While Sn1 and Sn2 preparation followed the procedure described in Givelet et al. (2004) and De Vleeschouwer et al. (2010b), Sn0 was only partially subsampled, and a complete 5 cm × 5 cm × 50 cm core is retained as an archive in a cold room (4°C).
Methods
A concise summary of the applied methods is provided below. A detailed description of all methods can be found in Supplemental Material 1 and Fiałkiewicz et al. (2020) for Sn1 and Sn2. Physical properties and macrofossils were determined in every slice using standard methods (De Vleeschouwer et al., 2010b; Givelet et al., 2004). Activities of 210Pb and 137Cs were determined for each sub-sample of Sn0 by gamma-ray spectrometry using a high purity germanium detector (DSG, Germany) located at the Institute of Physics, Jagiellonian University. Measurements of 238, 239+240Pu activities were undertaken using an alpha-particle spectrometer (Alpa Analyst, Canberra) with semiconductor, passivated planar silicon detectors (PIPS, Canberra). Fourteen samples of macrofossils from core Sn0 were analysed at the AMS facility in ETH Zurich. After the Acid-Base-Acid treatment (Hajdas, 2008), samples were graphitised (Němec et al., 2010) and analysed using the MICADAS system (Synal et al., 2007). Total concentrations of elements (Sn1, Sn2) were measured using ICP-MS at the Adam Mickiewicz University (UAM) for trace metals and Observatoire Midi-Pyrénées (Toulouse, France) for Rare Earth Elements. Mercury (Hg) (Sn0) was measured using cold vapour-atomic fluorescence spectrometry (CV-AFS). The measurements of stable lead (Pb) isotopes (Sn1, Sn2) were conducted on TIMS Finnigan MAT-261 special (UAM). Total nitrogen (N), carbon (C) and sulphur (S) values (Sn2) were determined in dried and homogenised samples with a VarioMax CNS elemental analyser (Elementar Analyzensysteme GmbH, Germany). CN, C and N isotopes (Sn0) were analysed on an elemental analyser (ANCA GSL, Sercon, UK). SCPs (Sn0) were determined using light microscopy following the procedure of Rose (1994). Dust particles were determined (all three profiles) using the backscattered electron detector (BSE) of a scanning electron microscope (SEM) equipped with an energy-dispersive X-ray analysing system (SEM-FEI Quanta 250; University of Silesia in Katowice). Mullite content was determined in the profiles using X-ray diffraction (XRD), following the method described in Smieja-Król et al. (2019). Pollen and testate amoebae (Sn1) were determined using light microscopy following standard procedures. Non-metric multidimensional scaling (NMDS) was used to define the relationships between geochemical data, water table reconstruction and the response of testate amoeba and vegetation (pollen data) to anthropogenic forcing.
Results
Physical properties and macrofossils (Sn0, Sn1, Sn2)
The three investigated cores showed similar patterns of peat accumulation (Figure 2). Initially, the peat layers were mainly composed of minerotrophic mosses such as Sphagnum russowii and Straminergon stramineum, then followed by Sphagnum lindbergii in cores Sn1 and Sn2. In the upper part of the three peat monoliths, Polytrichum strictum also played a meaningful role as a peat-forming species. In the topmost part of Sn2 S. medium/divinum and S. balticum re-appeared, indicating a more oligotrophic habitat. Importantly, the preferred boundary of the proposed Anthropocene series is not encompassed by the boundary of local macrofossil zones. The detailed description of macrofossils can be found in the Supplemental Material 2.
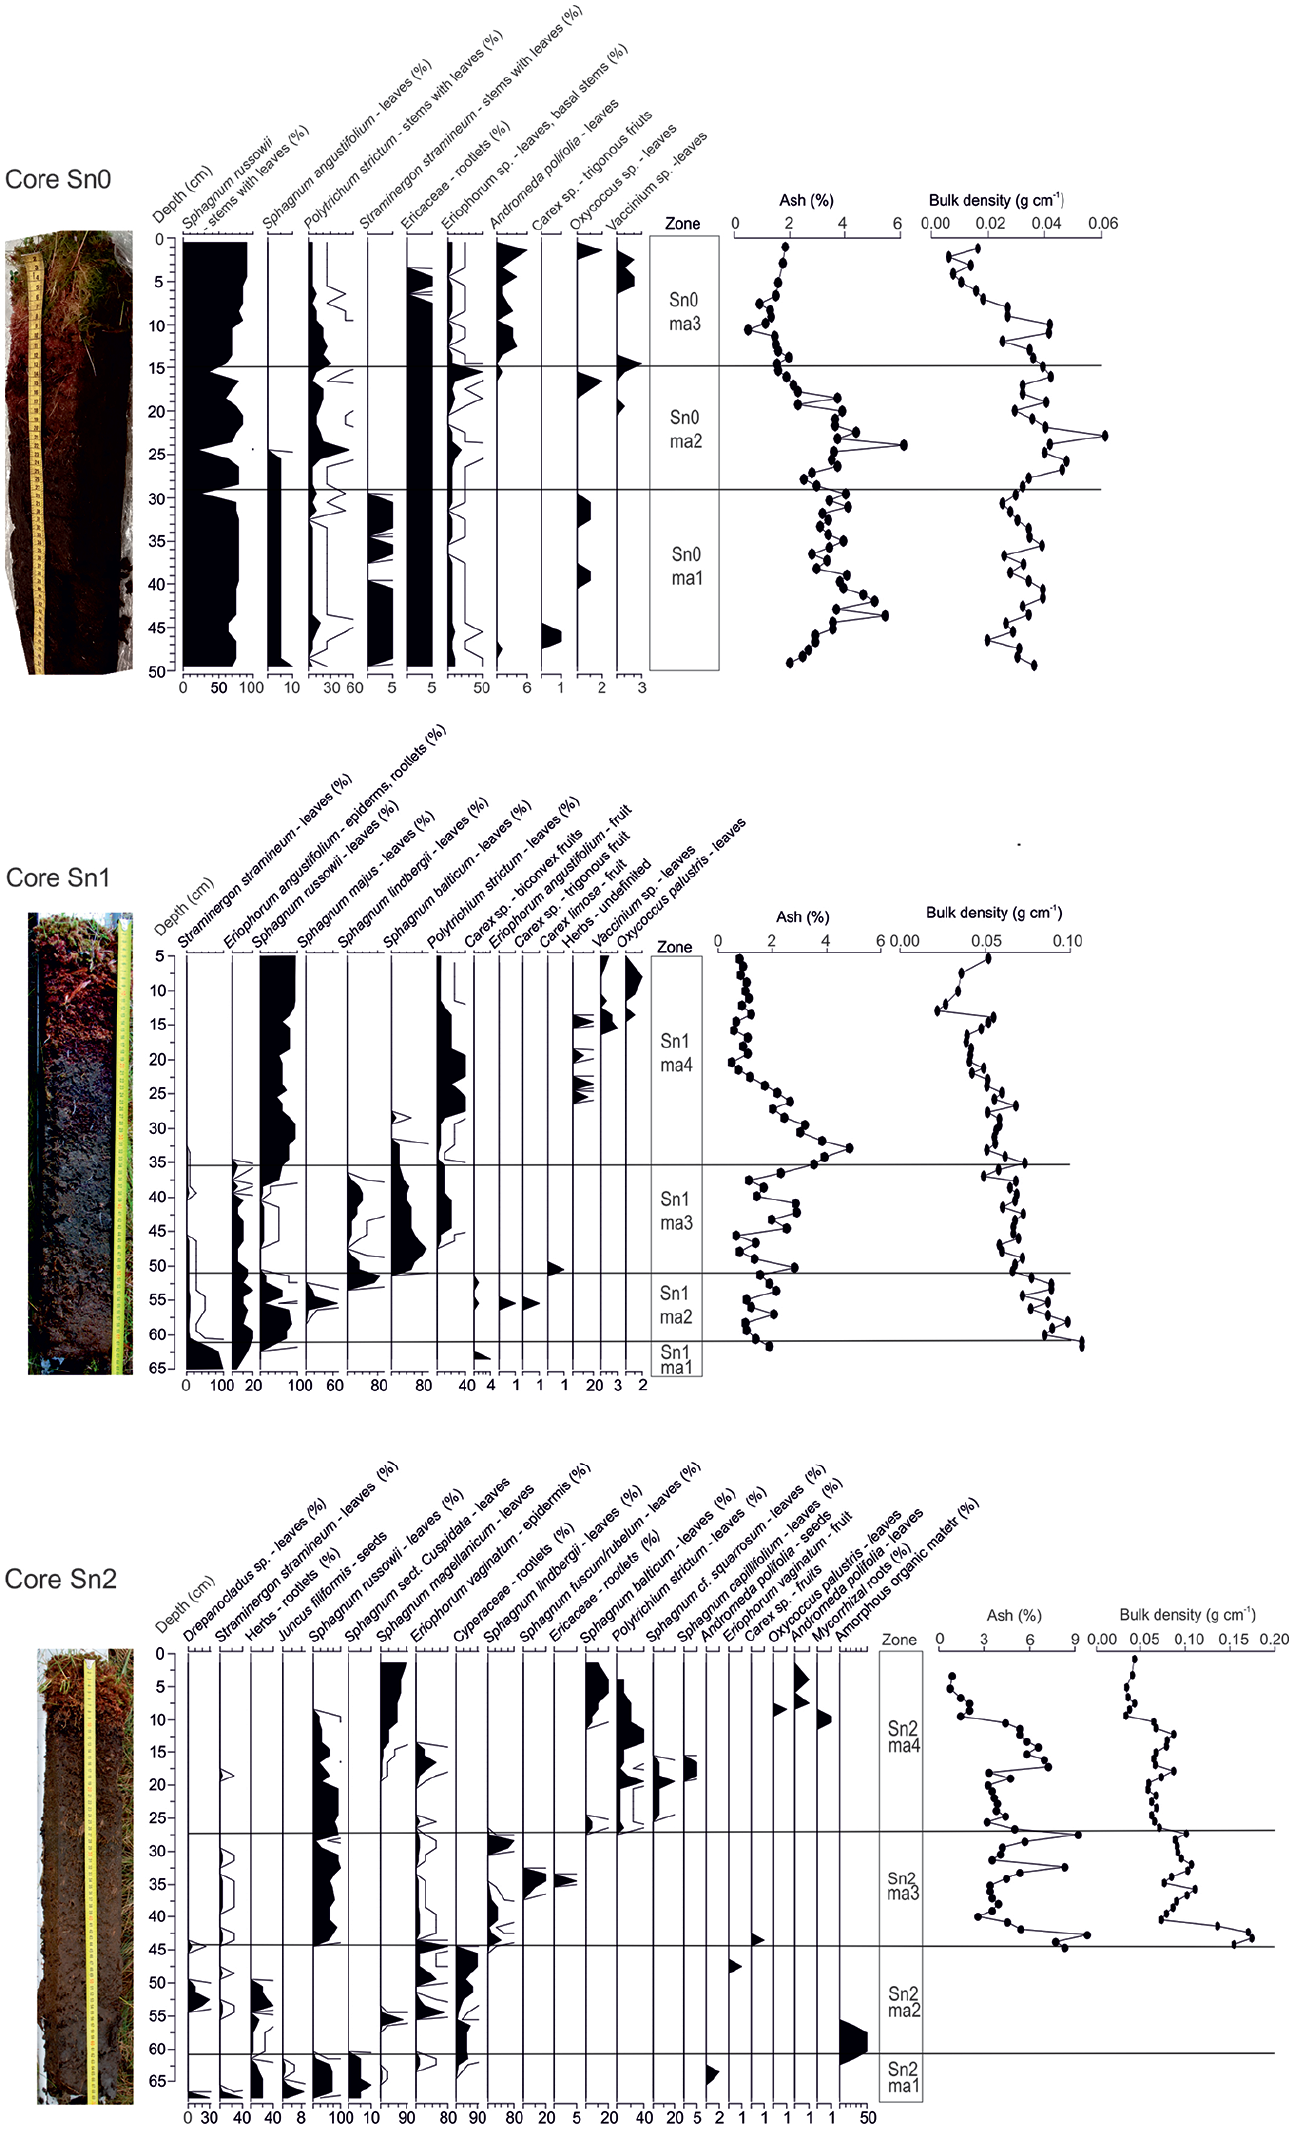
Results of macrofossil analysis and physical properties of peat profiles for all investigated cores. Reproduced in colour in online version.
The ash content (AC) in Sn0 and Sn1 is low (up to 6%) and shows more complex patterns compared to the botanical layering of peat. The Sn0 core has two zones with a boundary at c.a. 18 cm depth (Figure 2). The lower zone has 2%–4% higher ash content values than the upper one. In Sn1, there is a slight enrichment in AC between 36 and 22 cm. In this layer, AC is between 2% and 5% compared to <2% in underlying and overlying peat.
In Sn2, AC distribution shows considerable variability especially below 17.5 cm depth, where there are three positive excursions of AC at ca. 42.5, 32.5 and 28 cm. Above 17.5 cm two layers can be identified with enhanced (up to 6%) AC values between 17 and 10 cm and <3% contents in the topmost 10 cm.
Higher and more numerous maxima of AC in Sn2 indicated possible disturbance. Therefore, we used Sn2 only to show some critical results, such as mullite and SAP appearance, which correspond to the proposed Anthropocene series level within the geochemical profile (Figure 4).
Radioisotopes (Sn0, Sn1)
Activity concentrations of 137Cs in both profiles (Sn0, Sn1) were comparable and ranged between 56 ± 2 and 2576 ± 55 Bq/kg (Figure 3). Most of the total Cs activity concentration in Sn1 is retained in the upper 9 cm-thick layer. Two distinct peaks of 137Cs activity can be found at 23.5 cm (1011 ± 48 Bq/kg) and 26.5 cm depth (699 ± 58 Bq/kg). These peaks act as lithochronohorizons for the Chernobyl accident (1986) and the atmospheric nuclear weapon tests (1963), respectively.
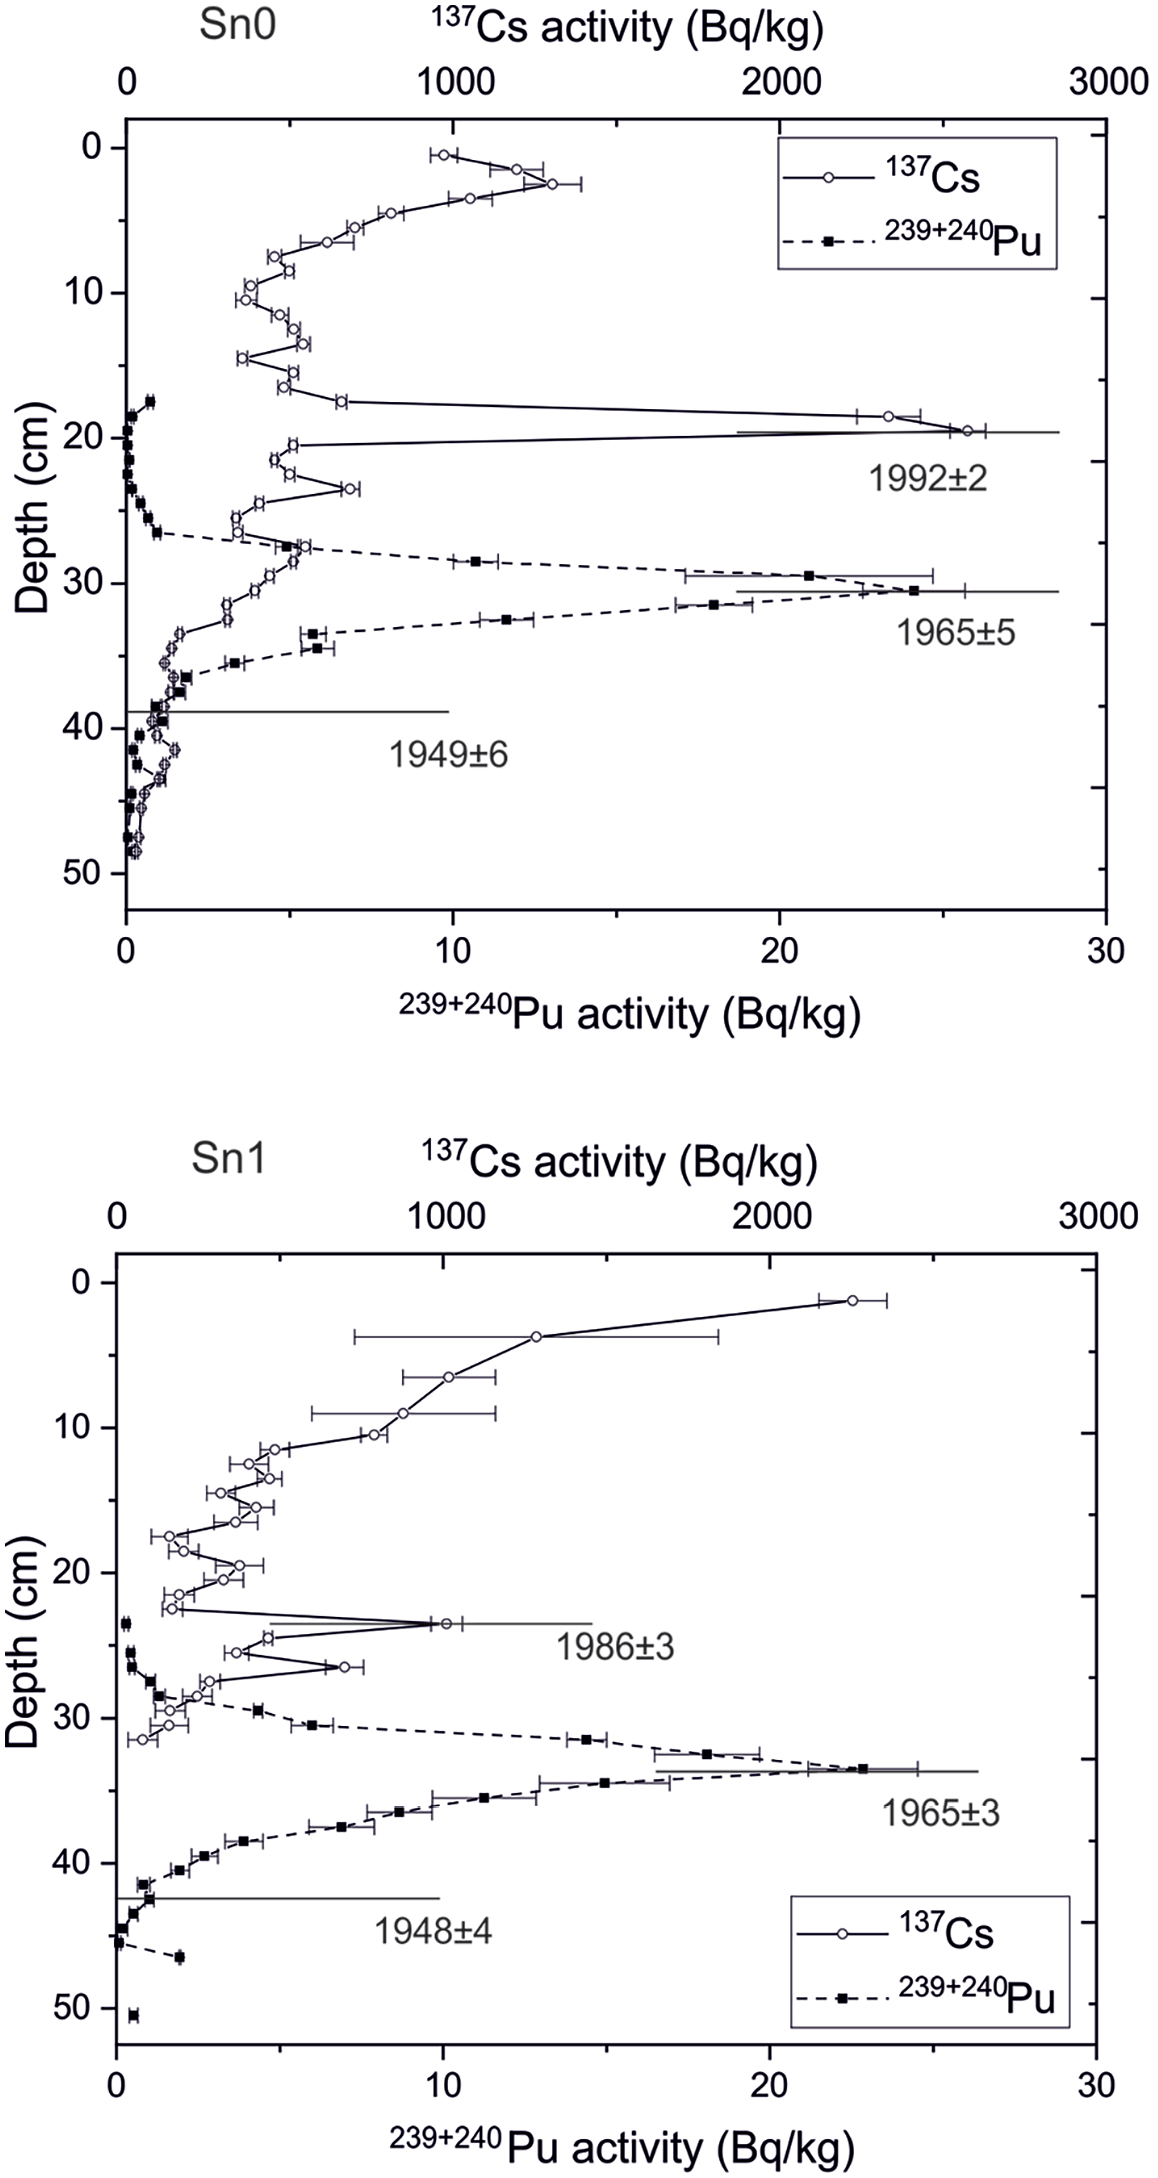
Comparison of 239+240Pu and 137Cs versus CF/CS modelled dates in Sn0 and Sn1.
In the Sn0 profile, three characteristic maxima of 137Cs were observed. The uppermost was located just below the peat surface, albeit lower than in the Sn1. The second activity peak occurred between 17 and 20 cm (maximum at 17.5 cm) and can be related to the Chernobyl event (1986). The lowest Cs peak, at 27–29 cm, was assigned to the nuclear weapon tests (1963), which was corroborated by the nearby position of Pu maximum at 30.5 cm depth.
The first traces of 239+240Pu occur at 45.5–46.5 cm depth in Sn1, with the maximum at 32.5–33.5 cm (Figure 3). The first distinct increase is recorded at a depth of 43.5–44.5 cm (Sn0), followed by a prominent peak at 30–31 cm depth, which correlates with the 1963 nuclear weapon tests. Above, the activity decreased continuously up-core until the next tiny peak recorded at 17.5–18.5 cm depth (Sn0) and 22.5–23.5 cm depth (Sn1), which correlates with the Chernobyl accident in 1986. The 239+240Pu activities then declined to minimum detectable activity (MDC) and varied between 0.04 and 0.09 Bq/kg in the upper part of the profiles Sn1 and Sn0.
Results of 14C in Sn0 samples are expressed as F14C (fraction modern 14C) (Reimer et al., 2004) and calibrated using the Bayesian sequence model of the OxCal calibration programme (Bronk Ramsey, 2009) with the bomb peak atmospheric data for the Northern Hemisphere (Hua et al., 2022). Except for one sample (Sn0 37.5 cm), all the samples follow the atmospheric NH bomb peak data (Supplemental Table 2; Figure 10). The high value of F14C measured for sample Sn0 37.5 might be due to the intrusion of young material into the lower layers of sediment. Consequently, the sample was not included in the OxCal model.
14C modelling for Sn1 revealed 220 years of peat accumulation. The data obtained from 14C activity suggests a hiatus in the Sn2 profile. Therefore, for further interpretation, only the top 44 cm, which spans a similar time interval compared to Sn1, were used for interpretation.
210Pb chronology (Sn0, Sn1)
The total 210Pb (210Pbtot) activity concentration versus profile depth is presented in Supplemental Table 1. The supported part (210Pbsup) was obtained as the mean value (±SD, 1σ) of activities for the lowermost layers, where the level of 210Pbtot has reached a steady value. By subtracting 210Pbsup activity from 210Pbtot activity on a level-by-level basis, the unsupported fraction (210Pbuns) was calculated. The average value for 210Pbsup fraction was the same for Sn0 and Sn1 and was estimated as 16 ± 3 Bq/kg. Based on the CF/CS model applied to 210Pb activities, the bottom of Sn0 (50 cm) was dated to 1931 ± 8 CE and the Sn1 (51 cm) was dated to 1927 ± 5 CE. Thus, the cores encompassed 90 ± 8 and 86 ± 5 years, respectively. The linear accumulation rates in Sn0 and Sn1 were 0.65 ± 0.11 and 0.53 ± 0.04 cm/year, respectively, and the mass accumulation rate r was 0.020 ± 0.002 and 0.035 ± 0.002 g cm2/year, respectively. 210Pb-derived dates from ombrotrophic peat deposits are always validated by independent evidence such as pollution records or other radioisotopes, including 239+240Pu, 241Am (e.g. Appleby et al., 1997; Cwanek et al., 2021; Gallagher et al., 2001; MacKenzie et al., 1998) because decreasing with depth 210Pb activity provided older than expected data. 210Pb dating of peat has been suggested to be unreliable in some studies (e.g. Urban et al., 1990), especially when the CRS model is used (Cwanek et al., 2021; Mróz et al., 2017). Both models (CF = CRS and CF/CS) were used to calculate the ages, but the CRS model gave very old ages for the bottom layers (1828 ± 10 CE for 44.5 cm compared to CF/CS 1941 ± 7 (Supplemental Table 1). For the peat layers dated with Pu at 1952 (the appearance of plutonium in the environment) in core Sn0 and Sn1, the CF/CS model gave 1949 ± 7 CE and 1948 ± 4 CE, while the CRS model provided much older dates of 1900 ± 2 CE and 1921 ± 1 CE, respectively. Similarly, the layers corresponding to the maximum of 239,240Pu concentrations reflecting the peak fallout of 1963 were better dated with the CF/CS model.
The main distinction between the two models is that CF/CS assumes a constant atmospheric flux of 210Pb to the peatland surface and a constant accumulation rate. In contrast, CRS assumes a constant atmospheric flux of 210Pb and a variable accumulation rate of peatlands (Supplemental Table 1, Figures 7 and 8).
Trace elements (Sn1, Sn2)
The contents of Pb, Zn, Cu, Ni, Cr, Sr, Ti and Al in Sn1 and Sn2 cores, as well as REE in Sn1 core, were first discussed in Fiałkiewicz-Kozieł et al. (2020), where all elements represented a similar pattern of distribution. Further discussion in the current paper is centred on Pb, Zn, U, Sc, Al, REE and S (Figure 4) for their well-documented linkages with anthropogenic activity and the ability for long-range atmospheric transport (Steinnes and Friedland, 2006). Pb, Zn and U are known to be released by industrial processes (De Vleeschouwer et al., 2010a; Shotyk et al., 1998), S was an important component of acid rain (Mylona, 1996), while Sc, Al and REE carry the information on dust supply to the peatland (Kylander et al., 2007; Shotyk et al., 2001). For better profile documentation, only concentrations are shown in the figures. However, it should be mentioned that it is crucial to calculate accumulation rates using the age-depth model and bulk density values for a better interpretation of observed variability in the concentrations. Normalised results allow for excluding the effect of some post-depositional processes in the peatland.
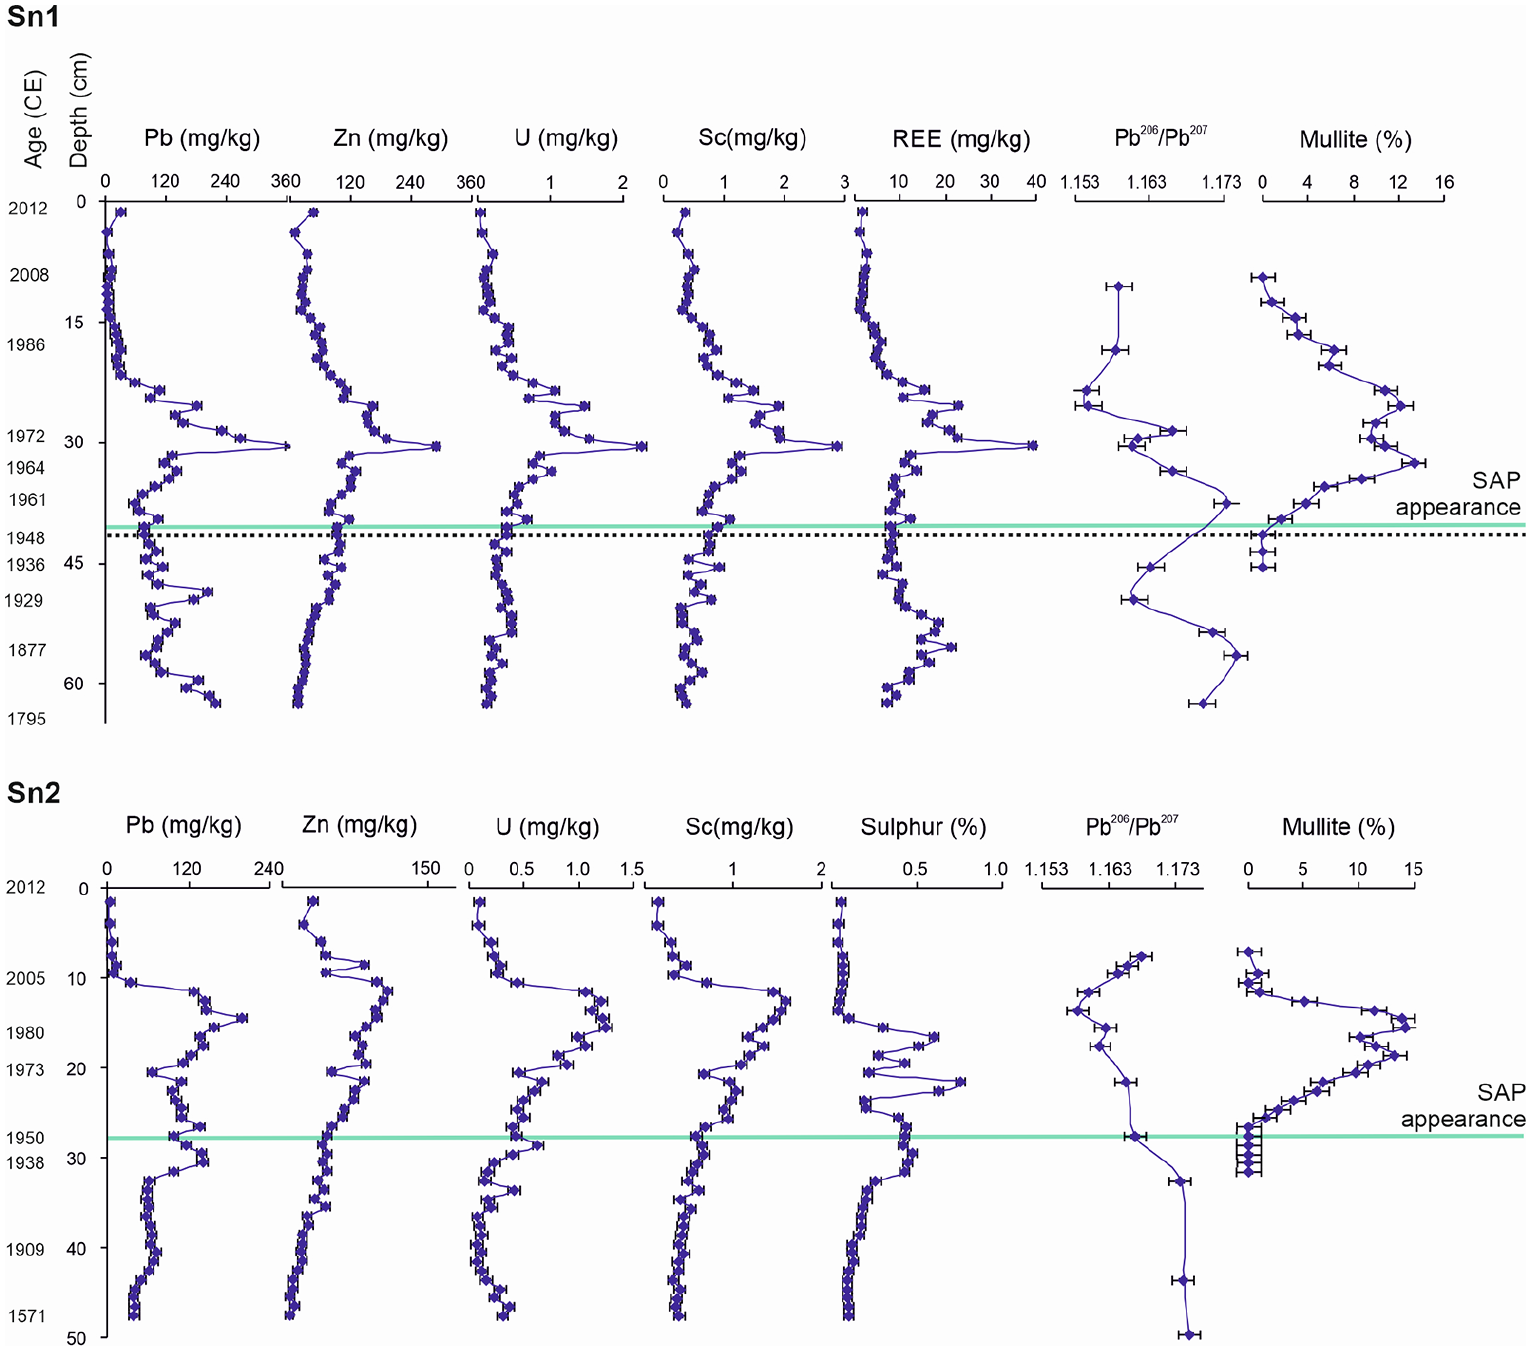
Geochemistry of Sn1 and Sn2 (based on Fiałkiewicz-Kozieł et al., 2020 except for mullite and sulphur). Sn1 profile records the appearance of 1952-Pu and spheroidal aluminosilicates (SAP) signal, while Sn2 SAP signal only. The chronology is based on the 14C/210Pb model. At a depth of 41.5 cm (Sn1), the date of the first Pu appearance is provided, not measured in Sn2. Reproduced in colour in online version.
Regarding chemical composition, the Sn1 profile was divided into two layers. From ~62.5 to 45.5 cm (1795–1952 CE) – with an increase of Pb concentration – up to 220 mg/kg (62.5; 49.5 cm). A slight increase of Zn is observed from 59.5 cm (1828 CE). An increase in REE is observed from 52.5 to 57.5 cm (Figure 4).
In Sn2, despite partial disturbance of the investigated profile, the distinction of the two layers is also possible (Figure 4). According to the age-depth model, the layer spanning period similar to Sn1 and Sn0 is 43.5 cm (1899 CE) to the top of the profile. The increase in Pb and S is observed from 31.5 cm (1937 CE), and a slight rise is distinguished in U concentration (33.5 cm – 1928 CE).
Hg (Sn0)
In the Sn0 core, mercury concentration (Figure 8) shows a gradual increase from around 70 ng/g at the core base to the maximum level of 228 ng/g in 30.5 cm (1966 CE) and then declines upwards to a value of over 40 ng/g, with some minor fluctuations (Figure 8). A significant 1950s upturn in Hg concentration is observed at 36.5 cm (1953 CE).
Pb isotopes (Sn1, Sn2)
Pb isotopic ratios are presented in Figure 4. In both Sn1 and Sn2 profiles, 206Pb/207Pb altered from more to less radiogenic value, reaching 1.160–1.162 during the time of the highest detected concentration of all elements. The ash content and chronology revealed disturbances and hiatuses in Sn2. However, the 27.5–0 cm layer, the most important for the Anthropocene, seems reliable and coherent. Lead isotopic signatures revealed similar age and depth patterns in peat profiles during the last 100 years. The observed more complex pattern of Pb isotopic signature in Sn1 might be due to different, higher resolution data, which show variations linked to different sources of Pb associated with changes in wind direction.
C, N, δ13C, δ15N (Sn0)
The TOC, TN, δ13C and δ15N values are shown in Figure 8. With depth, there is a long-term enrichment in 13C as shown by the δ13C values (from about −24‰ to −28.5‰), but from the surface to the first 8 cm there is a 13C depletion (−25.7‰ to −28.5‰). δ 15N values also show a long-term enrichment from around −7‰ to −1‰ in the oldest part of the core. TOC values remain constant with depth while TN values show a significant decrease in the first 8 cm. TN values show a significant drop from 1.2 to 0.4 in the first 8 cm and then fluctuate between 0.4 and 1. C:N ratios increase in the first 8 cm from 35 to 90 and then fluctuate between 90 and 40.
Technofossils
SCP (Sn0)
The SCPs appeared in the record at 44–45 cm (approximately 1939 ± 7 CE) (Figure 8) and occurred continuously above 42–43 cm (1943 ± 7 CE) to 8–9 cm (2012 ± 1 CE). No SCPs were found in the upper 8 cm of the core.
SAP (Sn0, Sn1, Sn2)
Spheroidal aluminosilicates fly ash particles (SAP) were the dominant technogenic dust particles detected in the profiles using SEM. In Sn0, SAPs were first found at a depth of 44.5 cm (1939 ± 7 CE) (Figure 8), in Sn1 at 39.5 cm (1950 ± 4 CE) and in Sn2 at 26.5 cm (1950 CE) (Figure 4). The size of SAP was analysed for the Sn0 and Sn1 profiles. Most of the SAP at different depths were <1–9.5 µm, which indicates the predominance of SAPs from long-range transport (Smieja-Król and Fiałkiewicz-Kozieł, 2014). A mean SAP size of 2.2 µm was obtained for Sn0 (n = 300) and 2.4 µm (n = 180) in Sn1. A small number (<2%) of much larger (10–50 µm), less regular and highly porous technogenic aluminosilicates found within a depth range of 35–25 cm in Sn1 (1961–1983 CE) were probably from local sources. Mullite, an aluminosilicate (Al6Si2O13) by-product of coal combustion in high temperatures (>1100°C; Smieja-Król et al., 2019), was detected in all profiles (Figures 4, 7 and 8) using XRD. In Sn0, mullite was detected between 12.5 and 40.5 cm (1947 and 2003 CE), with elevated contents between 21.5 and 35.5 cm (1955 and 1988 CE) and a maximum at 26.5 cm. In Sn1, the range of mullite occurrence was similar, between 11.5 and 39.5 cm (1952 and 2005 CE), with two distinct maxima at 25.5 and 32.5 cm. In Sn2, the mullite was only identified in a relatively narrow depth range between 9 and 26 cm. The two maxima were at 15–16 and 18–19 cm.
Biotic proxies (Sn1)
The biostratigraphy was based on pollen, non-pollen palynomorphs, microcharcoal and testate amoebae (Sn1) (Figures 5 and 6). The proxies revealed three main ecological phases of the peatland with different local and regional agricultural and pastoral activities.
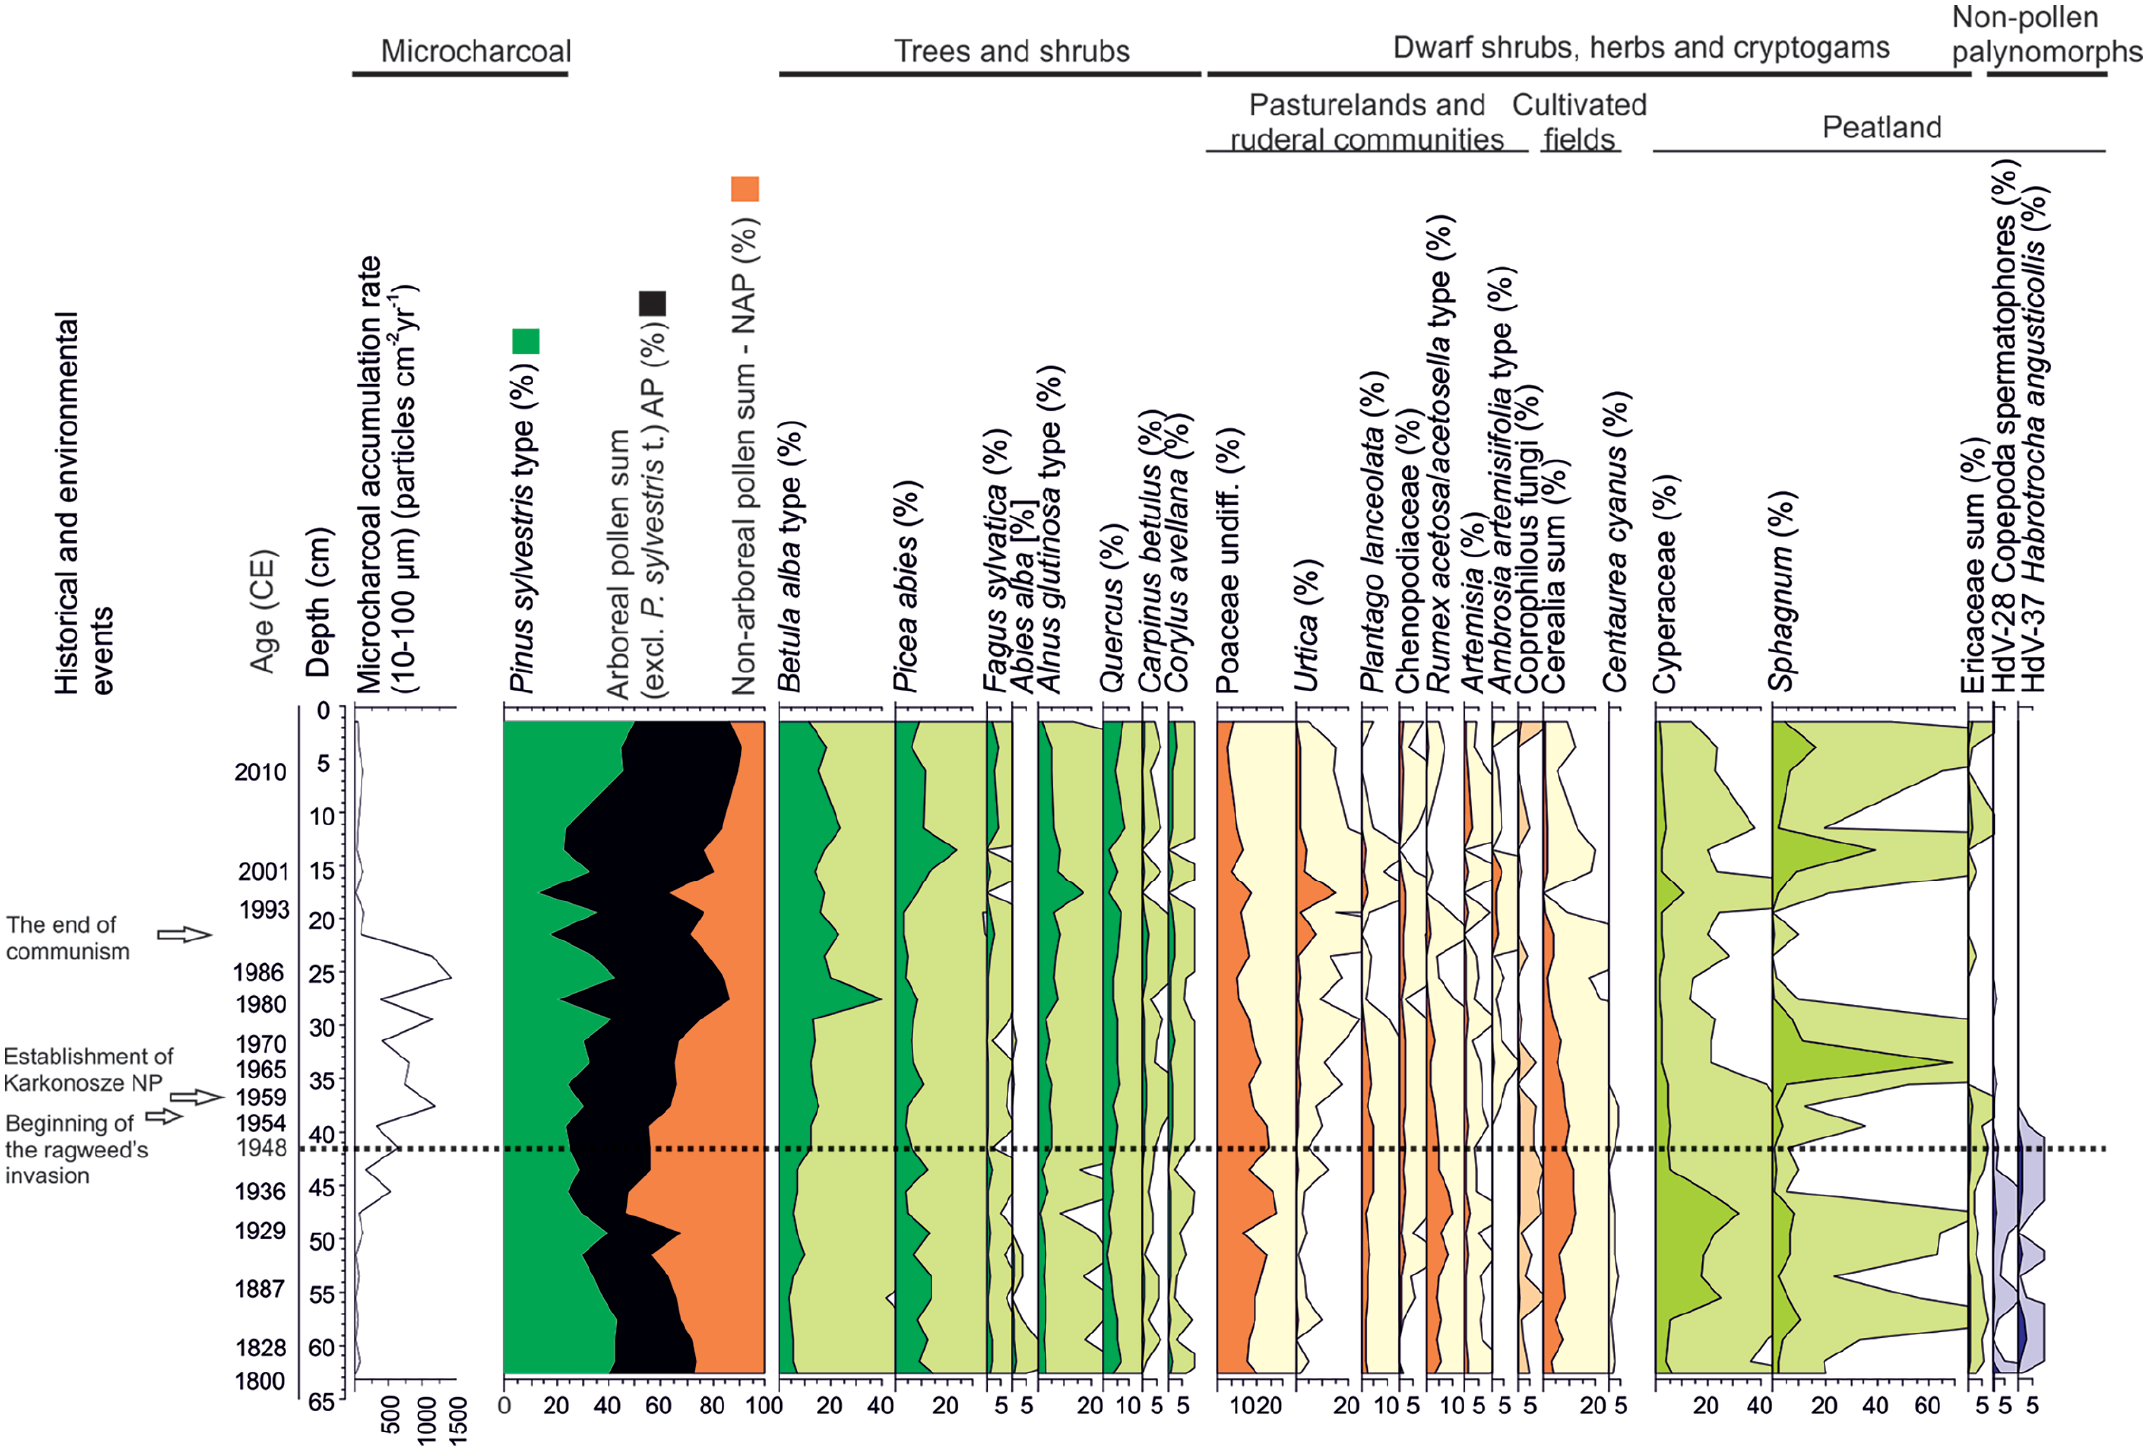
Simplified pollen diagram for Sn1 profile. 10 × exaggeration provided for better visualisation. At a depth of 41.5 cm, the date of the first Pu appearance is provided. Reproduced in colour in online version.
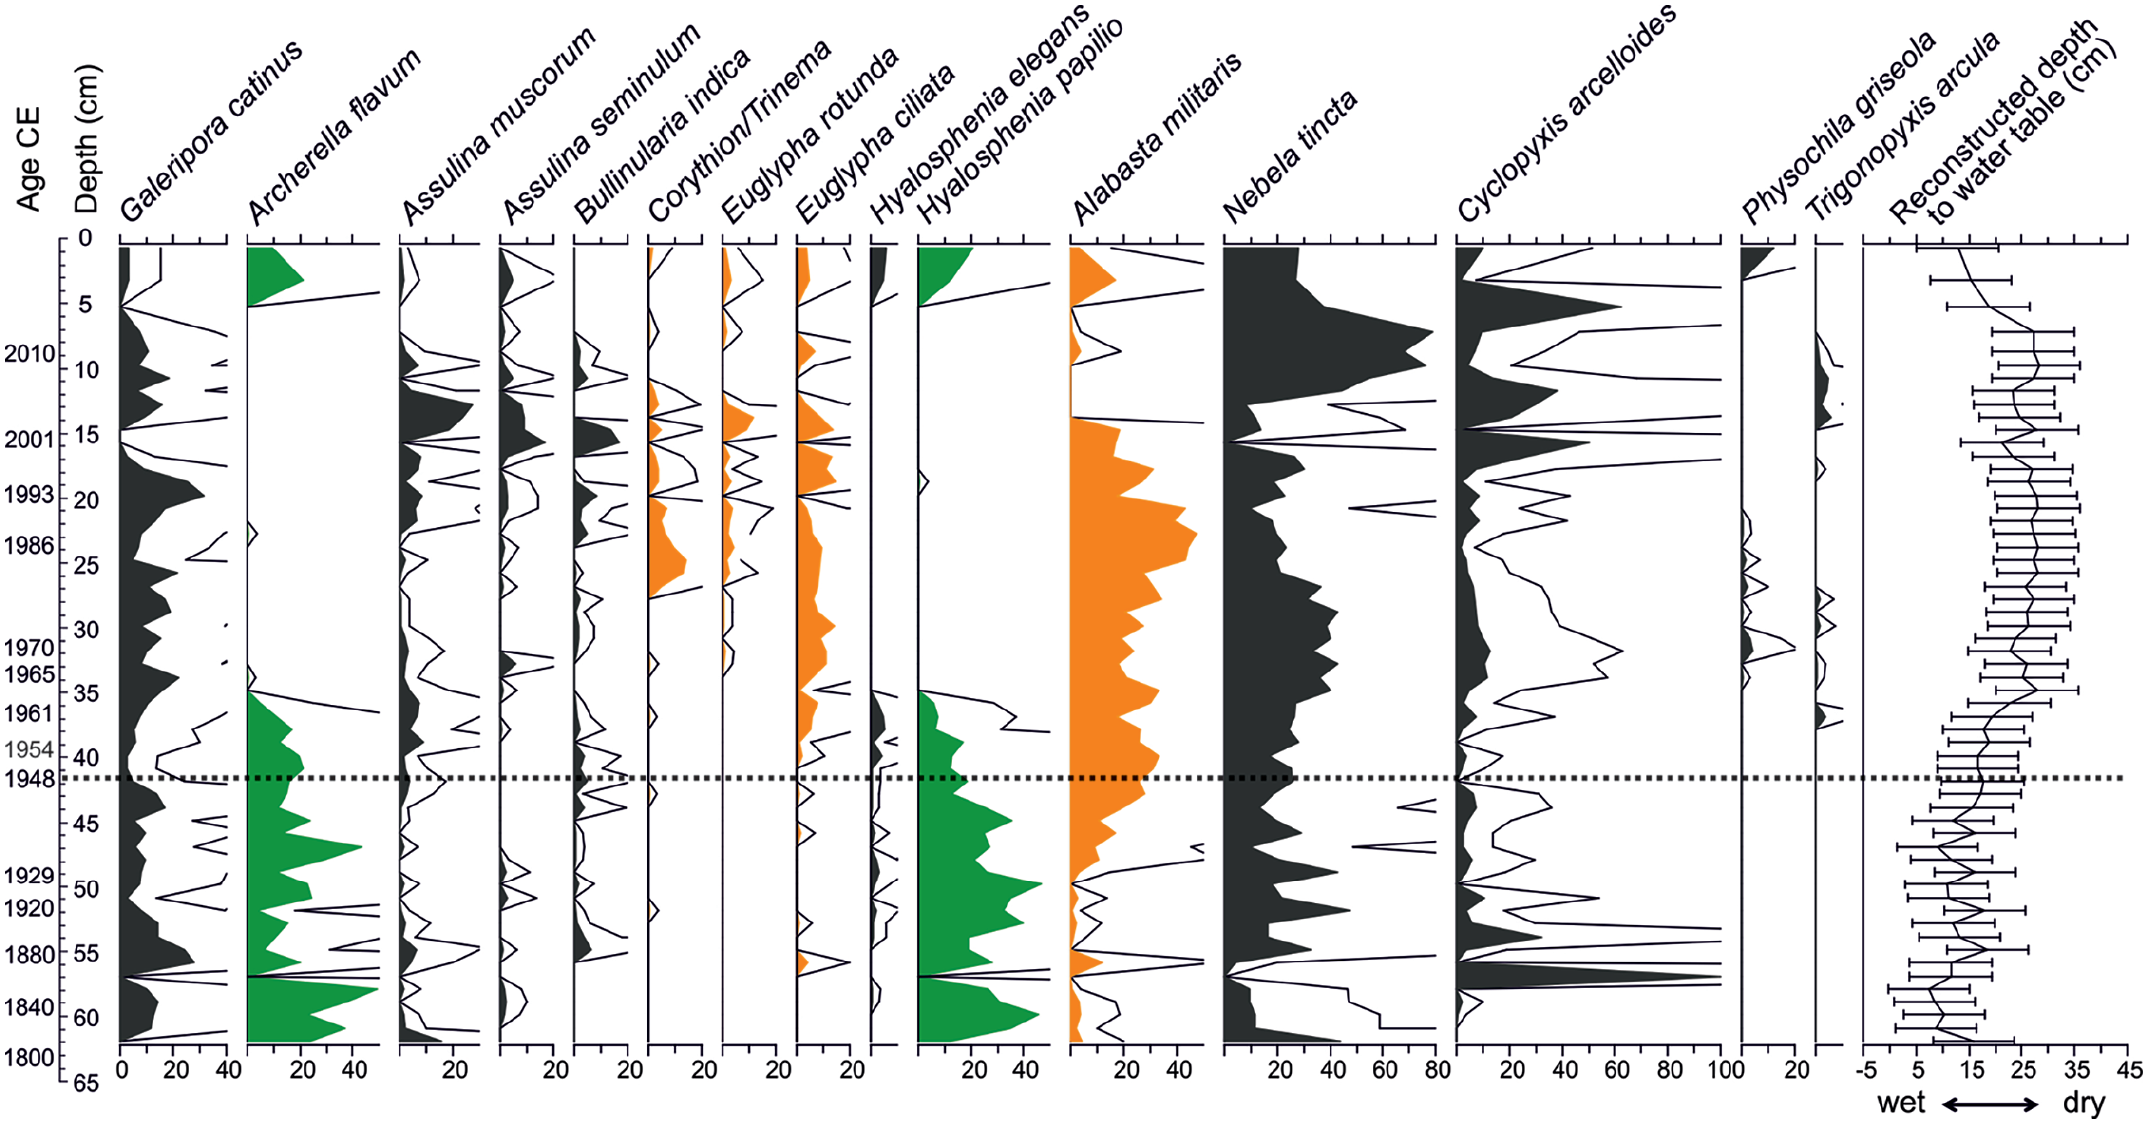
Short percentage diagram of the most frequent testate amoebae and reconstructed depth to the water table in Sn1 profile. In green – mixotrophs, orange – indicators of dry conditions. 5 × exaggeration provided for better visualisation. At a depth of 41.5 cm, the date of the first Pu appearance is provided. Reproduced in colour in online version.
Pollen spectra revealed alpine and upper montane forests in the vicinity of the Śnieżka coring sites. Alpine vegetation was represented by the predominance of herbaceous plants (Poaceae) and high shares of Pinus sylvestris, Betula alba and Picea abies. The upper montane forest was indicated by Pinus mugo pollen grains. High values of Cerealia type indicate enhanced agricultural activity in the mountain valleys (Figure 5). In terms of the Anthropocene, the most pronounced changes in vegetation are marked by the decline of coprophilous fungi percentages and a gradual increase in Urtica values. The decline of coprophilous fungi indicates a decline in pastoral activity. In contrast, the increase in Urtica pollen percentages may be linked to further nitrification of peatland from the input of industrial dust. From ca. 1956 CE (37.5 cm), a continuous presence of pollen of Ambrosia artemiisifolia type was observed (Figure 5). The microcharcoal analysis revealed a pronounced upturn at 49.5 cm (1927 CE), keeping the increasing trend till 19.5 cm (1995 CE).
Regarding the testate amoebae, the continuous high abundance of the mixotrophic species Archerella flavum and Hyalosphenia papilio were observed till 37.5 cm (1956 CE). This was followed by the disappearance of mixotrophs at 36.5 cm (1959 ± 3 CE) and the appearance of dry habitat indicators such as Alabasta militaris, Nebela tincta and Galeripora catinus (drop in the water table, mean DWT value: 26 cm) was recognised (Figure 6).
The shift between biotic proxies is clearly visible in the non-metric multidimensional scaling (NMDS)’s ordination space (Figure 9). The most significant variables influencing the communities have been water table depth (Pr(>r): 0.001), Fe (Pr(>r): 0.022) and Pb (Pr(>r): 0.095). The communities typical for the lower part of the peat core were characterised by high abundances of mixotrophic testate amoebae, and the peatland possessed high water tables. Among geochemical data, the presence of Fe and Pb is connected to this phase. The shift in the data set appeared between ca. 1951 and 1965 CE, and the anthropogenically affected communities were dominated by heterotrophic testate amoeba species. The water table decreased, and plant communities were dominated by Ambrosia and Urtica.
Discussion
Peat record before 1950 and preferred base for the Anthropocene series
The obtained multi-proxy data of Sn0, Sn1 and Sn2 profiles allows distinction of the boundary between the Holocene and the proposed Anthropocene series encompassing the period of ovehelming human pressure on the environment, called the Anthropocene. Geochemical and palaeoecological data consistently indicate that the period between 1795 and 1948 ± 4 CE (63.5–41.5 cm – for Sn1 and 47.5–26.5 cm – for Sn2) was characterised by moderate industrial activity in the region. This is confirmed by relatively low Pb accumulation rates (8–20 mg/m2/year), accompanying high concentrations of Pb in peat (100–220 mg/kg in Sn1) as well as less radiogenic Pb isotopic signatures (1.174–1.160). Zn concentrations were low, albeit displaying an increasing trend during this period and only at the end of the 19th century (around 1897 CE; 52.5 cm) was a considerable increase in Zn accumulation rate from 2.5 to 7 mg/m2/year. From pollen data, it emerged that the Sudetes mountains were prone to intensifying deforestation, although the predominant land use type was arable farming and pastoralism. The low fluxes of microcharcoal (60 particles/cm2/year) (Figure 5) seem to indicate low emissions of combustion-related dust but also low settlement density in adjacent valleys and submontane zones, which might affect the appearance of the fire indicator in the peat record (Patterson et al., 1987). Testate amoebae composition (Figure 6), with high shares of mixotrophic species Archerella flavum or Hyalosphenia papilio provided evidence for wet conditions (i.e. higher groundwater level) in the mire.
The year 1948 ± 4 CE (the first global Pu fallout in 1952) appears to be a tipping point in the Śnieżka peatland history (Figures 7–9). In the three cores, this date is marked by sharp changes in the deposition of multiple independent geochemical markers of diverse human activities such as fossil fuel combustion, industrialisation and nuclear weapon tests superimposed on climatically driven environmental changes. The first worldwide appearance of Pu (Koide et al., 1979; Krey, 1967; UNSCEAR, 2000) can be recognised globally in different natural archives, including peatlands (Waters et al., 2015). Owing to its synchronicity, Pu is considered a primary marker of the onset of the Anthropocene (Head et al., 2022; Waters et al., 2018).
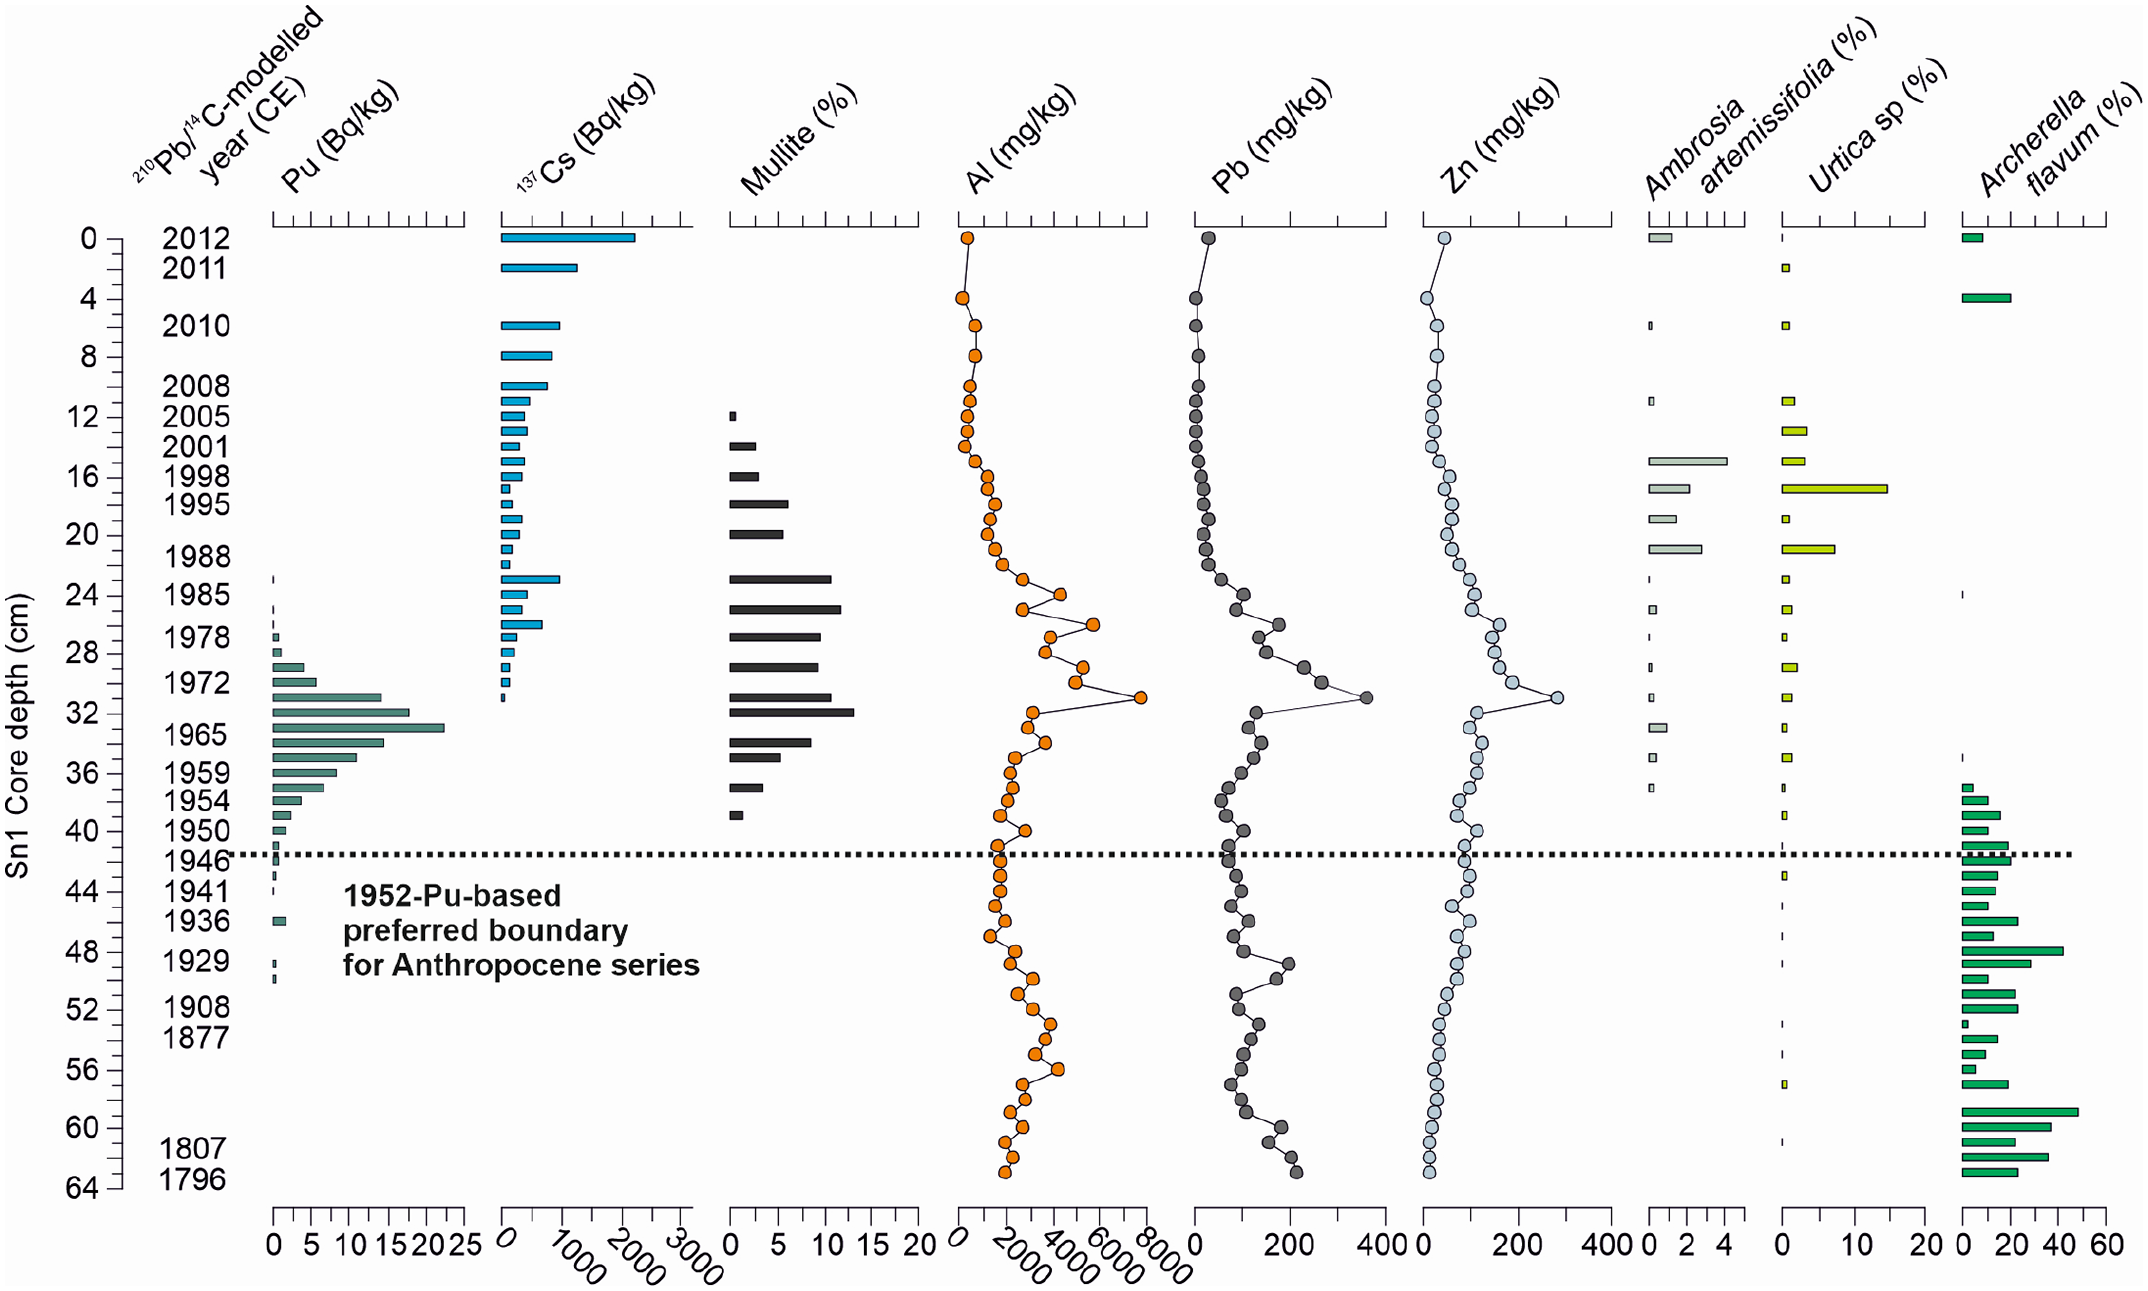
Summary of the most significant markers in Sn1. The horizontal dashed line is referred to first global Pu fallout (1952). Reproduced in colour in online version.
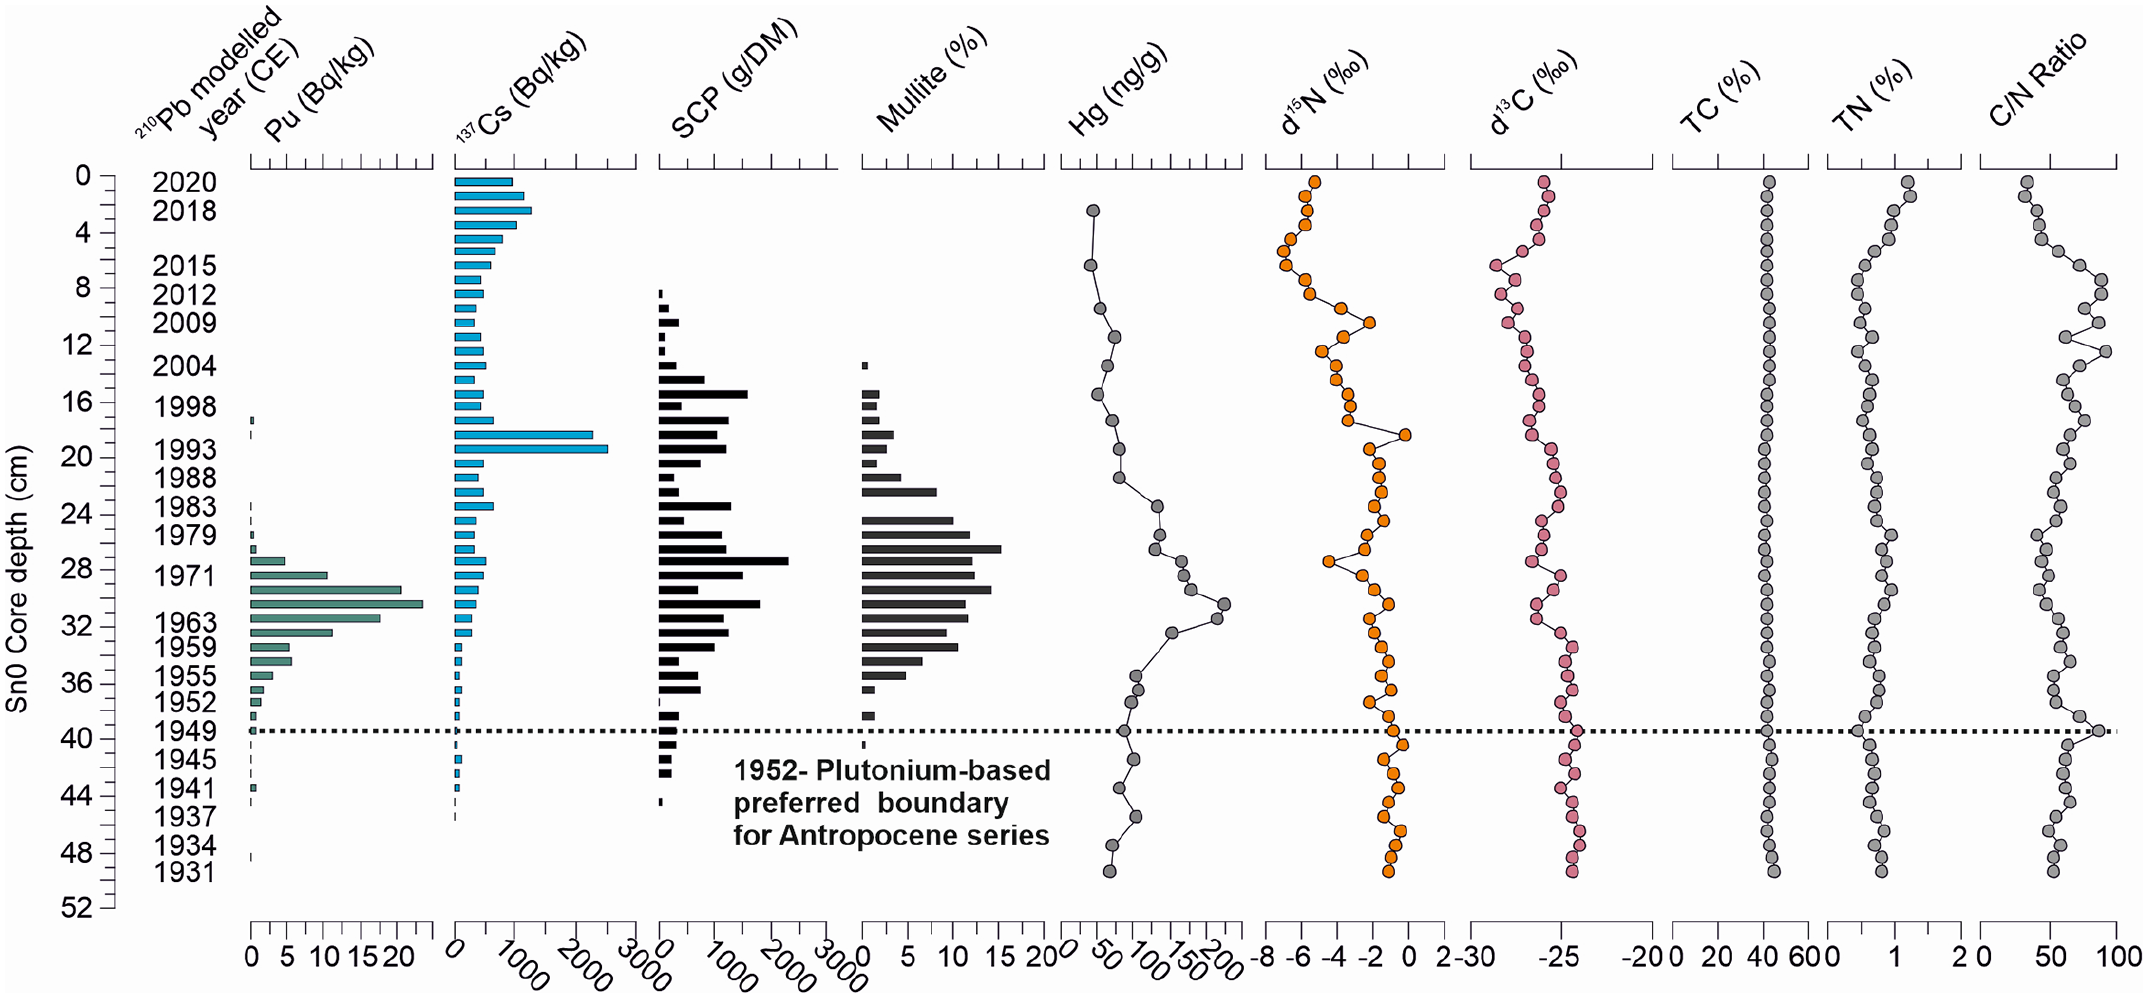
Summary of markers in Sn0. The horizontal dashed line is referred to first global Pu fallout (1952). Reproduced in colour in online version.
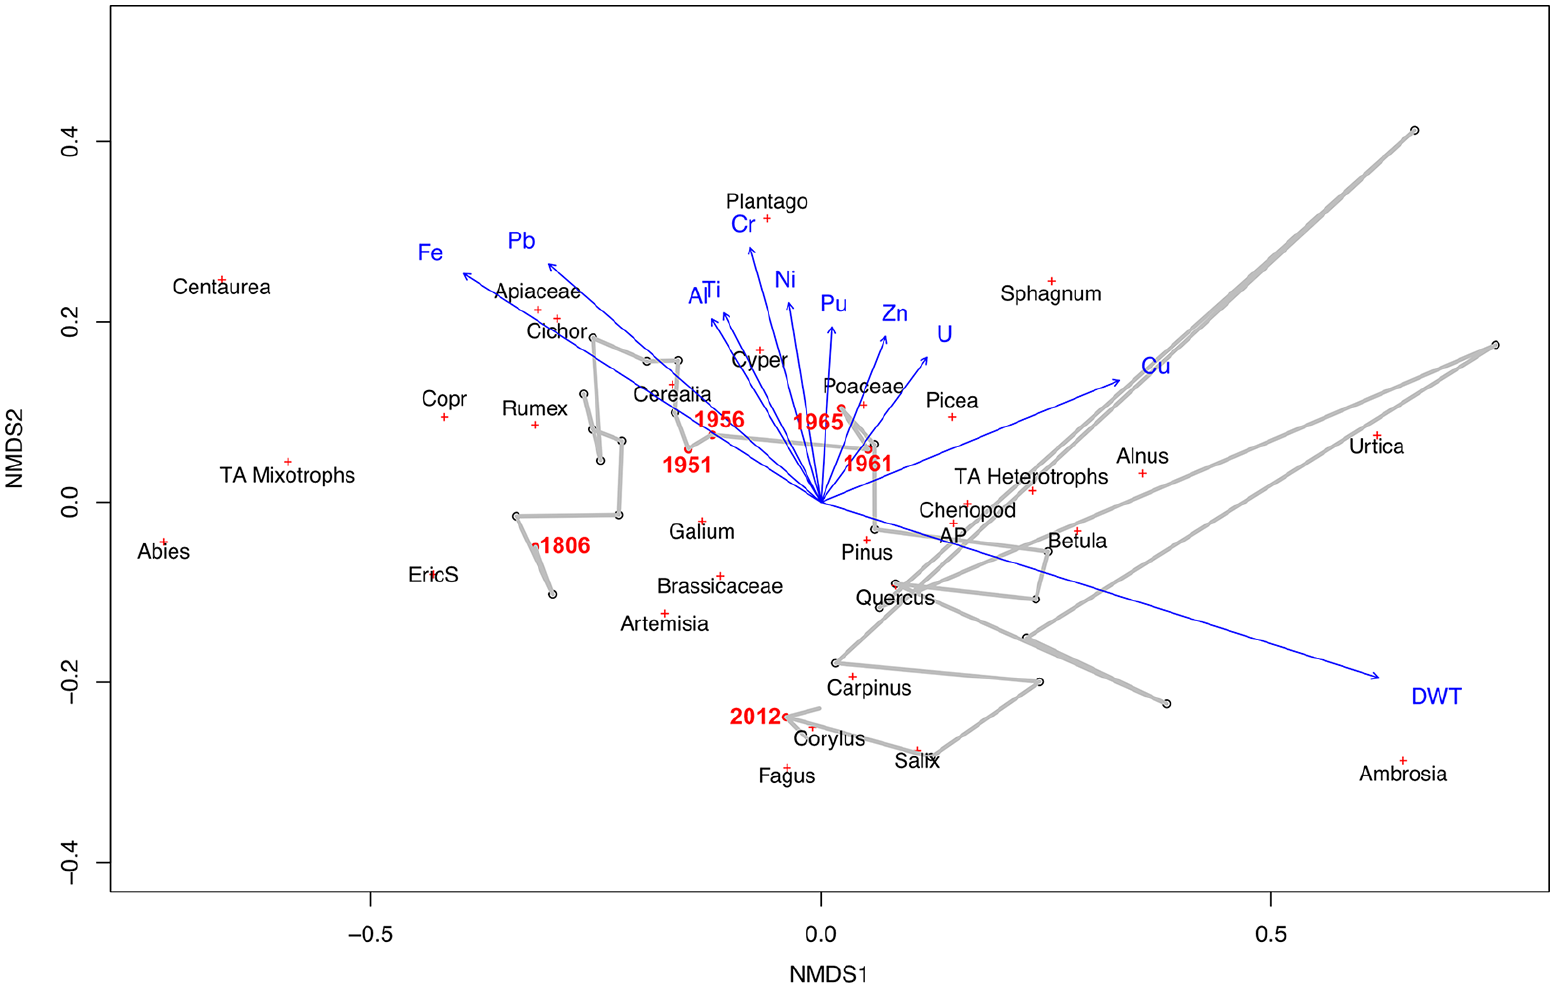
Non-metric multidimensional scaling (NMDS) diagrams for Śnieżka multiproxy dataset. NMDS shows a low-stress value (0.106) for the two-dimensional solution. Reconstructed depth to the water table (DWT) and geochemical data are projected on the ordination space. Codes for pollen types follow the pollen diagram (Figure 5). Testate amoebae are projected as a sum of mixotrophic species (‘TA Mixotrophs’) and a sum of heterotrophic species (‘TA Heterotrophs’). Reproduced in colour in online version.
The appearance of Pu is accompanied by the pronounced inflexion (acceleration) or significant upturn of other chemostratigraphic and selected biostratigraphic indicators as well as technogenic particles (SCP, SAP and mullite), which appeared in the pre-Anthropocene deposits as traces. The NMDS solution (Figure 9) showed low stress values (0.1060076) and proved that the shift in testate amoeba groups (mixotrophs vs. heterotrophs), plant macrofossils and main pollen types appeared in the 1950s, further supporting this period as the boundary for the Anthropocene series. The markers, crucial in presenting global patterns in the geological record, were divided into three globally identified categories, that is, primary markers, technogenic impacts and climate change, represented here by specific, regional examples of indicators.
Primary markers
The atmospheric deposition of 239+240Pu in the Śnieżka cores correlates with global events in the history of radioactive fallout, notably coupled to thermonuclear atmospheric weapons testing from 1952 and the Partial Test Ban Treaty signed in 1963 (Figures 3, 7 and 8). Plutonium isotopes (238,239,240Pu) are useful independent chronostratigraphic markers due to long half-lives of 24,100 (239Pu) and 6561 years (240Pu), respectively. They are characterised by low solubility and high stability in peatlands, as Pu is retained by Sphagnum mosses (Testa et al., 1999; Waters et al., 2015). There is a 2-cm difference between the first appearance of 239+240Pu in Sn1 and Sn0, caused by different dynamics of peat growth. Nevertheless, the high repeatability between the two profiles confirms the immobility of Pu in the presented stratigraphic record (Figures 3, 7 and 8). We may summarise that the highest extended peak of 239+240Pu activity concentrations dated to 1965 ± 3 CE for Sn1 and 1966 ± 5 CE for Sn0 (CF/CS) were the consequences of the most intensive period of nuclear weapons testing and a further moratorium in the 1960s.
Due to Pu immobility, the historical data of the first global fallout should be attributed to the layer of 1952 CE, which is consistent with ages modelled by the 210Pb method.
1952-peaks are observed at the 41.5 cm depth (1948 ± 4 CE) for Sn1 and 39.5 cm depth (1949 ± 6 CE) for Sn0 (Figures 3–6, Supplemental Table 1). Below 1952 in both profiles, we observed small peaks dated 1941 for Sn0 and 1936 for Sn1. The presence of the global fallout derived Pu at depth-ages preceding 1952 is probably evidence of the post-depositional migration of Pu vertically downwards, also observed by others in peat profiles (Kazakevičiūtė-Jakučiūnienė et al., 2022; Quinto et al., 2013). However, the extent of the mobility is much smaller than for Cs, thus not significantly affecting the age-depth models based on Pu profiles. The shift in the levels of the F14C for Sn0 (Figure 10) compared with the atmospheric curve NH1 (Hua et al., 2022) revealed a great similarity to the Pu curve plotted versus 210Pb model, confirming the robustness of the used modelling.
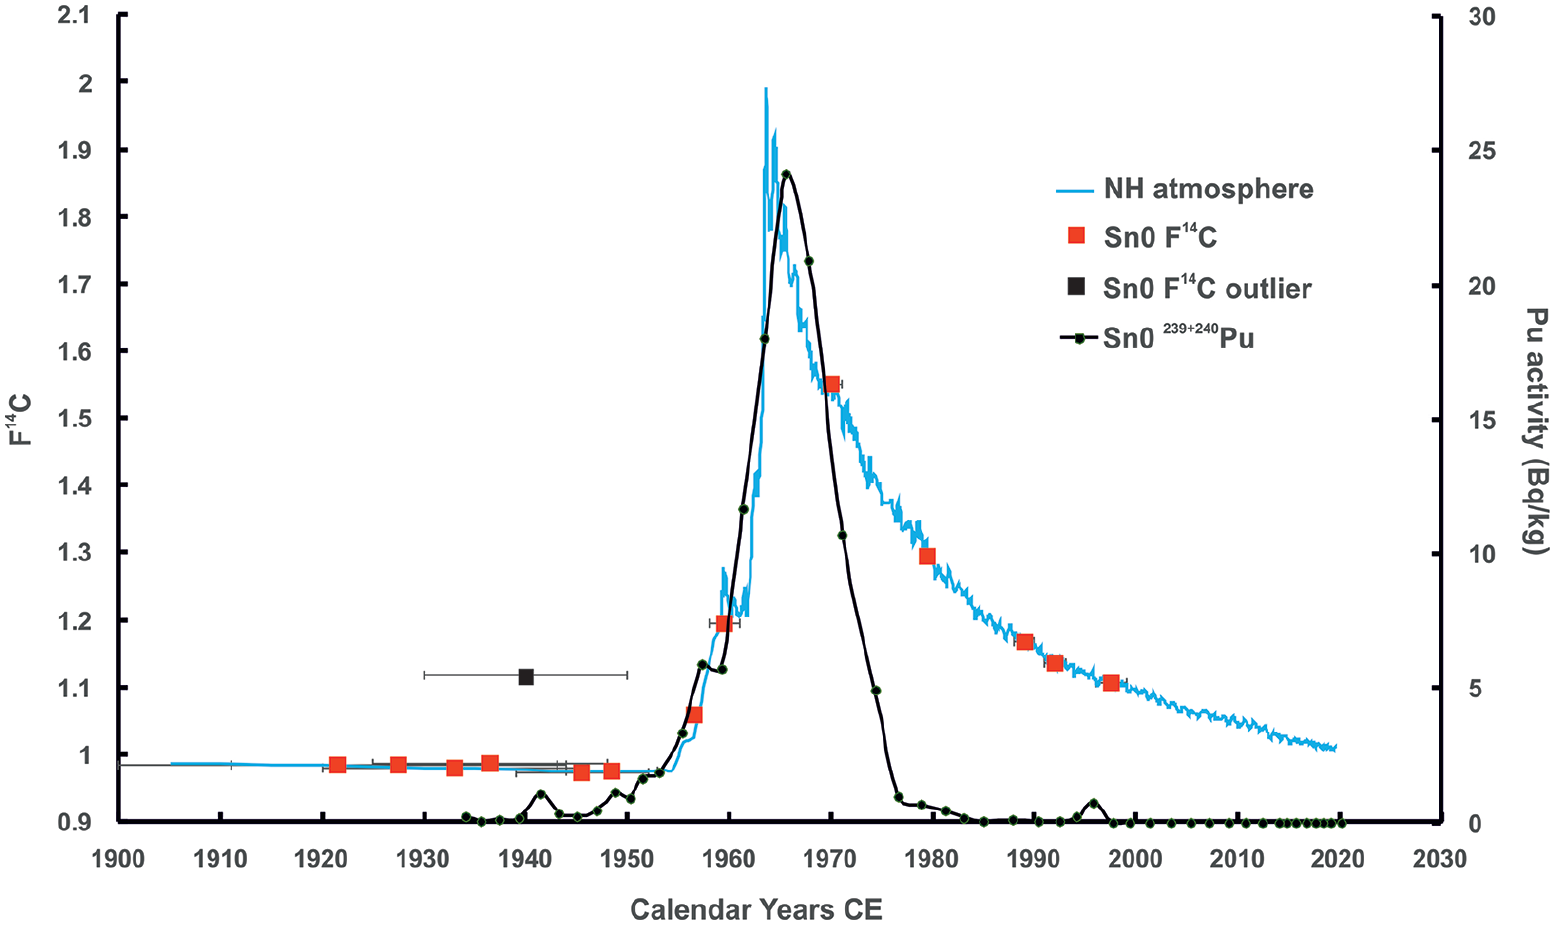
The comparison of F14C values (Sn0) (against 14C age-depth model) with atmospheric curve and with Pu, which is presented against 210Pb model. The overall similarity revealed between two independent models has confirmed the accuracy and robustness of both methods of dating. Reproduced in colour in online version.
The peaks of 239,240Pu in Sn0 and Sn1 profiles also correspond well with the main peaks of 137Cs (Figure 3).
The peak concentrations of 137Cs are slightly shifted in depth with respect to the peaks of plutonium. In profile Sn1, the maximum of the 137Cs activity is observed in the top layer, which could be attributed to the active uptake by living plants (e.g. Mróz et al., 2017; Rosén et al., 2009). However, the Chernobyl peak (1986) of 137Cs is partly preserved. Profil Sn0 is less affected by plant uptake of Cs, which corresponds with a less dense plant cover at the Sn1 sampling site. Also, the Chernobyl peak is more distinct. Measurable 137Cs activity was found in all layers of both profiles, pointing to the downward mobility of Cs. The mobility of 137Cs in ombrotrophic peat bogs (Olid et al., 2008; Zaccone et al., 2007) is due to the lack of suitable mineral particles for the adsorption of alkali metal cations like Cs.
Some vertical mobility of 137Cs in ombrotrophic peat deposits is demonstrated in Sn0 and Sn1 and is also observed in other sites (e.g. Fiałkiewicz-Kozieł et al., 2014; Kazakevičiūtė-Jakučiūnienė et al., 2022; MacKenzie et al., 1997; Mitchell and McDonald, 1992; Mróz et al., 2017; Rosén et al., 2009). 137Cs could be immobile (Li et al., 2017; van der Plicht et al., 2013; Łokas et al., 2013) or partially mobile downward and upward in the peat profile (Schell et al., 1989) due to biological activity in the root zone and changing water table (Aaby et al., 1979; Rosén et al., 2009). Nevertheless, it was possible to recognise the most characteristic events of radionuclide fallout, that is, Chernobyl accident.
The technogenic impact: Synchronous increases of chemical elements concentration and associated appearance of SCP and SAP, mullite, δ15N and δ13C
The increased global human population and their energy demands have induced a dramatic increase in the number of power plants, industrial facilities, car use and associated fossil fuel combustion (Waters et al., 2016, 2018). Fossil fuel-based power plants and industrial activities emit flue gases and fly-ashes (e.g. Jones et al., 2012; Vassilev et al., 2001). These are transported in the atmosphere before they are deposited on aquatic and terrestrial surfaces, including different natural archives.
Ombrotrophic peatlands are among the best archives of rare and trace elements deposition due to being fed only from the atmosphere and the effective immobilisation of selected elements, once deposited, which can be interpreted against an age-depth function (De Vleeschouwer et al., 2010a; Shotyk, 1988). In Śnieżka peatland, trace elements were determined in Sn1 and Sn2, but the simultaneous increase in ash content of Sn1 and Sn2, which correlates with peaks in element concentrations, also allows for the recognition of such a layer in ash content in Sn0. Hence, Sn0 ash content may be considered equivalent to chemical element deposition and, in particular, corresponds with the profile of mercury content and accumulation (Figure 8).
Trace elements
Pb and Zn are representative of industrial activity and so may be used in the discussion regarding markers for the Anthropocene series. Numerous studies have identified ombrotrophic bogs as among the best Pb archives due to their exclusive input via deposition from the atmosphere (e.g. Shotyk and Le Roux, 2005; Shotyk et al., 1998). Pb always accompanies Zn in peat because of their co-occurrence in ore deposits (De Vleeschouwer et al., 2009; Smieja-Król et al., 2010; Fiałkiewicz-Kozieł et al., 2018). Despite its mobility in peatlands (Weiss et al., 2007), Zn deposition shows similar patterns to Pb in the Śnieżka cores (Figure 4; Fiałkiewicz-Kozieł et al., 2020).
Comparison of industrially driven Pb deposition in archives from different countries and continents indicates regional or local differences due to the individual history of industrial development (Longman et al., 2020). However, despite significant intracontinental variability, the most pronounced increase, observed in the mid-20th century, has been statistically confirmed (Longman et al., 2020). This has important implications for determining a clear boundary for the Anthropocene series using trace elements. While peat sequences in different countries may show varying dates for the onset of trace metal contamination and for peak metal concentrations making them unsuitable as a global synchronous marker, the rise in trace metal inputs for Pb and Zn in the 1950s does appear to be globally synchronous for all studied peat deposits. This increase in almost all investigated trace elements and REE is visible in Śnieżka peatland (Fiałkiewicz-Kozieł et al., 2020) and here may be attributed to lignite combustion in ‘Black Triangle’ countries (Fiałkiewicz-Kozieł et al., 2015, 2020). The 1950s acceleration in Pb is observed in different environmental archives, for example, in Czechia (Novak et al., 2008), Scotland (Farmer et al., 1997), Greenland (Shotyk et al., 2003), but also China (Bao et al., 2015; Fiałkiewicz-Kozieł et al., 2022) and Kyrgyzstan (Grigholm et al., 2016). This ‘Great Acceleration’ in chemical element inputs due to increased industrial activity is given here as one of the significant markers of the proposed Anthropocene.
Technofossils
High-temperature coal combustion also produces technofossils like spheroidal carbonaceous particles (SCP) or fly ash spheroidal aluminosilicates (SAP), easily detected in peat profiles (Fiałkiewicz-Kozieł et al., 2020; Rose, 2015; Smieja-Król and Fiałkiewicz-Kozieł, 2014; Swindles et al., 2015 – for this study). SCPs and SAPs appeared for the first time in western Europe in the mid-19th century, but the marked global increase in abundance is observed around 1950 CE, with peak inputs to archives ranging regionally from the 1970s to the 1990s (Rose, 2015; Smieja-Król et al., 2019). The link with specific technology, developed in the late 19th century and boosted in the 1950s–1960s allows for the determination of distinct boundaries in the geological record, even at remote sites far from industrial centres (Fiałkiewicz-Kozieł et al., 2016, 2022).
In Śnieżka, the first appearance is observed in 1940 CE; however, a significant upturn is visible in the 1950s (Figures 7 and 8).
Stable isotopes
Stable carbon (δ13CTOC) and nitrogen (δ15N) isotope signatures can, with some limitations, also be used to show the anthropogenic contribution of carbon and nitrogen deposition on the Śnieżka peatland. Both δ13CTOC and δ15N displayed similar patterns (Pearson correlation coefficient r = 0.72, p << 0.001), indicating that the same environmental factors control them. Decreasing trends in δ13C and δ15N between the early 1940s CE and 1970s CE reflect a long-term depletion in atmospheric 13C and 15N. For CO2, the decrease could act as a manifestation of the so-called Suess effect, a worldwide reduction of atmospheric δ13CCO2 values by ~2‰ within the last 200 years due to the burning of fossil fuels (Keeling, 1979; Keeling et al., 1979). The δ13CTOC and δ15N trend could indicate that between the 1940s and 1970s CE, there occurred a decline in δ13C and δ15N values in atmospheric CO2 and NO3, respectively, in the Sudetes.
It should be emphasised that δ13COM and δ15N are known to be strongly influenced by microbial OM degradation, leaching and refixation in the peat acrotelm, which preferentially removes light C and N isotopes, thus leading to an increase of δ13COM and δ15N in the residual recalcitrant material (Esmeijer-Liu et al., 2012). On the other hand, it has been documented that in the early stages of a microbial attack, 13C enriched carbohydrates are removed and as a result, the δ13C of the remaining organic material is shifted towards lower values (Meyers, 1997). Such an effect is presumably responsible for stable C isotope signatures in the uppermost 8 cm-thick layers of the Sn cores (Figure 8).
Biotic markers of the Anthropocene series
Pollen analysis
The critical changes in elements and technofossils at the proposed Holocene/Anthropocene transition correspond with pronounced ecological changes mirrored by pollen and testate amoebae in the Sn1 profile (Figures 5–7). However, while chemical markers and technofossils often have worldwide distributions, the pollen-inferred delimitation of the Anthropocene relies on species that represent region-specific ecological trends (Deza-Araujo et al., 2022). Therefore, representative analogues should be selected from different parts of the globe when comparing these markers. Globalisation phenomena and climate change have altered the distribution of non-native species, which have become invasive in new environments (Storkey et al., 2014). In Europe, one of the best-known alien plants is Ambrosia artemisiifolia L. (common ragweed), which has expanded over Europe since 1940 CE due to its contamination within crop seeds and transboundary transport (Chauvel et al., 2006; Storkey et al., 2014). From the Sn1 core, it emerges that in central Europe, Ambrosia artemisiifolia appeared in 1956 ± 3 CE (Figure 5).
An interesting feature of the Sn0 profile was a gradual increase in Urtica pollen abundance, which might be an effect of enrichment with nitrogen. A decline in nitrogen input occurred due to the cessation of pastoral activity connected with the establishment of Karkonosze National Park in 1959. However, in the following period, intensified tourism and enhanced atmospheric fallout caused by industrial development in the Black Triangle (Kmiec et al., 1995; Myśkow et al., 2019) partially compensated for this N loss. Urtica dioica and Urtica urens are characteristic representatives of nitrophilic weeds (Rosnitschek-Schimmel, 1983) and Urtica sp. records show an increasing trend from 1950, representative of many European mountain records (Segnana et al., 2020), and a clear connection between its presence and the anthropogenic phase (Figure 9).
In the Snieżka record, it is also clear that in ca. 1960 CE, there was a considerable change in the microbial food web reflected by the disappearance of mixotrophic testate amoebae (Figure 6). This change is found to reflect the broader tendency observed in some parts of the Northern Hemisphere: Siberia (Lamentowicz et al., 2015) and Canada (van Bellen et al., 2018) as well as in the Southern Hemisphere (e.g. van Bellen et al., 2016). In all these locations, the collapse in mixtrotrophic species was associated with the lowering of the water table and shading by shrubs (Creevy et al., 2018; Heal, 1964; Lamentowicz and Mitchell, 2005; Lamentowicz et al., 2020; Marcisz et al., 2014; Payne et al., 2016; Schönborn, 1965). Even though global warming was among the most important drivers of the peatland drying trend during the past 70 years (Gallego-Sala et al., 2018; Swindles et al., 2019), there are alternative reasons for the disappearance of mixotrophs in the Śnieżka bog. It appears that the local testate amoebae communities were exposed to fly ash deposition originating from intense industrial activity around the so-called Black Triangle (Figure 1), and it has been hypothesised that this dust harmed mixotrophic metabolism and eliminated communities living at the capitula of Sphagnum (Fiałkiewicz-Kozieł et al., 2015; Marcisz et al., 2020). Synergistic effects of air pollution and anthropogenic global warming might cause the worldwide extinction of the populations of mixotrophs in Sphagnum peatlands in the future (Loisel et al., 2021). By contrast, the Śnieżka peatland has also been identified as the location of new ecotypes of testate amoebae which are resistant to pollution and which use fly-ash particles to build their shells (Figure 11). The first evidence for this phenomenon was described in the Izery mountains (Fiałkiewicz-Kozieł et al., 2015).
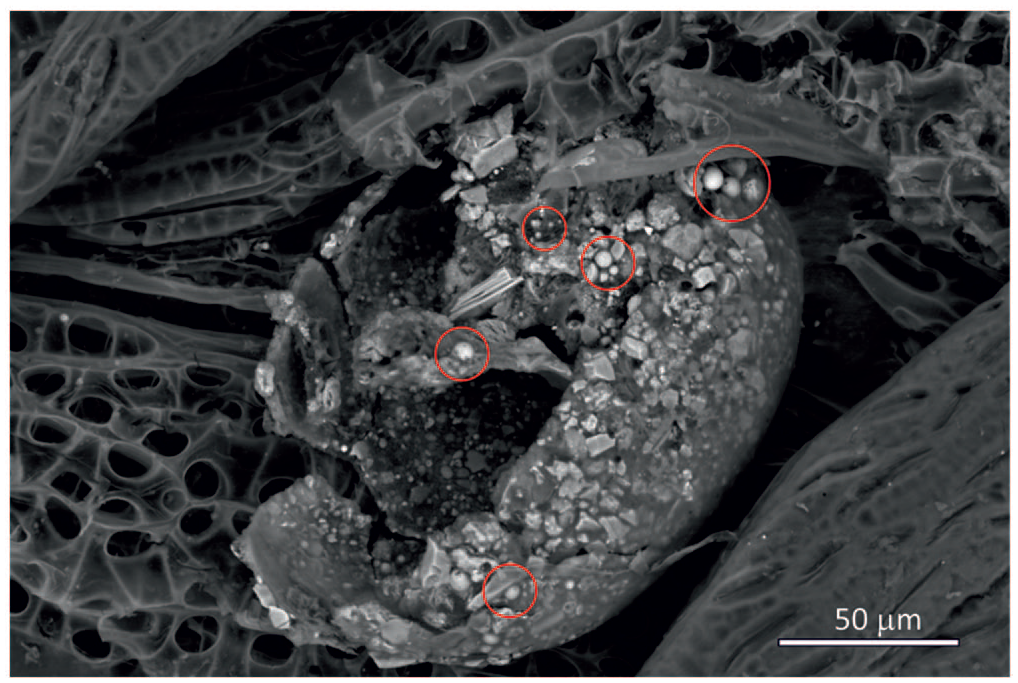
Fossil shell of a testate amoeba with SAP built into the shell (indicated by red circles) (Sn0, depth 25–26 cm). Reproduced in colour in online version.
Śnieżka peatland as potential GSSP
Due to the widespread environmental effects of industrial activity in the Black Triangle and the high-resolution record preserved in the peatland, the Śnieżka site seems significant for documenting the Anthropocene. The unique feature of the site lies in its location in the subalpine zone and at the trajectory of air masses carrying pollutants over long distances across Europe. The Anthropocene series in the Sn cores is clearly distinguished by the distributions of Pu isotopes, technofossils (SCP, SAP and mullite) as well as trace metals, all of which are synchronous with other Anthropocene records worldwide.
As a candidate for a GSSP representative Anthropocene core, the Sn0 has the following advantages:
- It displays a robust age model obtained using 210Pb and verified by independent markers (137Cs, F14C)
- It is characterised by a relatively high peat accumulation rate (0.66 cm/year on average) which provides a high-resolution geological record (around 2 years per 1 cm) and thus allows for the identification of a distinct boundary between the Holocene and Anthropocene series
- The Sn0 peat profile provides a continuous geological record for the last c.a. 100 years (i.e. no hiatuses, gaps and other disturbances were identified)
- The Sn0 Anthropocene archive encompasses a wide array of critical markers such as plutonium radionuclides, fly ash particles, Hg and stable C and N isotopes which are consistent with the previously studied well-documented Sn1 profile
- The Śnieżka site is located in a protected area of the National Park and is easily accessible for further studies. Access to the peatland is facilitated thanks to proximity to touristic tracks, although permission for collecting peat material, given by the Ministry of Climate and Environments and the National Park Administration, is mandatory.
The main disadvantages of the proposed stratotype include the lack of annual lamination and the lack of a lithological marker at the proposed level.
Conclusions
The Śnieżka peat profile provides a significant thickness of deposited organic matter and presents a comprehensive dataset of markers which can be used to distinguish a 1950s boundary between the Holocene and Anthropocene series. Despite an absence of annual layering the proposed GSSP core has a well-constrained chronology and key markers (Pu, Cs, technofossils) can be correlated to adjacent cores. Importantly, further analysis is required to repeat some crucial measurements undertaken in 2020–2022 as part of future examinations of the candidate GSSP core. The proposed name for the stage/age-level is Sudetian.
Supplemental Material
sj-docx-1-anr-10.1177_20530196221136425 – Supplemental material for The Śnieżka peatland as a candidate for the Global Boundary Stratotype Section and Point for the Anthropocene series
Supplemental material, sj-docx-1-anr-10.1177_20530196221136425 for The Śnieżka peatland as a candidate for the Global Boundary Stratotype Section and Point for the Anthropocene series by Barbara Fiałkiewicz-Kozieł, Edyta Łokas, Beata Smieja-Król, Simon Turner, Francois De Vleeschouwer, Michał Woszczyk, Katarzyna Marcisz, Mariusz Gałka, Mariusz Lamentowicz, Piotr Kołaczek, Irka Hajdas, Monika Karpińska-Kołaczek, Katarzyna Kołtonik, Tomasz Mróz, Sarah Roberts, Neil Rose, Tomasz Krzykawski, Arnoud Boom and Handong Yang in The Anthropocene Review
Supplemental Material
sj-docx-2-anr-10.1177_20530196221136425 – Supplemental material for The Śnieżka peatland as a candidate for the Global Boundary Stratotype Section and Point for the Anthropocene series
Supplemental material, sj-docx-2-anr-10.1177_20530196221136425 for The Śnieżka peatland as a candidate for the Global Boundary Stratotype Section and Point for the Anthropocene series by Barbara Fiałkiewicz-Kozieł, Edyta Łokas, Beata Smieja-Król, Simon Turner, Francois De Vleeschouwer, Michał Woszczyk, Katarzyna Marcisz, Mariusz Gałka, Mariusz Lamentowicz, Piotr Kołaczek, Irka Hajdas, Monika Karpińska-Kołaczek, Katarzyna Kołtonik, Tomasz Mróz, Sarah Roberts, Neil Rose, Tomasz Krzykawski, Arnoud Boom and Handong Yang in The Anthropocene Review
Supplemental Material
sj-docx-3-anr-10.1177_20530196221136425 – Supplemental material for The Śnieżka peatland as a candidate for the Global Boundary Stratotype Section and Point for the Anthropocene series
Supplemental material, sj-docx-3-anr-10.1177_20530196221136425 for The Śnieżka peatland as a candidate for the Global Boundary Stratotype Section and Point for the Anthropocene series by Barbara Fiałkiewicz-Kozieł, Edyta Łokas, Beata Smieja-Król, Simon Turner, Francois De Vleeschouwer, Michał Woszczyk, Katarzyna Marcisz, Mariusz Gałka, Mariusz Lamentowicz, Piotr Kołaczek, Irka Hajdas, Monika Karpińska-Kołaczek, Katarzyna Kołtonik, Tomasz Mróz, Sarah Roberts, Neil Rose, Tomasz Krzykawski, Arnoud Boom and Handong Yang in The Anthropocene Review
Supplemental Material
sj-docx-4-anr-10.1177_20530196221136425 – Supplemental material for The Śnieżka peatland as a candidate for the Global Boundary Stratotype Section and Point for the Anthropocene series
Supplemental material, sj-docx-4-anr-10.1177_20530196221136425 for The Śnieżka peatland as a candidate for the Global Boundary Stratotype Section and Point for the Anthropocene series by Barbara Fiałkiewicz-Kozieł, Edyta Łokas, Beata Smieja-Król, Simon Turner, Francois De Vleeschouwer, Michał Woszczyk, Katarzyna Marcisz, Mariusz Gałka, Mariusz Lamentowicz, Piotr Kołaczek, Irka Hajdas, Monika Karpińska-Kołaczek, Katarzyna Kołtonik, Tomasz Mróz, Sarah Roberts, Neil Rose, Tomasz Krzykawski, Arnoud Boom and Handong Yang in The Anthropocene Review
Footnotes
Acknowledgements
Marcin Siepak and Jolanta Dopieralska are thanked for measurements published in previous study (Fiałkiewicz-Kozieł et al., 2020). We would like to acknowledge the Haus der Kulturen der Welt (HKW, Berlin) for collaborating with the Anthropocene Working Group in the assessment of the candidate GSSP-sites. The collaboration was established in the framework of HKW’s long-term initiative Anthropocene Curriculum, an international project for experimental forms of Anthropocene research and education developed by HKW and the Max Planck Institute for the History of Science (MPIWG, Berlin) since 2013. Gael Le Roux is thanked for the discussion about Pu mobility. Colin Waters is warmly thanked for all constructive comments.
Declaration of conflicting interests
The author(s) declared no potential conflicts of interest with respect to the research, authorship, and/or publication of this article.
Funding
The author(s) disclosed receipt of the following financial support for the research, authorship, and/or publication of this article: This research was funded by the Polish National Centre of Science (NCN) 2011/01/D/ST10/02579 granted to BFK as well as by IGIG, Adam Mickiewicz University funds for scientific activity. We would like to acknowledge the Haus der Kulturen der Welt (HKW, Berlin) for collaborating with the Anthropocene Working Group in the assessment of the candidate GSSP-sites. The collaboration was established in the framework of HKW’s long-term initiative Anthropocene Curriculum, an international project for experimental forms of Anthropocene research and education developed by HKW and the Max Planck Institute for the History of Science (MPIWG, Berlin) since 2013.
Supplemental material
Supplemental material for this article is available online.
References
Supplementary Material
Please find the following supplemental material available below.
For Open Access articles published under a Creative Commons License, all supplemental material carries the same license as the article it is associated with.
For non-Open Access articles published, all supplemental material carries a non-exclusive license, and permission requests for re-use of supplemental material or any part of supplemental material shall be sent directly to the copyright owner as specified in the copyright notice associated with the article.