
Abstract
The biophysical magnitude of global human economic activity is arguably the defining feature and challenge of the Anthropocene, leading to multiple environmental consequences. Quantifying this magnitude at sufficient resolution remains a challenge. We define and present the first detailed district-level analysis of Net National Metabolism (NNM) – a social metabolism energy metric – for an industrialised country (the United Kingdom), using data on household energy alongside household expenditure survey data and energy intensity figures for product categories. The total UK NNM is estimated as 7.56 EJ year−1 (3650 W per capita), 44% of which stems from energy embodied in products and services consumed by households. This is comparable with the metabolism of the UK biosphere (approximately 6.95 EJ year−1). Of the final energy embodied in consumption of goods and services, 46% is dependent on domestic policy decisions and 54% is dependent on policy decisions with/in key trading partners. We demonstrate the applicability of this metric by exploring the relationship between NNM and social deprivation in the UK.
Keywords
Introduction
Biophysical metrics and footprinting
Global human economic activity is arguably the defining feature and challenge of the Anthropocene, leading to most other environmental challenges (Krausmann et al., 2017, 2018; Malhi, 2017; Schaffartzik et al., 2014). These include resource over-extraction, natural habitat and biodiversity decline, climate-destabilising levels of greenhouse gas emissions and waste production in excess of planetary absorption capacity (see, e.g. IPCC, 2018; Krausmann et al., 2018; Steffen et al., 2015b). Leading traditional economic metrics, such as the Gross Domestic Product (GDP), focus exclusively on monetary values and fail to explicitly link human activity to objective, physical measures; ecological economists and others have argued that traditional textbook economic models must be expanded to recognise how economy and society are embedded within, and dependent on, the biosphere (Daly and Farley, 2011; Raworth, 2017a; Georgescu-Roegen, 1971). Such an expanded model can provide a view of the economy as a biophysical entity, the ‘metabolism’ of human society. In this era, it remains a central problem for governance and management how to best quantify and represent the biophysical growth of global economic activity and its various component dimensions, and compare it to natural biological regional and planetary processes (Haberl et al., 2019).
Like human metabolism, the biophysical activities of society can be thought of as a metabolism in either material (mass) or energy terms. Studies conceptualising and quantifying this concept have proliferated in the last two decades under various names and in various versions (see examples below). Sociometabolic research (SMR) or socioeconomic metabolism (SEM) has been claimed as a new research paradigm (Pauliuk and Hertwich, 2015) and a useful tool for sustainability science (Haberl et al., 2019). In this relatively young field, a range of analysis types are conducted and a range of methodologies are employed, including for example: (Environmentally Extended) Multi-Regional Input-Output Analysis (EE-MRIO, where multiple models exist) (Owen, 2017); Hybrid LCA-IO (where multiple types exist) and material and energy flow analysis (Eisenmenger et al., 2016; Haberl et al., 2019); related concepts also include the Ecological Footprint (Lin et al., 2018). Regardless of the specific methodological approach, social metabolism metrics provide a key perspective on the impact and potential for impact of human society on the environment (Malhi, 2014). By quantifying human activity in physical terms, these research approaches place our species and society within the natural world, and attempts to bridge the gap – expressed by some researchers – between the natural sciences and economics. We use the term ‘social metabolism’ to refer to these research traditions generally, and specifically including our footprinting approach, outlined in greater detail throughout the paper.
Among the social metabolism metrics, ‘footprinting’ is particularly popular and takes a consumption-based view on resource use (Wiedmann and Lenzen, 2018). This approach allows for a view on the quantity of ‘embodied’ items in consumption, be they carbon (Hertwich and Peters, 2009), materials (Wiedmann et al., 2015), water (Hoekstra and Mekonnen, 2012; Vanham et al., 2018), labour (Silva Simas et al., 2015) or even inequality (Alsamawi et al., 2014). Authors have also argued for the need to use several metrics together and created a composite footprint (Galli et al., 2012). The specific footprint impact metric varies among the above, often corresponding to the variable under study (e.g. the mass of materials for material footprint). Alternative approaches also exist: the Ecological Footprint converts resource usage to the corresponding land area (and type) theoretically needed, and compares it to the land area of each type available within the same country and globally (Lin et al., 2018). Footprinting is useful for sustainability studies because to meet domestic demand, countries are increasingly drawing on non-domestic sources (Wiedmann and Lenzen, 2018; Wiedmann et al., 2015). Thus, to get the full picture of the planetary impact stemming from the economic activity for residents in a country, a consumption-based perspective is needed. In practice, Environmentally Extended Input-Output Analysis is often the methodological basis for footprinting analyses, and footprinting can thus be viewed as one part of the EE-IO tradition (Haberl et al., 2019).
In addition to the focus on actionable and contemporary sustainability applications that motivates the bulk of SMR (Haberl et al., 2019), there is a second rationale for studying social metabolism. In this second strand of thought, social metabolism metrics and their magnitudes are used to compare the size of the biophysical activity of various human civilisations over time and with natural processes. Social metabolism can cover a wide range of societal energy flows – even the human physiological metabolism of our species can be included – and its framing contextualises our energy consumption within the broader physical and biological (not only industrial) world. The use of energy units allows for a direct comparison with key biosphere processes (Malhi, 2014) and supports a framework that views human sociometabolic activity as embedded within a supporting planetary metabolism (Haberl, 2001). The strength of the energetic social metabolism metric for this application lies in the usage of the ‘common currency’ of energy across all societal activities as well as across the techno- and biospheres, facilitating the aforementioned comparisons.
Estimates of social metabolism have been conducted at fine-scaled regional level for material metabolism (Courtonne et al., 2015; Vanham et al., 2018); nationally for energy by income level and urbanisation type (Wiedenhofer et al., 2013) and for energy by countries (see e.g. Dorninger et al., 2021). To the authors’ knowledge, no study has to date quantified the consumption-based energy at the fine-scaled regional level for an entire country.
Our approach and introducing Net National Metabolism
In this study we demonstrate the potential of a data-rich and communications-focused socio-metabolic approach applied to an example industrialised country. Our approach centres on broad applicability and accessibility. We introduce the conceptual framing of Net National Metabolism (NNM) to make explicit the measure’s potential as a summary metric of human societal activity, in parallel to the well-known GDP and other monetary metrics (see the Discussion and Table 1 for additional details).
Table shows variations on the domestic metabolism metric, and the corresponding variations of the econometric term domestic product (McCulla and Smith, 2015); cells relevant for Net National Metabolism have been highlighted in cursive.
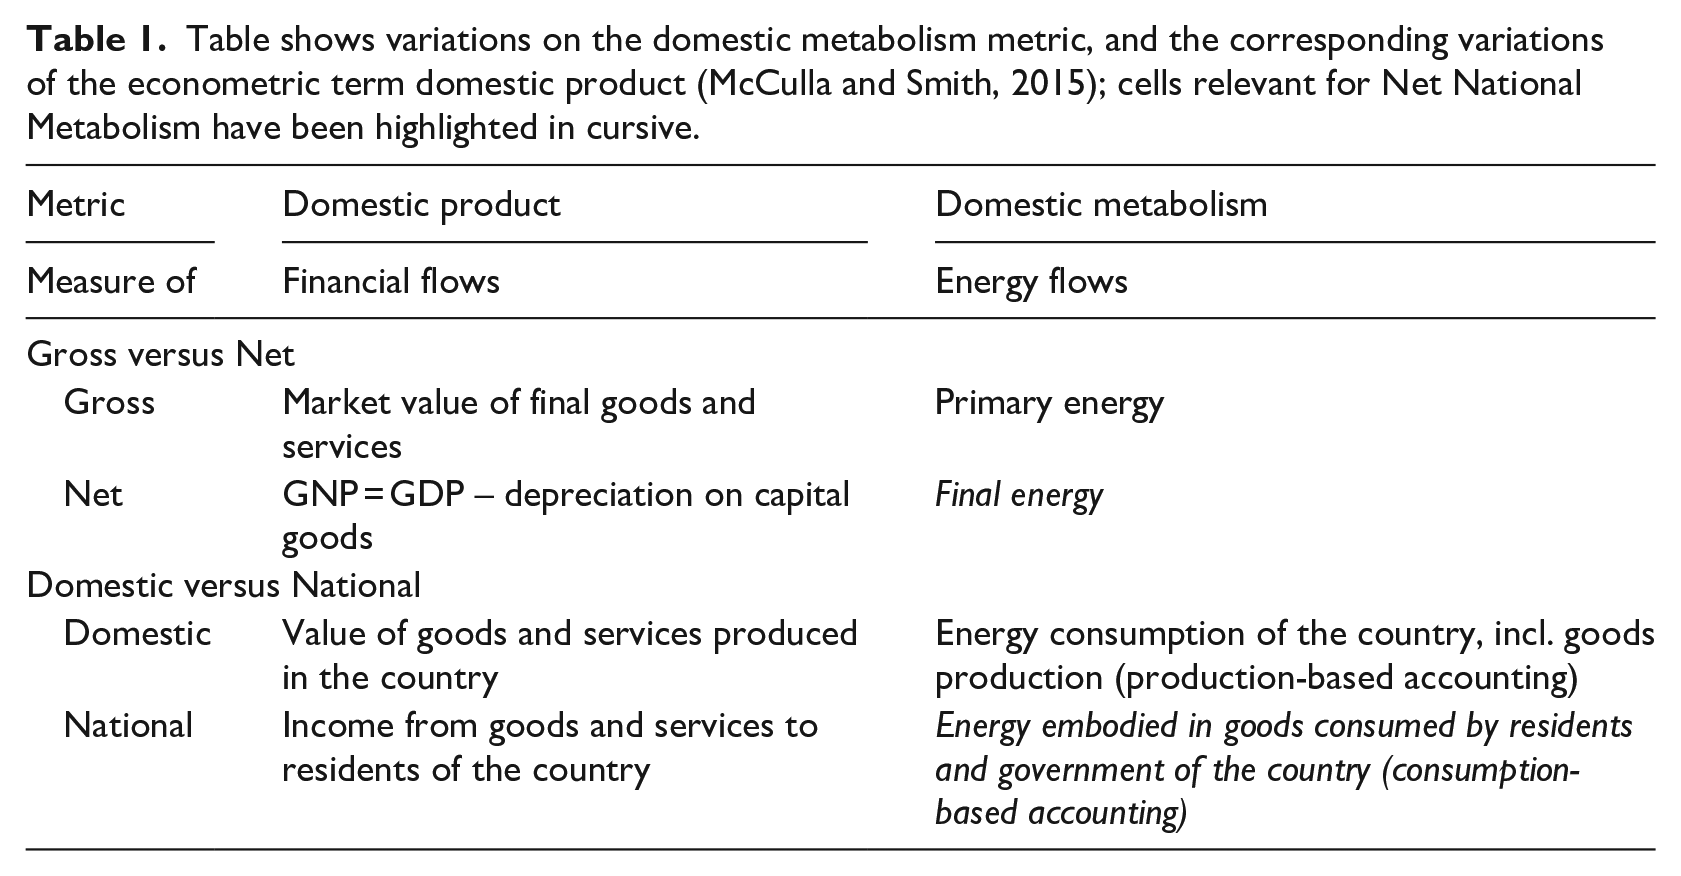
NNM summarises the overall (final) energy flow utilised by a nation’s residents in one year, to power everything from their own bodies to the factories abroad which manufacture the goods they use (see Table 1, Figure 1 and Methods section). It incorporates elements from several SMR traditions and methodologies, primarily EE-MRIO and some elements from urban metabolism. It is intentionally designed to match these relevant contemporary sustainability assessment metrics while also being suitable for comparisons with historical societies and the biosphere (Malhi, 2014). It is thus a collection and refinement of key existing traditions, and the establishment of the ‘Net National Metabolism’ term offers an opportunity to communicate social metabolism concepts in terms similar to those that the public is already familiar with from Economics (Table 1). Its versatility allows for a simple-to-communicate way to express growth in the biophysical magnitude of consumption, and also put this in the context of natural processes as well as historical and pre-historical human societies.
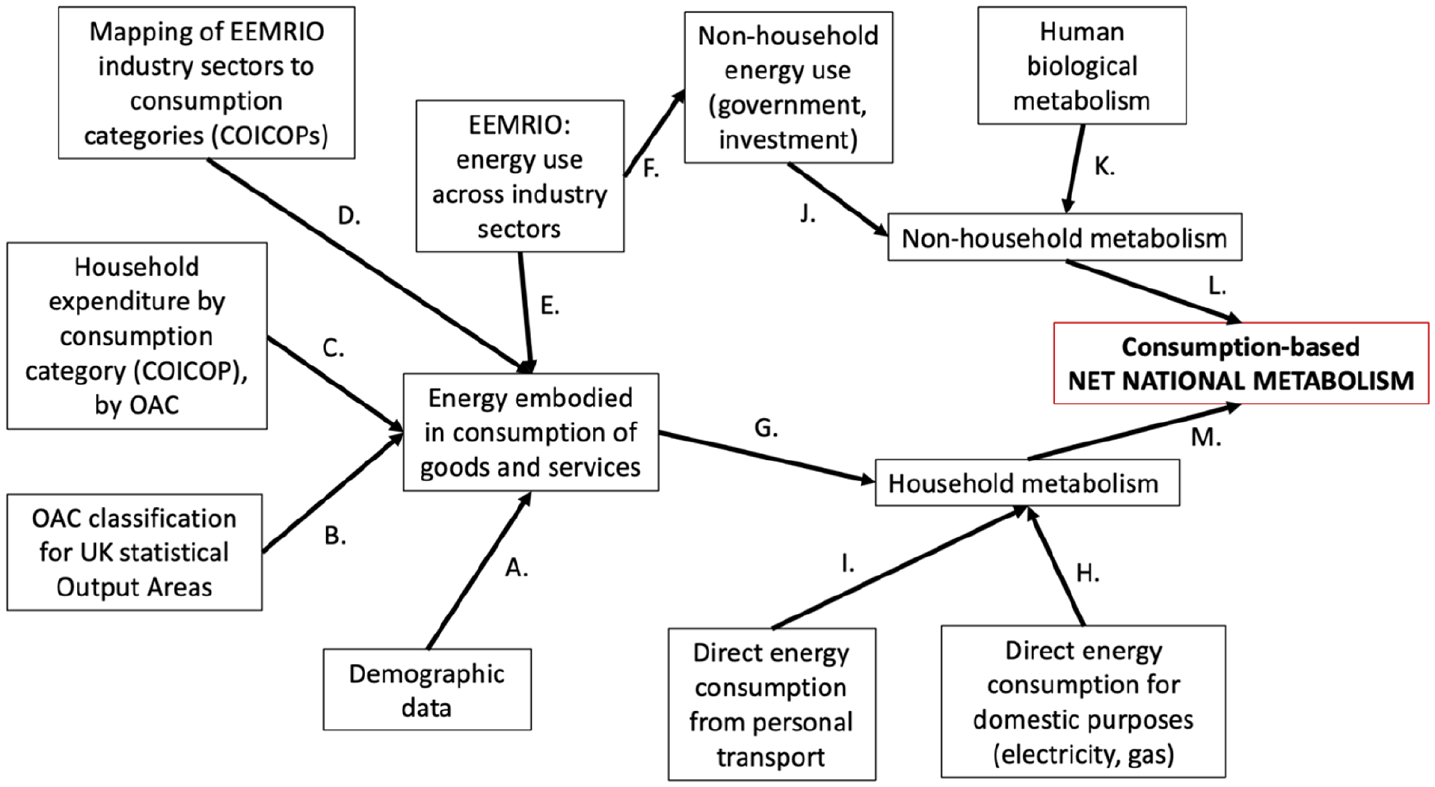
Flowchart shows how datasets were combined to calculate the Net National Metabolism of the UK. See Methods section for details on each data set.
Specifically, for our UK example we take a consumption-based accounting (CBA) approach of final energy and quantify the total magnitude of 2016 UK energy flows associated with the following: direct energy for transportation and home heating; other direct energy usage in homes including electricity; embodied energy from consumption of goods and services and human physiological metabolism (which is the final energy version of energy embodied in food (Haberl, 2001)). The intention is to comprehensively cover the energy flows supporting modern human life in an industrialised nation today. To avoid double-counting, accounting is made at the household level.
We quantify NNM by first calculating the total energy footprints associated with spending on goods and services by UK households and government, and capital investments, then disaggregating this value across subnational geographies according to the proportion of the UK totals that consumers in each region buy of each product. We also include additional data sets on for example direct energy consumption as described in Methods. This consumption-based final energy accounting enables analysis of drivers and partitioning of energy use, but does not include inefficiencies in power provision. Energy footprint data calculated using a multiregional input-output database can also reveal the source industries and countries involved in each product’s production. The data granularity achieved provides, among other things, new insights on the metabolic advantages of urban living, the UK’s teleconnections to the international economy through global supply chains and the avenues through which a society uses energy. Specifically, we employ this analysis to ask the following questions: (1) What is the total and per capita NNM of the UK? (2) How is UK NNM distributed, across categories (direct energy consumption, infrastructure, embodied energy in goods and services consumption, etc.) and regions; (3) how much does dense urban living affect per capita NNM and why? (4) How much of UK metabolism is ‘internationalised’ through trade teleconnections, with which world regions, and how much of this metabolism is fossil-based? (5) Can we identify districts with more or less ‘efficient’ metabolic profiles under different definitions of the term?
Under the final question, we explore the relationship between metabolism and social deprivation, comment on the implications and provide ideas for further research.
Crucially, NNM weaves together three strands of characteristics: consumption-based footprinting for sustainability applications; the ability to compare the biophysical size of present society, in energy terms, to natural and historical magnitudes and a data foundation centred on econometric data sets to facilitate reproducibility and scalability of the analysis. Combining these strands, we produce findings at an hitherto unmatched fine-grained spatial scale and make a first exploration into one of its most important potential applications: identifying examples and pathways towards reconciling people and planet (Raworth, 2017b).
This study chooses to focus on energy as it facilitates comparisons across societal, organismal and environmental ‘metabolisms’, framing the ‘size’ of human activity in energy terms and offers a footprint metric alternative with a clear, simple and widely translatable metric (Krausmann et al., 2008). We take a consumption-based approach, as opposed to a production-based approach, as consumption represents the ‘why’ of energy usage: goods and services are produced for the benefit of the consumer, wherever in the world that consumer might be located. In modern society, where much of our energy-demanding activities are fundamentally ‘outsourced’ (Wiedmann and Lenzen, 2018), we also argue that this is the better metric for representing total social metabolism. Finally, a consumption-based approach facilitates the use of household expenditure data. We choose to focus on final energy because it lies conceptually closer to energy services used by citizens; given the data sets available it is also a requirement for achieving the spatial granularity sought. To allow for future comparisons with historical and pre-historical human societies (see Introduction and Fischer-Kowalski and Haberl, 2015; Haberl, 2001; Malhi, 2014), we choose to include human nutrition/metabolism in our definition (see the dedicated section below for details). We use econometric data as that data is collected and quality assured by government actors, it is made widely available in comparable formats across countries, and much of it is available for free. We take as our starting point the consumption of goods and services by households covered by the EE-MRIO model. This however excludes direct energy usage in homes (electricity and heating) and in personal transport (car fuel), which means these data sets must be added.
In our study, we present a method for achieving increased spatial granularity in a field that suffers perennially from data limitations (Haberl et al., 2019). Specifically, we conduct a spatially disaggregated analysis for all 391 local authority districts in the United Kingdom. This is done by combining several (mostly) publicly available data sets including established econometric data published by the government, and (crucially) by scaling the national footprint data by consumption category, using variations in spending proportions between household types, sourced from household consumption surveys. To reassign energy from industrial use to the goods and services bought by households and government at the point of final consumption of goods and services, environmentally-extended input-output analysis is used (Kitzes, 2013; Leontief, 1936; Miller and Blair, 2009). We further disaggregate this metabolism into constituent components to examine its global sources and relationship to socioeconomic conditions. The UK was chosen as a case study of an industrialised country due to its high degree of data availability and proportionally large current and historical environmental impact (measured e.g. as global proportion of greenhouse gas emissions) while being similar in size and economic and cultural character to several of the major nations influencing global geopolitics and environment. The analysis shows striking geographical contrasts, ranging from a dominant large city (London), through to remote rural regions (e.g. Scottish Highlands). This study is the first in our knowledge to calculate the metabolic (energy) footprint at this fine spatial scale for any industrialised country.
Materials and methods
Overview of methods
The liberalisation of trade has distanced the relationship between the point of energy use and the final product consumed by households, as supply chains become globally complex. Multiregional input-output (MRIO) analysis is the state-of-the-art accounting method used to understand the role of trade, industries, products and final consumers, but these global databases were only constructed in the past 5–10 years (see Lenzen et al., 2013; Timmer et al., 2015; Tukker et al., 2013). They are mainly used for inter-country comparison purposes (see the many ‘footprint of nations studies’ e.g. Hertwich and Peters, 2009; Wiedmann et al., 2015) and the few MRIO studies that consider subnational footprints of municipal areas have mainly focussed on the carbon footprint (Minx et al., 2013; Wiedmann et al., 2016). There has been significant effort to develop neighbourhood estimates of energy use but these studies either use single region input-output tables, which are unable to fully account for the energy embodied in imported goods (see Lenzen et al., 2004; Vringer and Blok, 1995), or look at some other breakdown of a country’s household energy footprint such as income deciles (Min and Rao, 2018).
We use open-access expenditure survey data and geodemographic classifications, together with energy intensities from a Multiregional Input-Output model (Owen et al., 2017), to produce estimates of energy embodied in consumption of goods and services by households and government (steps A–F in Figure 1). To complete the data set, we add data on direct energy consumption for personal transport and domestic purposes, along with simple estimates of human metabolism (steps G–K in Figure 1). We take a consumption-based final energy accounting approach as the end consumer perspective also allows for an examination of how consumers in the United Kingdom drive energy usage elsewhere and avoids double-counting at the point of production. The methodology presented was designed with accessibility and potential for future reproducibility in mind, and the key achievement is increased spatial resolution. Reasons for choosing the UK are laid out in the Introduction.
Multi-regional input-output model: Calculating energy embodied in consumption by all households, government activities and investments
When energy use is allocated to the end consumer, much of the social metabolism in an industrialised world of global trade consists of the energy embodied in the consumption of goods and services. This component is much more difficult to estimate than direct energy usage, since the latter is accurately captured in ‘point-of-combustion’ data: the end consumer uses the energy directly to heat a home or drive a car. The state-of-the-art methodology for calculating a consumption-based-account (CBA) requires a multiregional input-output database. These databases comprise of a series of large annual economic trade flow matrices detailing the production recipes of final goods and services produced and consumed anywhere in the world. Using linear algebra techniques pioneered by Leontief (1953), it is possible to reallocate data on the energy used by industries to the point of final consumption (products consumed by UK households and government and capital investment).
There are a number of different MRIO databases available. This study chose to adapt the University of Leeds’ UKMRIO database (for more information on the construction see Owen et al., 2017). This UK-focused MRIO database ensures the model is optimised to ensure that UK import/export totals are preserved, rather than produce a solution that is a ‘best fit’ for all regions. The result is an energy footprint disaggregated by end-product and the region the source energy was used in for household, government and capital investment expenditure. Note that since the publication of (Owen et al., 2017) the UKMRIO database has been updated to use EXIOBASE (Wood et al., 2014) for the trade data and a regional grouping of 10 regions.
As MRIO databases contain a ‘source’ as well as ‘destination’ country (in this case the UK) for all flows, the model also shows in which countries the embodied energy consumption occurs; the distribution across source countries in the model underlie our analysis for which regions embodied metabolism derives from (see e.g. Figure 2).
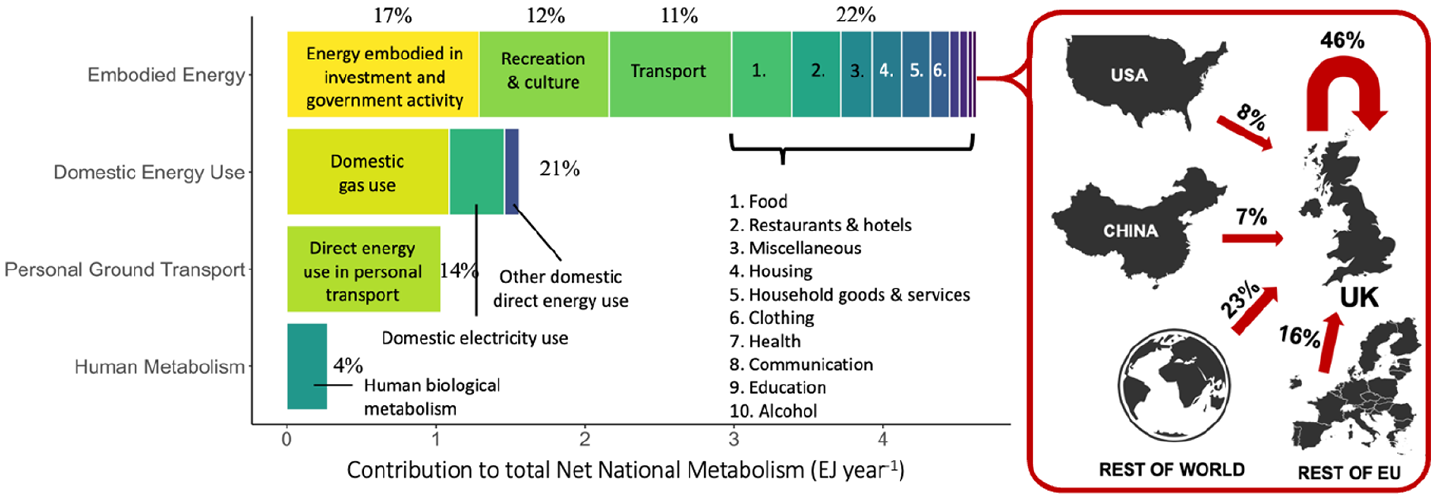
Stacked bar chart (a) shows the fraction of 2016 UK national social metabolism comprised of each component of metabolism. Country sketch (b) shows the proportion of embodied metabolism derived from each of the following regions: the UK, the rest of the EU, China, the United States and the rest of the world.
Overview of calculations comprising net national metabolism
The social metabolism of the UK’s local authority districts was calculated by incorporating four data sets: the direct domestic energy usage, direct energy usage associated with personal transport, the energy embodied in government activities and investments and the energy embodied in household consumption of goods and services, along with a simple estimate for human physiological metabolism.
Publicly available datasets were combined with the outputs from an environmentally extended multiregional input-output model to produce an estimate of the UK Net National Metabolism at the local authority district-level. A diagram of the datasets utilised, and their interrelations, is given in Figure 1.
Most included data sets are publicly available and provided by UK government agencies, with human physiological metabolism energy intensity estimates being the major exceptions (the latter comes from the UKMRIO database).
Data processing, analysis and figure creation was performed in R v. 3.5.1 (RStudio v. 1.1.453) (R Core Team, 2018), using the tidyverse, magrittr, gridExtra, lubridate, reshape2, scales, viridis, maps and ggrepel packages (Auguie, 2017; Bache and Wickham, 2014; Becker et al., 2018; Garnier, 2018; Grolemund and Wickham, 2011; Slowikowski, 2019; Wickham, 2007, 2017a, 2017b)
The letters in the below sub-titles refer to the identified steps in Figure 1.
A.–E. Estimate the energy embodied in UK household consumption of goods and services by downscaling national EE-MRIO data
The UKMRIO database provides figures data on embodied energy in goods and services consumption at the national level; to show the share per region of this NNM component we downscale the national amounts to Local Authority District (LAD) level. In order to disaggregate the UK total household energy footprint by LAD we need to know how households in each district consume, that is, spend. This data is not collected specifically but the pairing of geodemographic classifications with detailed household expenditure averages across product categories allows for the creation of a proxy for detailed district-level consumption of goods and services. Household expenditure survey data is collected weekly and by COICOP category. This data needs to be converted to annual expenditure, and be aligned to the product categories used in the UKMRIO database in order to derive energy intensity multipliers by COICOP product (see Steen-Olsen et al., 2016 for further discussion on alignment). We used the UKMRIO database and link to COICOP as of Feburary 2019. Related approaches have been used for carbon accounting in the past (West et al., 2016), but not for energy accounting specifically, and not for the purpose of this kind of general quantification.
The core of the downscaling process is as follows (letters in brackets refer to data sources in Figure 1). Each Output Area (OA; see below) has a geodemographic classification (A, B). Each geodemographic classification type has an associated average household spending pattern (from surveys) (C). Thus, each OA can be assigned an approximate average spending pattern according to its type. The inherent assumption is that household consumption of goods and services on average aligns closely with the geodemographic assignment of the OA; this ignores any regional variations beyond what the geodemographic classifications indicate. The outcome of this part of the downscaling is a goods and services spending profile of a small region, an OA.
The household expenditure data is converted to energy by applying the energy intensity for product categories from the input-output analysis (D, E; see above). Average weekly household spends for each category were multiplied by the energy intensity (J/£) for that product category, by the number of households in the OA (A), and by 52 (the number of weeks in a year), to yield the magnitude of energy embodied in consumption of goods and services for each OA, annually. OAs were then summed to LAD level. In the interest of avoiding data gaps, only geodemographic groups (e.g. 1A) and base-level COICOPs (1–12) were examined, not subgroups or subcategories. Spend across ‘other’ expenditure categories (COICOPs 13 and 14) were deemed not relevant for this study – as these expenditures carry none or minimal energy costs, consisting of items like mortgage payments – and were excluded. Refer to West et al. (2016) for further methodological considerations. This portion of the downscaling process converts the household spending profile into energy consumption figures and sums the values for small OAs to the larger LAD regions.
The demographic data (population and household numbers by Output Area (OA) for 2016) was provided by the Office of National Statistics (ONS). Note that in Northern Ireland, Small Areas (SAs) were used in lieu of OAs. Scottish population numbers for 2016 were not available at granular spatial resolution so the percentage Data Zone (DZ) population increase was applied to the subdivisions contained within each DZ; DZs are groupings of approximately seven OAs. To estimate 2016 household numbers for all countries, the percent population increase in each OA from 2011 to 2016 was applied to household numbers (household numbers were available for 2011 from the most recent census). Areas and population densities were sourced from ONS.
OAs nest into local authority districts (LADs), that are the unit of analysis for this study. Throughout, values are summed across the OAs contained within a LAD to find the number for the LAD as a whole, including for results for population numbers, household numbers and total household expenditure.
Geodemographic classifications (OACs) (Gale et al., 2016) for each OA were provided by ONS. The Cost of Living Survey data provided a detailed breakdown of the average weekly household spend for each of these geodemographic groups across product categories classified by the Classification of Individual Consumption According to Purpose (COICOP) system.
F. Estimate the energy embodied in government and investment activity per region by distributing national amounts on an equal per-capita basis
The UKMRIO database provides national energy amounts for embodied energy consumption associated with government and investment activity (F), similar to the data for household goods and services consumption. In our calculations, we distribute the former energy on an equal per-capita basis using the demographic data for OAs/LADs as above (A). The reason is that government activity is in a sense a shared responsibility and for the common benefit of the inhabitants of a country, and it is difficult to rigorously downscale the investment activity.
G.–I. Complete household energy consumption estimates by adding in direct energy usage
Data on direct energy consumption is available at district level from BEIS (H); data on final (direct) energy consumption across sectors was imported, but only domestic sector data was incorporated into the analysis because industrial energy is assumed to be captured under energy embodied in consumption of goods and services by households, and transportation energy was sourced from a separate dataset (I: also from BEIS). For transportation energy, only data on ‘Personal’ transportation was included, and ‘Freight’ excluded, since the latter is assumed to be captured under energy embodied in household consumption of goods and services. Data sets used were Total final energy consumption at regional and local authority level and Sub-national road transport consumption data | Local Authority Data (Department for Business, Energy & Industrial Strategy [DBEIS], 2018a, 2018b). Paired with the already-calculated embodied energy usage from consumption of goods and services (G), this gives a complete view of households’ contribution to NNM through their economic activities.
J.–K. Add in human physiological metabolism to complete non-household energy estimates
Human metabolism (K) was estimated at 2756 kcal per capita per day and converted to J yr−1 person−1 (Bailey, 2018). This value is an average for adult men and women and may overestimate the population average, considering that children and the elderly are likely to consume less food. Double-counting is avoided in this case since the data set on the embodied energy of food consumption (below) captures only the additional energy expenditure (e.g. from fossil fuels to power machinery), not the biological energy captured as crop plant net primary productivity. According to the Haberl (2001) framework, final energy accounting disregards biological energy inputs into the food system such as livestock feed, focusing instead on human caloric intake. Accounting for example the trophic inefficiency of meat production, physiological metabolism proves an especially egregious example of the limitations of using only a final energy perspective. Improving the sophistication of fossil and primary energy disaggregation should be a high priority focus for this field going forward. Note that the ‘energy embodied in consumption’ with regards to food (from the MRIO model described in earlier sections) considers only the energy expenditures from production – including, for example fuel for tractors, but excluding any energy fixed by plants through photosynthesis. Adding this to the already-calculated government and investment components (J) yields the total per-capita contribution to NNM from activities not captured by household economic activity.
L.–M. Calculate net national metabolism by summing household and non-household components
By adding together the completed household and non-household energy estimates (L, M), we arrive at the total Net National Metabolism.
Use of final energy and notes on human physiological metabolism
Regarding point of accounting, the energy quantities in this study are all framed in terms of final (rather than primary) energy, for reasons outlined in the Introduction and including the ability to allocate energy use to the end consumer. Final energy allows a perspective closer to ‘useful’ energy consumed by society at a point in time and is therefore a better measure of societal activity than primary energy. Overall, the choice of final energy over primary energy does not greatly impact the categories of energy consumption included in analysis, only the magnitude of the NNM (as energy is lost in the energy system through inefficiencies in generation and distribution, meaning the primary energy footprint is greater). The available data sets also necessitate a final energy perspective in order to achieve the desired spatial granularity. For consumption and domestic and transport energy usage data, final energy has been accounted for in the traditional sense (Eurostat, 2018). For human physiological metabolism and nutrition we align with (Haberl, 2001), who states that ‘final energy also includes the nutritional energy consumed by humans for their sustenance and activity, as well as the nutritional energy consumed by working animals’ (Haberl, 2001); like food for human consumption, feed for working animals is regarded as final energy, while feed for livestock (intended for slaughter) is excluded in final energy calculations as these animals’ metabolism is regarded as a conversion loss along the path of converting biological resources into human food (Haberl, 2001). We have excluded working animal feed from our calculations for reasons of data availability and the decreasing importance (and quantity) of working animals in modern agriculture.
Use of econometric data
The decision to focus on econometric data such as household expenditure is grounded in concerns of immediate practicality as well as in conceptual intention. Their widespread availability, their government-sanctioned collection and the long-term time series available for these data sets allows for easy extensions of the methodology across temporal and spatial scales. By producing simultaneous and methodologically consistent estimates for a large number of subnational regions (districts), we enable the assessment of consequential follow-up questions of variation across regions and the relationship to socioeconomic variables. It also facilitates the potential integration and adoption of this metric with prevailing accounting methods which are, currently, by and large the domain of macroeconomics.
Fossil proportion
Indicative fossil fuel proportions of metabolism were estimated by applying averages for the proportion of fossil energy for the World, for the UK energy system and for the UK electricity system, respectively, where appropriate, sourced from the International Energy Agency. Fossil fuel comprises coal, oil, petroleum and natural gas products (not nuclear).
Comparison to biological productivity
Biological productivity – Net Primary Productivity (NPP) and Gross Primary Productivity (GPP) – was estimated using the MODIS product MOD17A3.055: Terra Net Primary Production Yearly Global 1km (Running et al., 2011). Missing regions (corresponding to approximately 2% of the total Great Britain area) were estimated using the average for the known regions to yield the total estimate. NPP was calculated to be 6.95 EJ/year and GPP as 11.01 EJ/year. For comparison, the NNM (social metabolism) of Great Britain (England, Wales and Scotland) was 7.36 EJ.
Estimating mass of primate based on metabolism
The following scaling equation was used to estimate the mass of a primate with a specific metabolism: 5.66 × M^(3/4), with mass in kilogram and giving the resulting metabolism in Watts (Malhi, 2014).
Socioeconomic (deprivation) data
The English Indices of Multiple Deprivations is a composite metric describing the social deprivation in local areas of England and includes such factors as health outcomes and poverty (Mhlcg, 2015). The raw scores for overall deprivation (for Lower Layer Super Output Areas (LSOAs)) were rolled up to LAD level by way of an average weighted by population in each LSOA. The analysis includes England only, because the government data set on deprivation used (the English Indices of Multiple Deprivations (Mhlcg, 2015)) is limited to England.
Results
What is the total and per capita Net National Metabolism of the UK?
We calculate the total NNM or social metabolism of the UK in 2016 – the most recent year of consistently available data at the time of writing – to be 7.56 EJ/year (1 EJ = 1018 J). The per capita share of the Net National Metabolism is 118 GJ/person/year on average (or 3630 W), with values for local authority districts ranging from 75 to 176 GJ/person/year (2310–5410 W). For comparison, the magnitude of the energetic biological metabolism of an adult human at rest is approximately 120 W (Malhi, 2014); hence the per-capita NNM share of the average UK resident is around 30 times their biological metabolism.
How is UK NNM partitioned, geographically and across its constituent categories?
The greatest components of the UK NNM stem from personal and public transportation (25%), domestic heating and appliance use (21%) and energy associated with government and investment activities (17%); Figure 1.
Human physiological metabolism constitutes only a small fraction of the total NNM: 3.7% (Figure 2); for comparison, a primate with a physiological metabolism equivalent to the mean per-capita NNM (i.e.
How much does dense urban living affect per capita NNM and why?
Examining the disaggregation into local authority districts, it is apparent that urban districts tend to have lower per-capita metabolism (Figure 3). For all constituent countries, population density is negatively correlated with per-capita NNM: urban areas are in this sense more metabolically efficient (Figure 4), with large cities tending to one-third lower per capita NNM that thinly populated rural areas. This pattern is mostly driven by reduced personal transport (47% of trend) and lower domestic energy usage (20%) in cities (see also Grubler et al., 2012; Intergovernmental Panel on Climate Change, 2015).
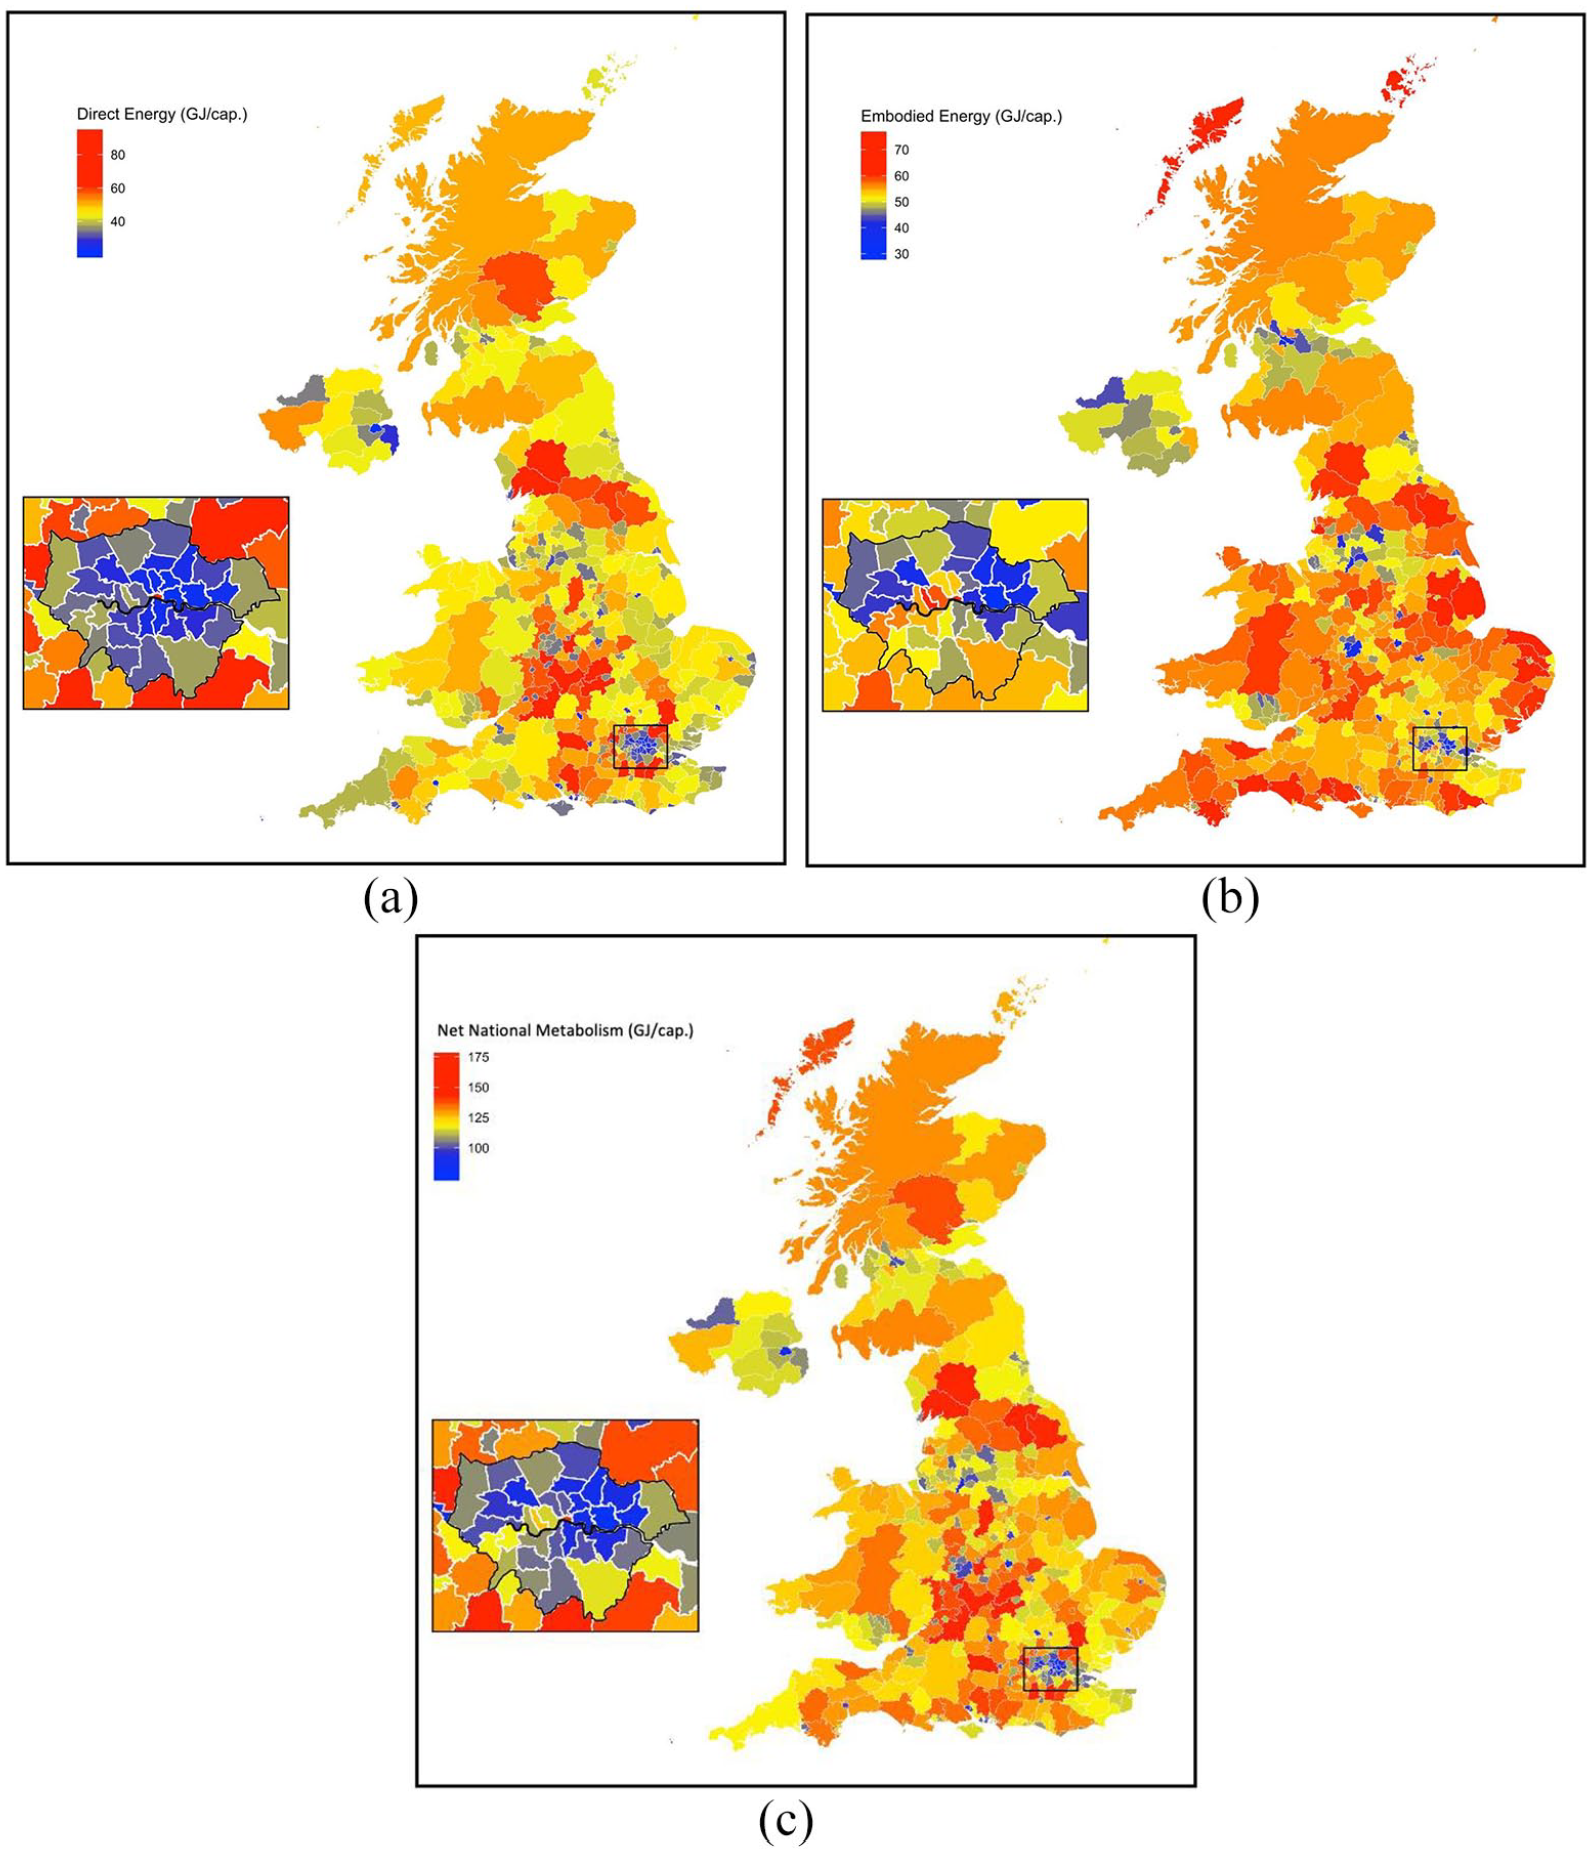
Choropleth maps show per capita Net National Metabolism, and components of the same, for each of the 391 local authority districts in the United Kingdom of Great Britain and Northern Ireland for 2016, with red hues representing greater values and blue hues representing lower values. Insets show the Greater London area, as do the maps’ border highlights. (a) The direct energy consumption (domestic consumption and personal transportation use) for each district. (b) The metabolism associated with (i.e. the energy embodied in) the household consumption of goods and services for each district. (c) The total social metabolism (per capita NNM) for each district, calculated as the sum of values shown in panels (a, b), plus additional components as described in the text. Per unit area maps of NNM are shown in Supplemental Figure S-1.
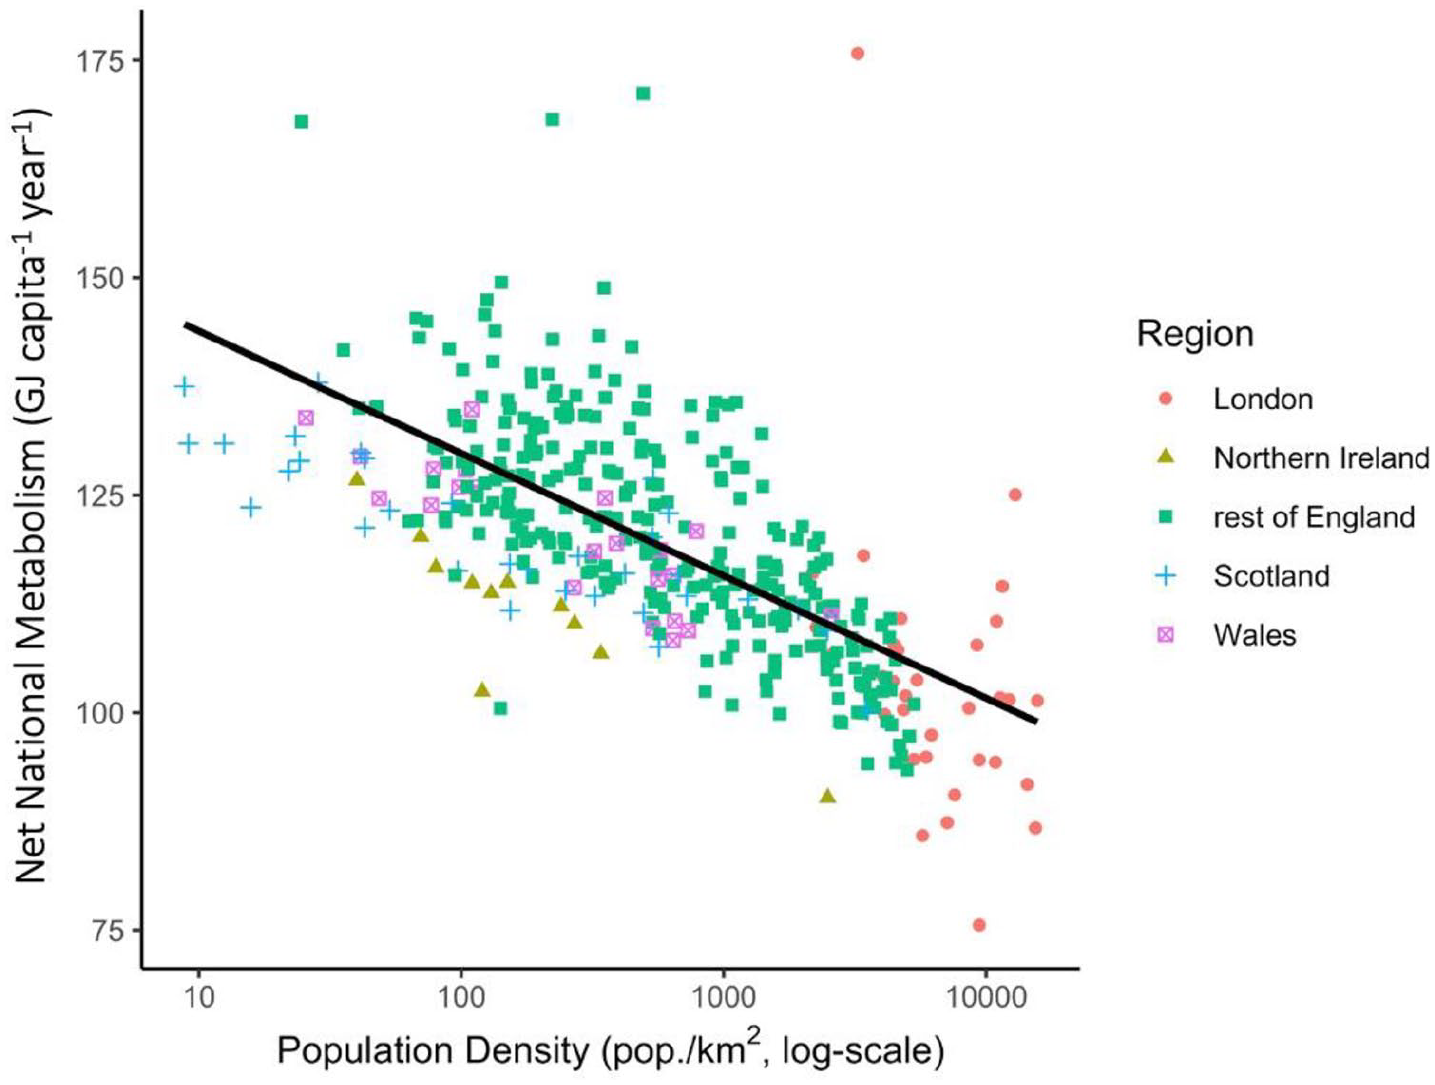
Scatterplot shows the 2016 Net National Metabolism (NNM) for each UK local authority district plotted against its population density. Red circles represent districts in the Greater London Area; green squares represent districts in England outside Greater London; brown triangles represent districts in Northern Ireland; blue crosses represent districts in Scotland; purple boxes represent districts in Wales. The black line is a regression including all data points – local authority districts (y = −6.11 × log(x) + 158; r2 = 0.46; adj. r2 = 0.46). Overall, a regression over the logarithm of population density explains 46% of the (all UK) geographical variation in per capita NNM. This decline in per capita NNM with increasing population density is caused by less use of personal transport (47% of the trend) and lower direct energy usage for domestic purposes (20% of the trend). Within London, however, striking contrasts between poorer areas (East London: low NNM) and wealthy areas (West London: high NNM) are apparent.
How much of the UK NNM is ‘internationalised’ through trade teleconnections, and how much of this metabolism is fossil-based?
Of the 62% of UK NNM that is embodied in household consumption of goods and services and in government and investment expenditure, 46% originates from within the UK, 16% from the European Union, 8% from the United States, 7% from China and 23% from the rest of the world (Figure 2). Similarly, it can be assumed that the UK exports substantial amounts of embodied energy in a similar fashion, but evidence suggests the country is a net ‘metabolic importer’: the UK’s national energy consumption is 23% greater than its domestic energy consumption according to traditional energy statistics (Dbeis, 2013). While production-based results are not explicitly sought in this study, the metabolic discrepancy between a consumption- and production-based approach is expected to differ similar to the national versus domestic energy accounts. The territorial UK metabolism is thus deflated by the nation’s international trade and its ‘internationalised’ teleconnections, highlighting the need for a consumption-based approach (like the present study) to accurately assess the demand that drives global consumption. The substantial fraction of UK metabolism originating abroad highlights the need for interventions beyond the UK to address environmental problems including climate change, for example, international action or improved policies in exporting countries. Similarly, the scope for making impact through lifestyle change is limited by the substantial fraction of metabolism arising from for example government activities (17%) and domestic electricity production methods (approximately 19%, according to initial basic estimates): given a nationally integrated grid, consumers are bound to (with some caveats) accept the prevailing national fuel mix. Basic estimates indicate that approximately 81% of UK metabolism is ‘fossil metabolism’ – derived from fossil sources.
Can we identify districts with more or less ‘efficient’ metabolic profiles?
A key sustainability challenge is to identify and characterise a ‘safe operating space for humanity’ where human needs are met while environmental limits are not exceeded (Raworth, 2017b). The UK follows a broader global pattern of positive correlations between living standards and metabolism (energy use), but many districts deviate meaningfully from this trend, having a higher or lower social metabolism than expected given their level of social deprivation. These results can be correlated to subnational data sets of interest such as health, poverty or education. Such an analysis is presented in Figure 5, focused on social deprivation across English regions. Areas with disproportionately high metabolic profiles tend to be rural areas with presumably poor transport infrastructure (see the Discussion section for more details).
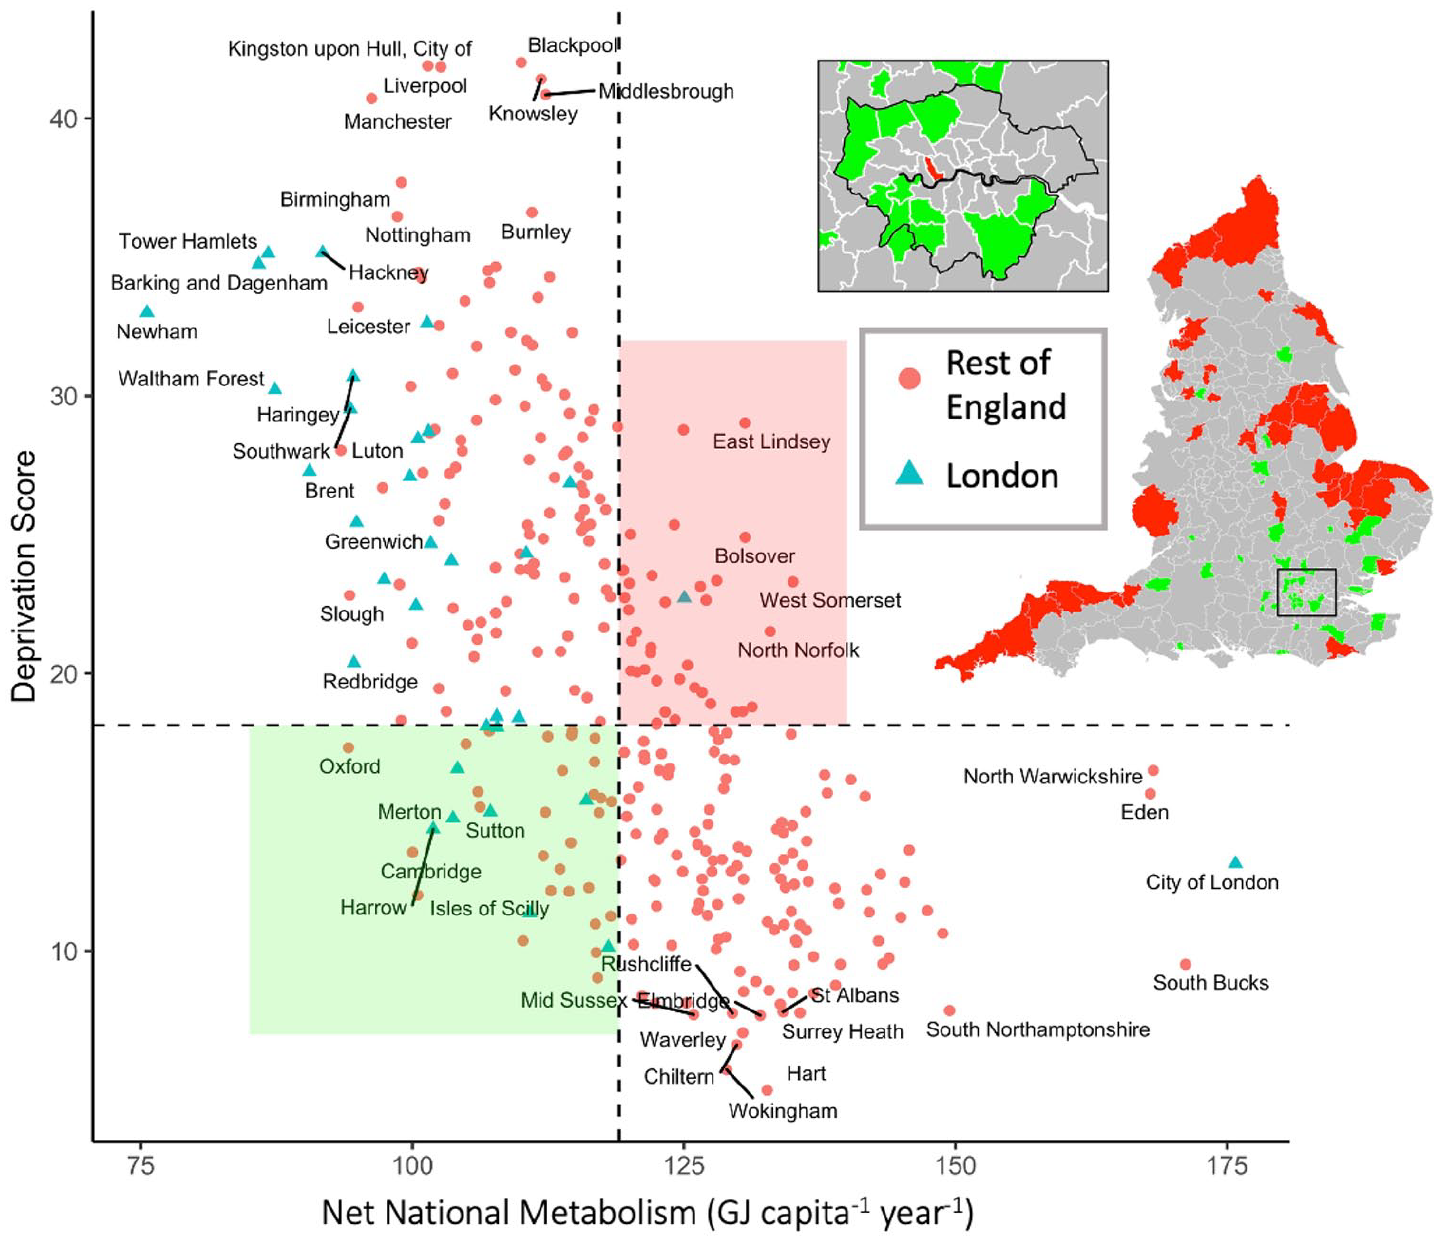
Scatterplot shows the social deprivation score plotted against the per-capita total Net National Metabolism of each local authority district in England. The social deprivation score is calculated as the average of the English Indices of Multiple Deprivation score of each Lower-level Super Output Area, weighted by population; lower deprivation score is better. Local authority districts in Greater London are represented as green triangles; all other English local authority districts are represented as red circles. Dashed lines represent the median values of social deprivation and social metabolism, respectively; these dashed lines define four quadrants. The map highlights English districts falling into the upper right quadrant (red) and lower left quadrant (green) with all other English districts coloured in gray. Map inset shows Greater London Area. The map’s border highlight shows Greater London.
Discussion
Net National Metabolism and variations on the metric
Introduced in the Introduction, we coin the novel metric of Net National Metabolism to describe our bridge metric that incorporates the key aspects of ‘traditional’ social metabolism (Haberl, 2001) and more recent footprinting studies and the broader SMR field (see Introduction for examples). By adding some logical variations, the metric’s usefulness extends beyond this particular choice of system boundaries to encompass major system boundary choices, see Table 1. To ease in communication and understanding, terminological NNM variations mirror those of GDP, with Gross and Net metabolism referring to Primary and Final energy use, respectively; and Domestic and National metabolism referring to territorial and consumption-based metabolism, respectively.
Implications of metabolic magnitude
What are the broader implications of the size of the NNM? While NNM does not directly quantify impacts on the environment, it does link closely to other metrics looking at ecological appropriation and pressure, particularly that of Human-Appropriated Net Primary Productivity (Krausmann et al., 2013). In fact, NNM can be framed in relationship to the background or natural biological metabolism of the region: for Great Britain (Wales, England and Scotland), the annual Net Primary Productivity (biomass production, including agricultural areas) is approximately 6.95 EJ year−1, almost identical in magnitude to the NNM (social metabolism) of the same area. It is worth noting that human activity has increased the ‘natural’ ecosystem ‘metabolism’ in the sense that NPPact is now higher than NPPpot (Musel, 2009). The amount of energy harnessed by a society has further been used as a framing of societal progress, of humans through time as well as of hypothetical future alien and human civilisations (Kardashev, 1964; Malhi, 2014). ‘Outgrowing’ the metabolism of the surrounding environment relies on a combination of imports and adoption of fuel sources not derived from extant living biomass (fossil fuels, nuclear power, wind, solar) (Malhi, 2014).
Limiting the impact of human social metabolism on the planetary system can be done in two ways. First, constraining the future expansion of metabolism in wealthy societies (Krausmann et al., 2018), and second, minimising the impact of said metabolism by using ‘cleaner’ energy generation (e.g. reduced fossil fuel combustion and associated carbon dioxide emission). The NNM as presented here tracks the first aspect. The second aspect requires further development, beyond just quantification of the fossil fuel fraction, to other aspects of a reduced impact metabolism (e.g. a more circular economy). The absolute magnitude and relative proportion of ‘dirty’ metabolism (which requires further development for appropriate definition but is taken to mean fossil proportion in our preliminary analysis) can be metrics of progress towards regional and planetary stability and sustainability goals. Despite the insights that can be generated already with the current framework and methodology, improvements are needed to increase the usefulness of NNM: finding more sophisticated estimates of primary energy and fossil fractions is highly desirable, as this would allow quantification of variations on NNM; the environmental impact of energy consumption differs greatly depending on mode of generation and losses along the way. Furthermore, household expenditure is an imperfect proxy not only for ultimate environmental impact but also for consumption of physical goods: price differences due to branding or labour intensity (over quantity or energy requirements) are poorly reflected in our methodology. This limitation can be addressed in multiple ways: statistical adjustments could be applied to spending for groups of people depending on average consumption characteristics; or methods to locally quantify consumption directly could be employed. These limitations are currently inherent to input-output modelling methodologies.
Correlating NNM to data sets of interest: Social deprivation example
The detrimental impacts of power generation and resource consumption globally are well known (Steffen et al., 2015a). There is also a broadly positive correlation between welfare and metabolism globally, the details and strict causality of which is an active area of scholarly debate (Roser, 2020; Steinberger and Roberts, 2009; Steinberger et al., 2020). As part of this study, we seek explanations for, and definitions of, metabolic ‘efficiency’. Lower per-capita social metabolism is one possible and simple definition of metabolic efficiency, fossil fraction another; we examine both of these briefly. Efficiency can also be defined as delivering good social welfare outcomes with relatively low social metabolism. The analysis exposes areas with high quality of life and small biophysical magnitude, one way of approaching an answer to the question of whether we can live well within natural limits (O’Neill et al., 2018; Raworth, 2017b).
Analysis of the patterns in the wealthy European country in this study shows that metabolism per capita generally decreases with increased urban population density and is negatively correlated with social deprivation. Studying in detail the outlier districts in Figure 5, with a particular focus on the lower left (low deprivation, low metabolism) and upper right (high deprivation, high efficiency) quadrants could provide lessons on the drivers of metabolic efficiency: beyond geographic factors (including, e.g. a colder climate at higher latitudes or lower population densities driving increased heating- or transport-related metabolism), what are the factors which cause significant deviation from the broadly negative correlation between metabolism and deprivation? While deprivation and metabolism are both correlated with household income, it may be of interest to policymakers to learn about explanatory factors beyond income. A comparison of inequality indices and metabolism suggests that inequality could be an explanatory factor, but only between Greater London districts. Further inspection (Figures 3–5) suggests that rural remoteness matters: poorly connected areas with high energetic transport costs (high metabolism) but lower rural incomes could be driving these characteristics. The districts in the lower-left quadrant (the ‘positive anomalies’) resist trivial characterisation, suggesting multiple factors may be at work: for example, university towns like Oxford may have a relatively large population of predominantly middle-class students (low deprivation) but relatively low levels of goods consumption and personal car usage due to life-stage, social and cultural factors as well as due to city planning.
It would require more detailed investigation to further identify the factors that drive the interaction between deprivation and social metabolism; our aim here is merely to point to the potential of NNM to be coupled with social metrics to analyse such questions. Identifying promising intervention points such as infrastructure that could reduce deprivation as well as regional metabolism should be a top priority for the field. The challenge of the Anthropocene is to create a ‘safe and just space’ for people to live (O’Neill et al., 2018; Raworth, 2017b), meaning deprivation is minimised or abolished and that the biophysical environmental pressures of our economic activities – here represented by NNM – do not exceed the planet’s regenerative capacity (Steffen et al., 2015b). It is our hope that the present study shows the direction of using social metabolism conceptually and available datasets practically, while also providing an initial short-list of key areas that lie closer and further away, respectively, from providing a safe and just space for their residents.
Finally, the analysis provides basic outlines for social power structures and spaces for change: 79% of Net National Metabolism is driven by personal consumption and thus amenable to change through action in that area – although in practice individual agency is likely to be severely limited by available options dependent on example historical infrastructure decisions.
Conclusion
Net National Metabolism adds to the growing field of socio-metabolic research by promising an easy-to-express, comprehensive and practically feasible ‘hard numbers’ perspective. It forms a bridge between contemporary footprinting approaches and the ‘historical’ or comparative aspect of social metabolism, bridging physics, ecology and econometrics. Through its variations (net/gross; national/domestic), NNM provides a shorthand parlance for different types of social metabolism and can be helpful in explaining to non-experts the link between economic activity and physical impacts, due to its similarity with the well-known concept of GDP. The proposed methodological framework unlocks the potential for our approach to be used in further development of this and similar metrics, due to the greatly increased sample size and consistency in estimates. This promises opportunities for rapid implementation across other data-rich countries, and also presents a model framework for data-poor nations and regions. Minimal base data had to be collected or generated for this study, and data sets were mostly sourced in accessible formats from online databases. Comparisons between local regions – and the teleconnections to other countries through global supply chains – highlight insights which will be of particular value when comparisons can be made to other countries. As we have demonstrated, issues of equity and the decoupling of economic development from environmental impacts can also be examined through this lens. NNM links economic activity to physical quantities, and can assist in our quest to identify and move towards a safe operating space for humanity and the Earth system in the Anthropocene.
Supplemental Material
sj-pdf-1-anr-10.1177_20530196211038658 – Supplemental material for Net national metabolism as a fine-scale metric of energetic biophysical size in an industrialised country
Supplemental material, sj-pdf-1-anr-10.1177_20530196211038658 for Net national metabolism as a fine-scale metric of energetic biophysical size in an industrialised country by Fredrik A. A. Eriksson, Anne Owen and Yadvinder Malhi in The Anthropocene Review
Footnotes
Acknowledgements
Author contributions
YM and FAAE conceived and designed the analysis. FAAE collected data and conducted analyses (except EEMRIO). AO provided all EEMRIO-analyses and related data. All three authors wrote and edited the manuscript.
Declaration of conflicting interests
The author(s) declared no potential conflicts of interest with respect to the research, authorship, and/or publication of this article.
Funding
The author(s) disclosed receipt of the following financial support for the research, authorship, and/or publication of this article: FAAE acknowledges support from the Environmental Change Institute (ECI) at the University of Oxford, particularly the Dissertation Publication Prize. This paper builds on work completed by FAAE as part of his MSc dissertation at the ECI; program attendance was supported by the Boardman Scholarship (ECI) and by the Dartmouth General Fellowship (Dartmouth College). The contribution of AO was supported by an EPSRC Fellowship award EP/R005052/1. YM is supported by the Jackson Foundation.
Supplemental material
Supplemental material for this article is available online.
References
Supplementary Material
Please find the following supplemental material available below.
For Open Access articles published under a Creative Commons License, all supplemental material carries the same license as the article it is associated with.
For non-Open Access articles published, all supplemental material carries a non-exclusive license, and permission requests for re-use of supplemental material or any part of supplemental material shall be sent directly to the copyright owner as specified in the copyright notice associated with the article.