
Abstract
The Mississippi River Basin is a vast near-planar surface, an area upon which sunlight falls and wind flows. Its gently banked geomorphology channels precipitation, sediment, biota, and human activity into a dynamic locus of regional Earth system interactions. This paper describes the major features of this region’s energy exchanges from a thermodynamic Earth systems perspective. This analysis is combined with descriptions of the historical and socio-political contexts that have helped shape energy use. In doing so, the paper contrasts the region’s available energy exchanges and flows with their anthropogenic diversion, providing an account of human impact at a regional scale. It also offers theoretical estimates of the potential availabilities of renewable energy. This is contrasted with a description of the geological formation of stocks of fossil energy in the region. On these bases, a number of maps are presented and an assessment of the region’s energy flows is offered. These exercises point to significant affordances for achieving regional de-fossilisation at the river basin scale.
The Mississippi river basin as an energy region
The magnitude at which Earth’s available energy has been diverted toward human needs provides a useful indicator of anthropogenic impacts on the Earth system (Raupach and Canadell, 2010; Zalasiewicz et al., 2021). Most recently, it has been shown that humankind expended more energy since the middle of the 20th century, the proposed starting point of the Anthropocene currently being investigated by the Anthropocene Working Group, than in the previous 11,700 years of the Holocene (Syvitski et al., 2020). This extraordinary expenditure occurred as a result of specific geographical and historical circumstances. Here it is argued that quantifying available and anthropogenically diverted energy flows within Earth’s constituent energy regions provides some indication of the specific geography of planetary-scale energy transfers. As geographically distinct subsets of the total Earth system, energy regions offer units within which energy flows can be measured, human impacts assessed and opportunities for defossilisation identified. The term defossilisation is used as it conveys the urgent need to remove fossil fuels from the global energy mix rather than, as is possible in decarbonisation scenarios, allowing their continued use as an adjunct to renewable energies, offsets, or geoengineering (on renewables, see Schlögl, 2021).
To exemplify the concept of the energy region, this paper analyses the Mississippi River Basin (MRB), a 3.3 million square kilometer hydrological catchment area spanning over 40% of the U.S. land area. 1 This region is analyzed in terms of the available energy conversions and exchanges (available energy flows) that take place in this subset of the Earth system and the proportion diverted to human ends (anthropogenic energy flows). 2 This comparative quantification is intended to contribute to our understanding of three questions:
1.) What are the major features of the current geography of energy within the MRB?
2.) To what extent does anthropogenic energy use impact upon the energy conversion processes within the MRB, as a regional subset of Earth system thermodynamics?
3.) What capacities does the MRB offer for regional defossilisation?
Earth system thermodynamics addresses the planet as a system of energy exchanges at various scales, over which humans are affecting an increasing influence (Kleidon, 2016). Interrogating such exchanges at a regional scale presents clear methodological challenges. In the U.S., statistics on energy consumption are generally monitored by state authorities. These are available online and indicate the scale and distribution of anthropogenic energy use in the region (Carley, 2009). Given differences between the watershed boundary and political boundaries, in this analysis states were considered part of the MRB if more than 50% of their surface is within the MRB (Supplemental Appendix A.) For this area, this paper presents estimates of the major unmediated energy flows and affordances derived from up-to-date global scale gridded climate data. 3 This climatological data is used to calculate values for key Earth system energy fluxes at a regional scale. These estimates of regional energy availabilities are then compared to estimates of anthropogenic diversion and use of available energy.
Human derivation and consumption of energy has traditionally been addressed at a national level. There are good reasons for doing so, not least its coherence with the pursuit of national economic growth (Guyol, 1960: 68). But energy obviously does not arrive on Earth in accordance with national borders. With the exception of tides and geothermal heat flux, all available energy on Earth comes from the Sun. Major transformations of Earth system processes have been discerned as a result of anthropogenic use of available energy (Algunaibet et al., 2019; Raupach and Canadell, 2010). These changes became particularly pronounced following vastly increased rates of fossil fuel use from around 1950 onward (Syvitski et al., 2020). The rate and scale of energy use has destabilized many parameters of the Earth system (Steffen et al., 2020). Moving toward a less impactful energy system necessarily involves engaging with the specificities of Earth’s composite regions: meaningfully defined areas in which shared environmental properties can be identified (Hartshorne, 1939: 289; Wrigley, 1964). It has also been suggested the extent of ‘human-modified ground’, land transformed to meet human needs could be a more tractable indication of anthropogenic impact than a planet-wide isochronic definition of the Anthropocene (Dearing et al., 2015; Edgeworth et al., 2019: 337). Accordingly, this paper considers the MRB as an ‘anthropogenic biome’, a region in which human and natural systems have become so enmeshed that they are indivisible (Ellis and Ramankutty, 2008: 445).
A watershed moment
Watersheds, landscapes that aggregate hydrological energy have long provided a base unit for regional analysis (Turnbull et al., 2021). An energy region could also be demarcated by a shared geological profile, such as a coal seam (Wrigley, 1962: 31), or the distribution of specific energy using technologies (Späth and Rohracher, 2010). Industrialization has markedly expanded the scale of energy regions, imposing a certain homogeneity in patterns of energy use and creating ‘operational landscapes’ geared toward resource extraction and commodity production on a massive scale (Brenner and Katsikis, 2020; Wrigley, 1964). The consequences of fossil fuel use, in terms of climate change and the exceeding of planetary boundaries, affirms that the fundamental energy region of concern must be that of the overall Earth system (Otto et al., 2020). However, below this scale, available and anthropogenic energy flows and their impacts must be understood as geographically variable (Bridge et al., 2013). De-fossilisation of the planetary energy system requires the analysis of existing and emergent configurations of energy use and opportunities for transition at the regional scale.
The MRB has long attracted inquiry as a site of resource scarcity, pollution (Odum et al., 1987), ecosystem, land use and climate change (Kolker et al., 2018), and wider Earth system transformations (Hoitink et al., 2020). Acknowledging these changes, this paper addresses the MRB as a dynamic anthropogenic biome in need of energy system defossilisation. More generally, river basin development is undergoing a renaissance, worldwide river valleys are being developed into integrated power systems for deriving hydroelectricity, energy-efficient transportation, and energy storage (Moran et al., 2018: Zarfl et al., 2015). A specific hydrologically centerd form of development has spread to the Global South, modeled upon North America’s now venerable hydropower infrastructure as it developed from the 1930s onward (Lagendijk, 2018). This infrastructure has recently been reconsidered as antecedent to calls for a ‘Green New Deal’, a major policy program demanding state investment in a zero-carbon energy transition in the U.S. and beyond (Galvin and Healy, 2020). With the Biden Presidency beginning in January 2021 and its commitment to achieving net-zero carbon emissions by 2050, such attempts to significantly transform the U.S. economy appear likely (Bang, 2021: 53–54). However, growing evidence of the ecological impact of dams and their role in methane production has given hydropower a marginal status within most national plans for a Green New Deal (Deemer et al., 2016; Jacobson et al., 2019). At this ‘watershed moment’ in human-environment history, the risks and benefits of further transforming river basins into power systems must be carefully considered (Trombley, 2018: 128). Intervening in hydrological cycles invites both geological and geopolitical consequences (Schmidt, 2017; Walker and Simmons, 2018). With these concerns in mind, a first step is to survey all non-fossil energy availabilities in target regions before committing to any given energy policy.
An operational landscape
The MRB has experienced extraordinary levels of anthropogenic modification since the end of the Holocene, as European colonization began (≈1492–1650 CE) and disease and conflict meant as many as 50 million indigenous people died or were killed (Lewis and Maslin, 2015). Since then, processes that can be broadly described as landscape ‘operationalization’, the transformation of a given environment in pursuit of large-scale commodity production, have taken place (Brenner and Katsikis, 2020). Colonisation has long been recognized as the start of a transition that took the region from an almost complete dependence on renewable energies toward the domination of fossil fuels (Odum et al., 1987: 14). Landscape operationalisation began with settler colonialist land clearance, drainage, and irrigation. Landscaping, both the tilling of soils to create farmland and tiling, installing tile drainage systems to dry wetland soils, set the stage for subsequent agro-industrialism (Cronon, 1991; Hart, 1972; Hudson, 1994). From the mid-1700s onward, levee building, river-widening, swamp draining, dredging, and canalization improved towboat and barge mobility and reduced transport costs through the basin (Anfinson, 2011; Shallat, 1994). Dams for irrigation, mills, and navigation began to be built in the 1880s, hydroelectricity began around 1909, with all interventions in the flow of the river serving to reduce downstream sediment transport (Fremling, 2005: 214; Syvitski and Kettner, 2011: 964). In the same year, petroleum pipelines began connecting the MRB to the Gulf of Mexico, connecting the industrial present to the geological past (Loos, 1959; Zalasiewicz et al., 2014). By 1918, coal provided 71% of U.S. primary energy use and had transformed economic behavior (Suits et al., 2020: 6). For example, the first coal-powered steamboat was launched on the river in 1811, which helped transform the Mississippi and its tributaries into conduits for the upriver transport of sugar and cotton and other products of large-scale agricultural industry (Johnson, 2013: 73). The use of enslaved peoples in these regional and labour-intensive industries has been problematically cast in energetic terms (Mouhot, 2011). Plantation owners indeed reduce these people to mere productive units and accounted for them accordingly (Rosenthal, 2018: 67). However, if historians continue to draw such comparisons, even critically, they risk reinforcing the same dehumanising logic underlying this abhorrent aspect of the region’s history (Johnson, 2016).
Since colonisation, the density and configuration of people within the MRB region have impacted upon its energy profile. In recent decades, settlement patterns have been undergoing a transformation, as its population has concentrated around major zones of urban agglomeration largely retreating from lower density, rural areas, which have consistently reduced populations. More than 950 out of the 1615 counties across the MRB (59%) have experienced population decreases in the past two decades. Between 2000 and 2018 these counties lost more than 300,000 inhabitants in total. In this timeframe, the region’s population has grown significantly slower than the rest of the country (4.5% growth compared to 6.3% for the U.S.). 4 Polarization occurred as cities grew demographically and their surrounds were depopulated (Supplemental Appendix B). As population concentrated in urban centers, rural and peri-rural landscapes became increasingly operationalised, configured to accomplish production with increasing efficiency. The MRB can be considered the operational heartland of the U.S., with < 30% of the nation’s population but 40% of its powerplant capacity (Map 1) and > 50 of its agricultural land. 5
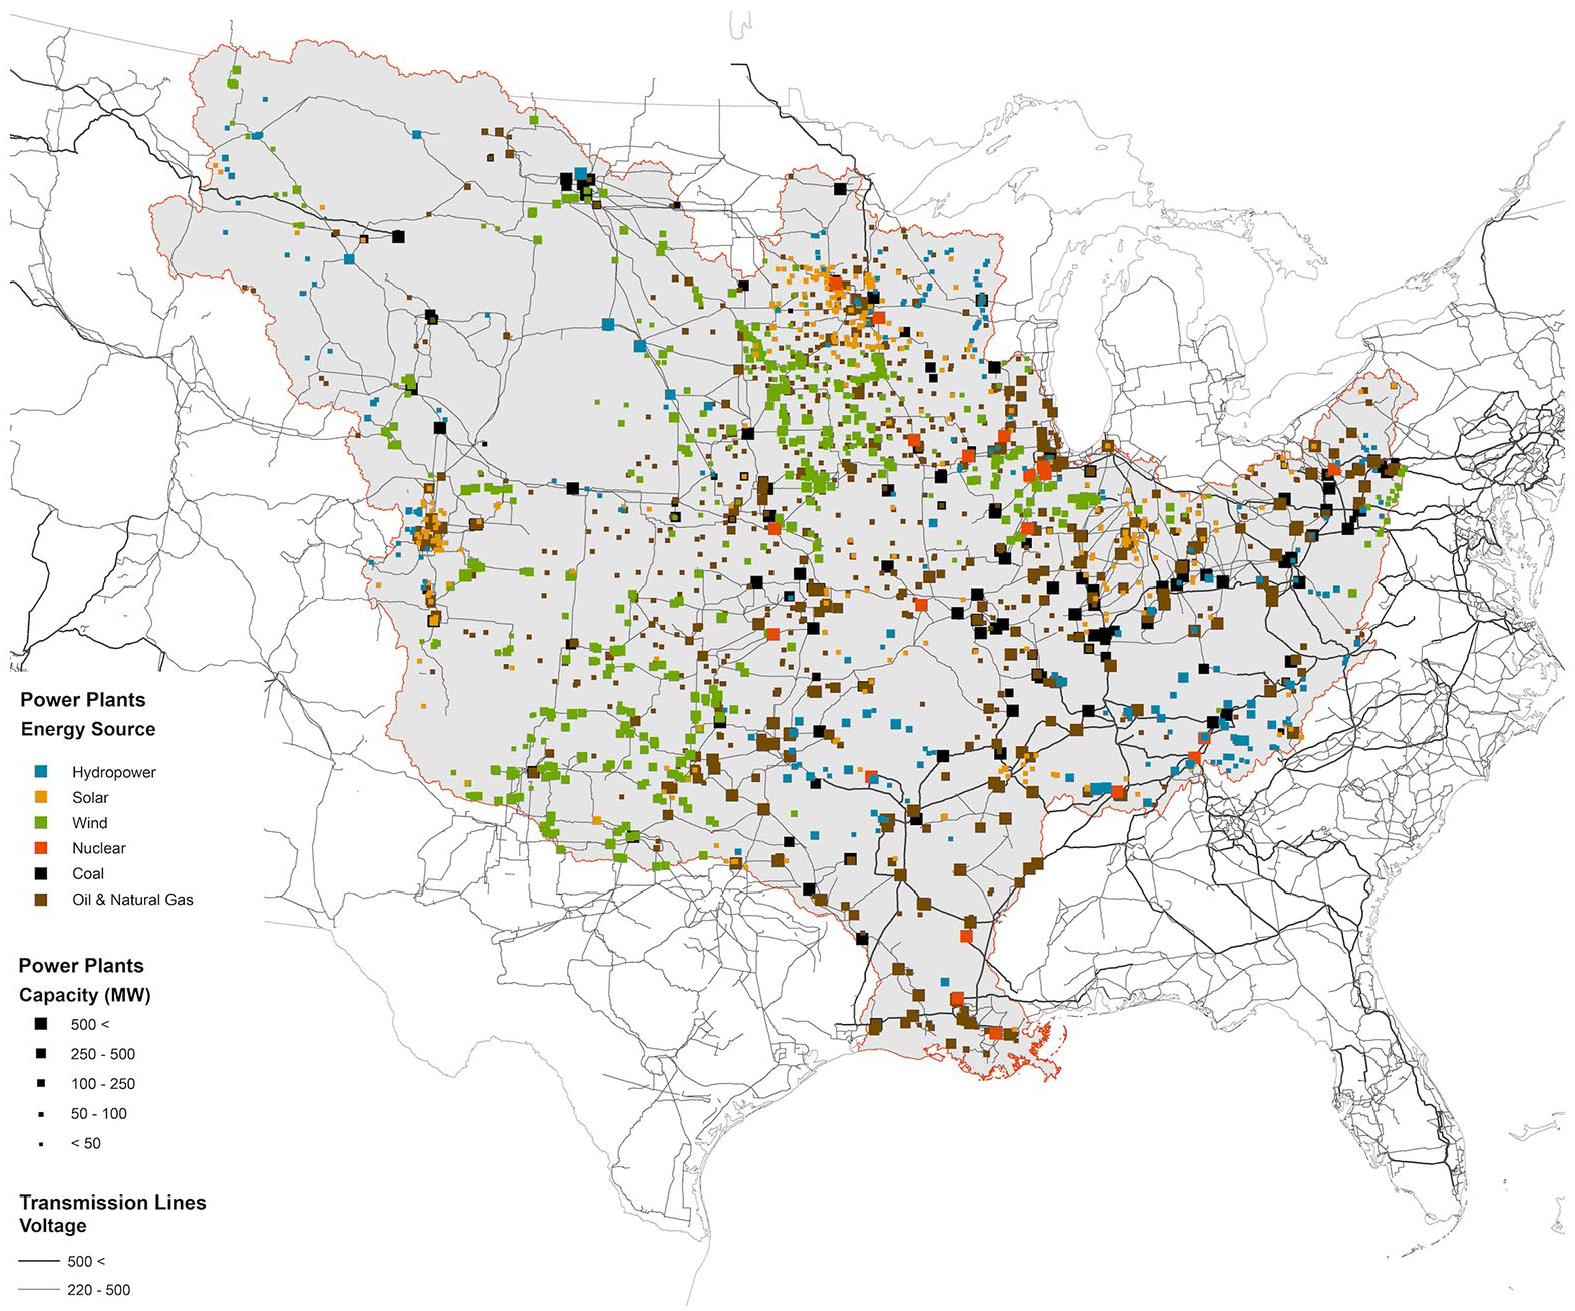
Energy production networks across the MRB.
The creation of this operationalised landscape has required vast amounts of energy. This embedded energy might be thought of as the integral of all the energy consumed in the region over past centuries to configure the MRB into its current form (Odum et al., 1987: 7; Map 1). However, the quantification of this energy lies beyond the scope of this study. A more easily calculable metric is the annual rate of regional energy consumption. 6 We calculate the present rate of anthropogenic energy diversion in the MRB at nearly 1.15 terawatts (TW) annual mean, or 36.3 exajoules (EJ) per year, 7 of which the vast majority (83.8%) derives from fossil fuels (Table 1, Figure 1). This is similar to ratios at a planetary scale, where anthropogenic energy consumption occurs at around 18 TW, or 568 EJ per year, of which 15 TW (83.3%) is fossil-fuelled (Bardi, 2016: 2). Since European colonization of the Americas (~1750 CE) the accumulated effects of fossil fuel use have increased Earth’s radiative forcing by an average of 2.29 Wm-2, causing climate warming (Waters et al., 2016). De-carbonization or better de-fossilisation of the energy system is needed to slow down catastrophic climate change and other breaches of planetary boundaries (Folke et al., 2021). This energy transition is also necessary to address the negative impacts of fossil fuel use apparent at the regional scale, that affect social and racial equity, public health, ecosystem functions, and biodiversity (Healy et al., 2019).
Current anthropogenic energy diversion in the MRB.
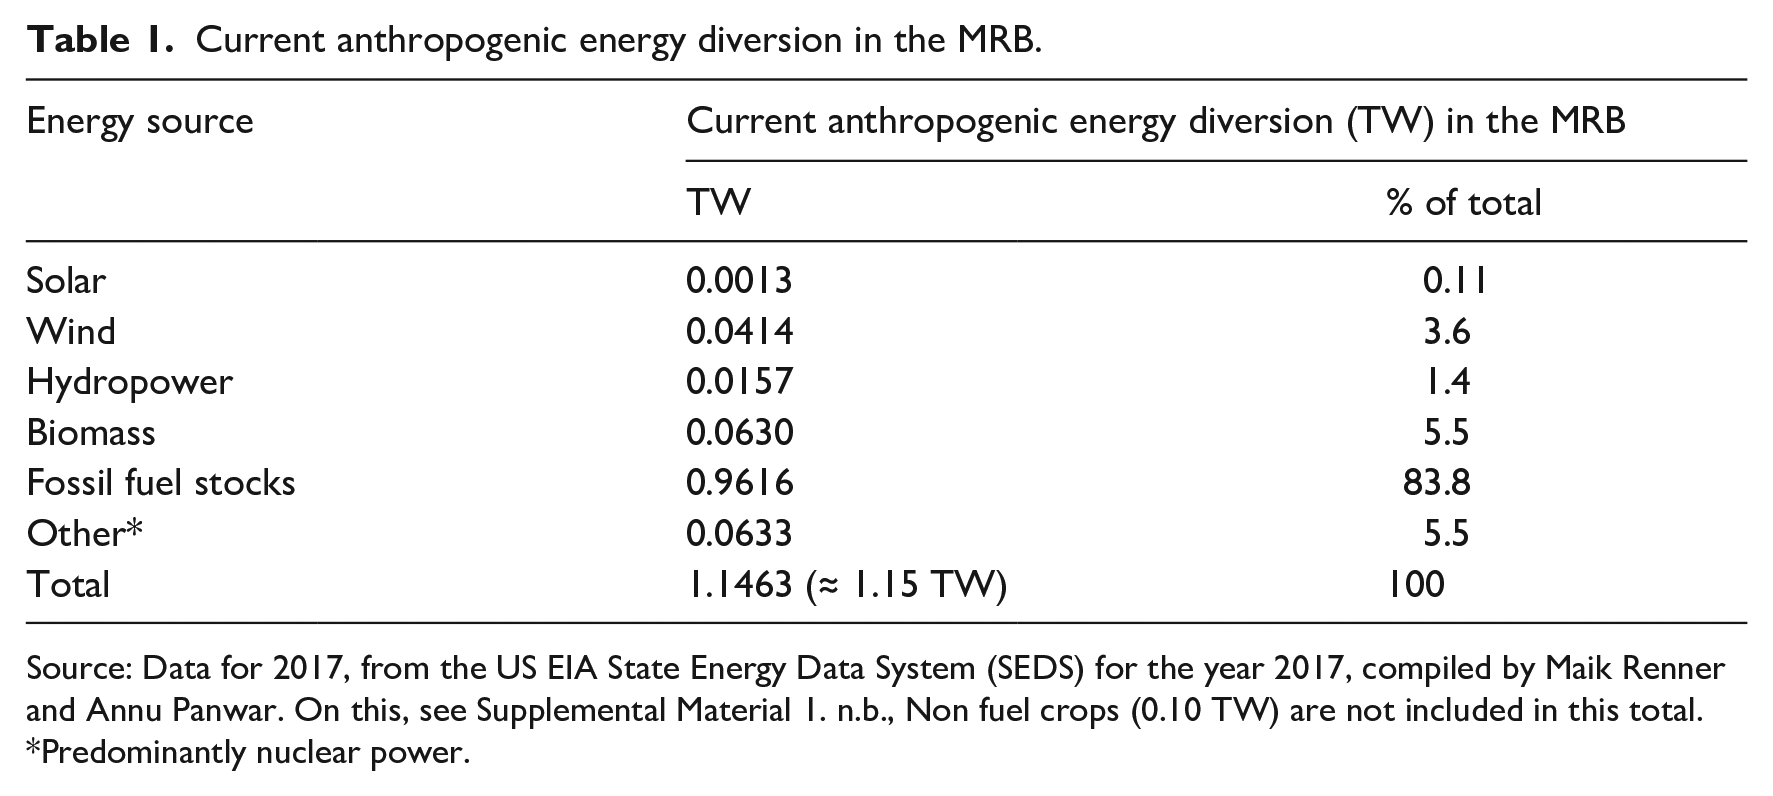
Source: Data for 2017, from the US EIA State Energy Data System (SEDS) for the year 2017, compiled by Maik Renner and Annu Panwar. On this, see Supplemental Material 1. n.b., Non fuel crops (0.10 TW) are not included in this total.
Predominantly nuclear power.
The availability and anthropogenic diversion of energy in the Mississippi River Basin.
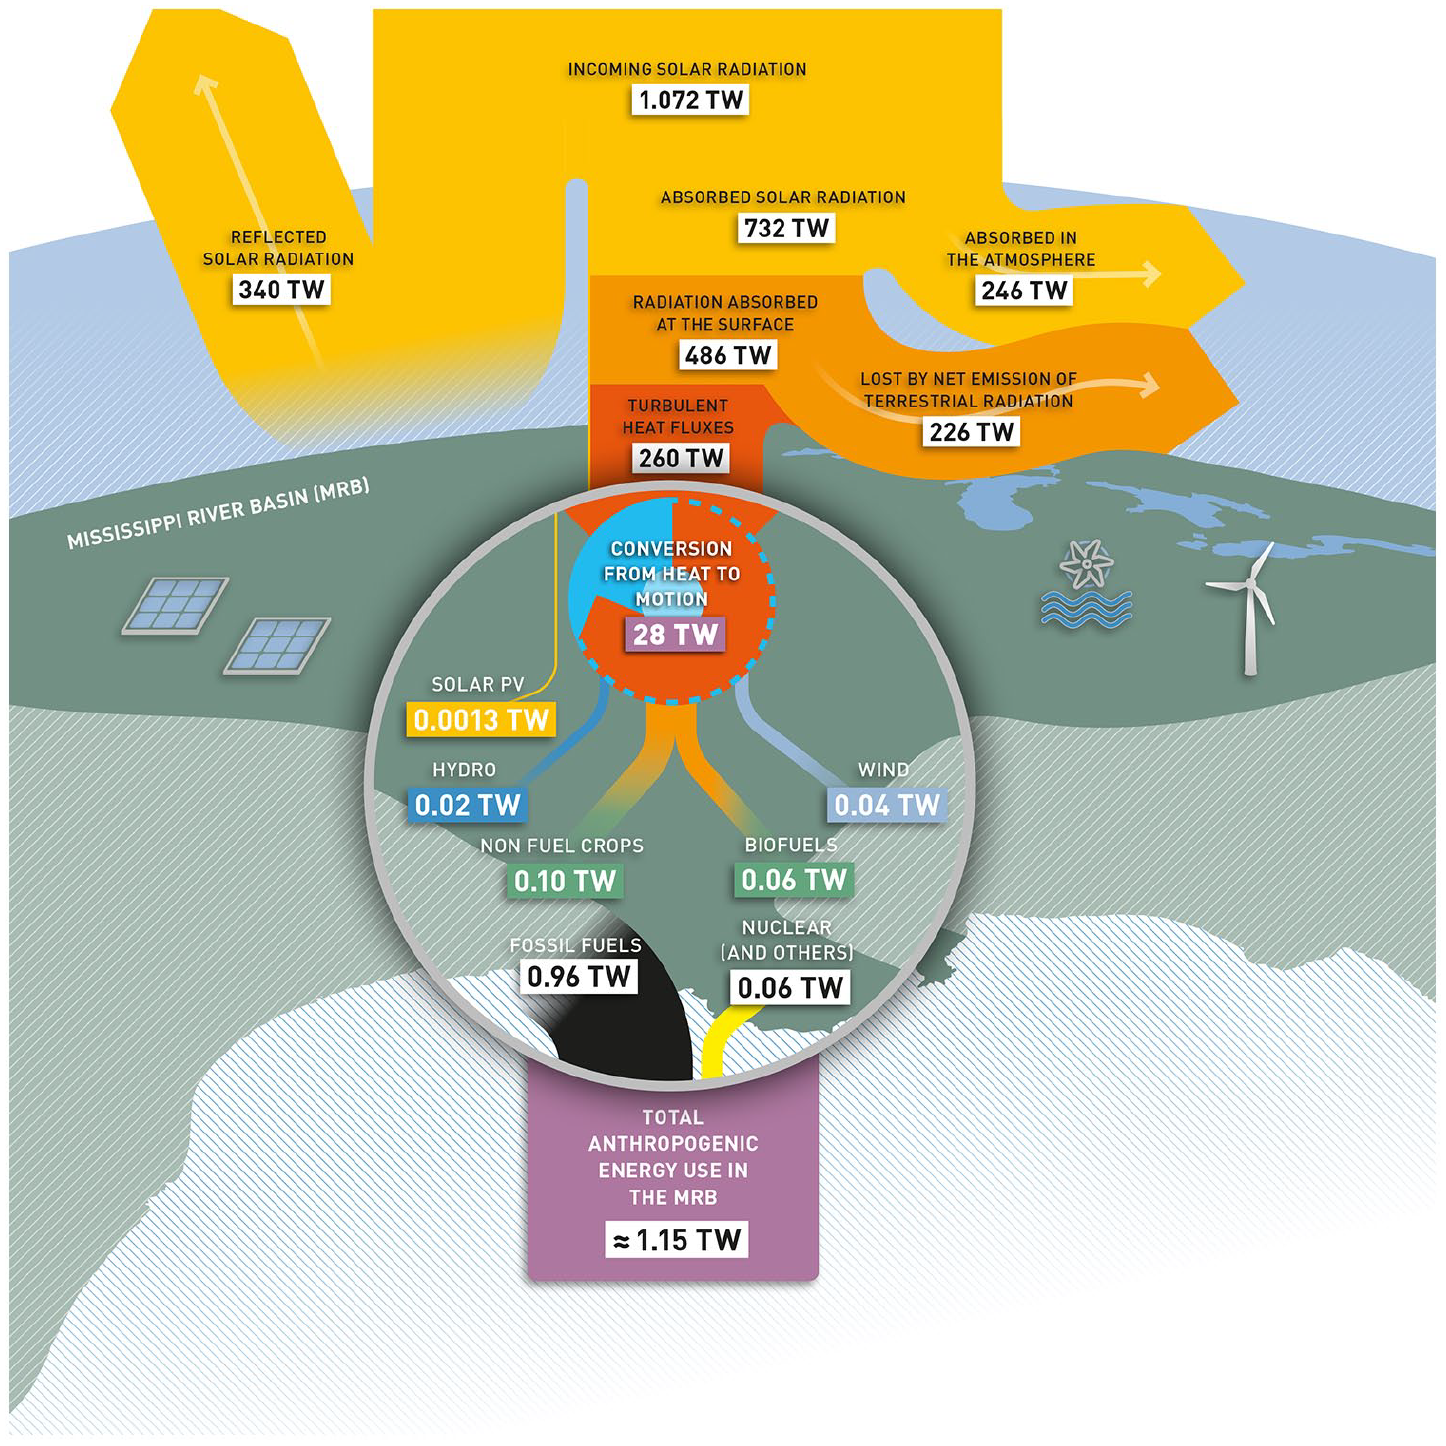
The next section of the paper describes the thermodynamic Earth system processes within which decarbonisation might be pursued. The operationalization of the MRB was achieved by diverting a growing proportion of the region’s available energy. The last study of this region as an energy system was published in 1987, with energy set out as a ‘unifying concept’ allowing direct comparison of human and Earth processes. This study was primarily concerned with the regional impacts of industrial operations (Odum et al., 1987: iii). Subsequent work extended such analysis to consider the MRB as a site of human-ecosystem relations (Mitsch and Day, 2004). In successive stages, the MRB is considered a regional subset of planetary energy flows. Estimates of the theoretical energy available in solar, wind, hydrological, and biotic forms are quantified and compared to estimates of energy currently diverted for anthropogenic use. To illustrate the overall influx of available energy and its anthropogenic diversion in the MRB an annotated diagram is presented below (Figure 1).
Available solar energy and its anthropogenic diversion in the MRB
Incoming solar insolation falling on the MRB region and its atmosphere is the primary energetic input that powers most succeeding energy flows. Very broadly, the availability of solar energy is determined by the size of the land area upon which it falls, and the boundaries with which this analysis is concerned. In this case, it is the 3.2 million-square-kilometers between the topographic boundaries of the Western Rocky Mountains and the Eastern Appalachian Mountains, a basin spanning 32 U.S. states and two Canadian provinces. This MRB is a planar surface for absorbing and converting solar energy. This regional section of the Earth’s surface receives 1072 TW (See Figure 1.) of incoming radiation. From which 340 TW, almost a third, is reflected back into space, by clouds, by atmospheric scattering, or by reflection off of bright surfaces. Of what remains, 733 TW is absorbed by this region of the Earth system and forms the basis of all of its energetic processes. Of this, 246 TW of energy is in a form unavailable for use as it is absorbed by the atmosphere. This reduces the solar energy available at the basin’s surface to 486 TW, the basis of the region’s overall non-fossil energy availability.
If we allow a thought experiment, given the abundant surface area offered by the MRB, how much energy could be diverted for human use if the entire basin were carpeted with cutting-edge photovoltaics (PV)? Theoretically, it could be possible for 73% of the solar energy reaching the surface of the MRB (609 TW) to be converted into electrical power using PV (Kleidon, 2016: 310). Disregarding other constraints, in this situation in which the MRB is hypothetically covered in PV, the region could theoretically yield 444 TW of electrical energy (73% of 609 TW). Such a figure is more an illustration of the magnitude of the potential affordances of solar energy rather than an achievable outcome, as of course, PV’s significant areal needs would prohibit other forms of land use (Smil, 2015: 51–54). Even so, this abundance suggests solar is the most promising terrestrially available energy source.
The potential use of solar energy is moderated by extant land use. Data from the latest National Land Cover Database (Dewitz, 2019) indicates that 7% of the area within the basin consists of open water and wetlands, 21% is forested and is excluded from our estimated potential PV development to avoid the loss of, amongst many other things, its role as a carbon sink, or as a support for other ecosystems or ecosystem services. Around 5% of the land is developed surfaces of various densities, settlements, and infrastructures which (if able to support PV) could be included in the total PV potential. Agricultural land corresponds to around 37% of the total MRB’s surface, the majority of this is cropland, 28% of the total, the rest being pasture. Finally, around 9% of the MRB corresponds to barren and shrubland and 21% to herbaceous vegetation. If the deployment of PV in wetlands, forests, farmland and areas of herbaceous vegetation were discounted (86% of land use) and it was deployed solely on developed surfaces and barren shrubland (14% of land use), the theoretical potential for PV use remains high at 62 TW. In fact, this power potential is more than three times greater than annual energy use at a planetary scale (18 TW), a rate already associated with significant shifts in Earth system processes. It should be cautioned that deriving electricity from solar energy at this magnitude may alter planetary dynamics in a manner that would exceed current anthropogenic impacts (Bardi, 2016: 5).
In reality, areal constraints and extant land-use patterns contribute to the fact that, as of 2017, the installed solar power capacity in the MRB stood at 0.0046 TW of which 0.0013 TW was derived in practice (See Fig. 1). Disparities between the ‘nameplate capacity’ of installed technologies and actual power derivation apply to all renewables as a result of operational inefficiencies and intermittencies involved in their use. Despite such disparities, if we assume a PV capacity factor, a ratio between maximum output versus actual generation over time, of 20% (Miller and Keith, 2019), as is now state of the art, 1.8% of the region’s surface area would be needed to be equipped with panels to meet the ≈ 1.15 TW of energy currently diverted for anthropogenic use in the MRB each year. 8 PV could be deployed in developed areas, such as the built environment, in which additional impacts will be minimal and transmission and installation costs comparatively low (Hernandez et al., 2015). Moreover, PV-equipped land surfaces can have multiple uses, such as the ‘agrivoltaic’ installations in which the technology acts as collateral infrastructure, offering benefits from off-grid power, grazing space, shade, and protection for specific photosensitive crops (Dupraz et al., 2011).
Solar energy availability increases southwards. If the MRB is subdivided into states, some clearly have more installed capacity for solar-derived power (Colorado, Minnesota, Indiana) than others (North Dakota, South Dakota, Wyoming) irrespective of overarching solar geography. Colorado produces the greatest amount of PV power in the MRB, while Minnesota and Indiana produce significant quantities despite comparatively low solar energy availability. As shown in Map 2, the location of installed solar capacity has little correlation with solar potential. Installations clustered in Minnesota could result from the State’s relatively strong support for community-owned PV (Funkhouser et al., 2015: 98). Policies such as the Renewable Portfolio Standards (RPS) mandate that a certain percentage of a state’s energy supply must come from renewables, and can support PV and other low carbon energy infrastructure (Carley et al., 2018). Given that seven states within the MRB have no such policy, and six of these states lie within areas of high solar potential, opportunities for such policy-driven support for increased solar power capacity appear possible. 9
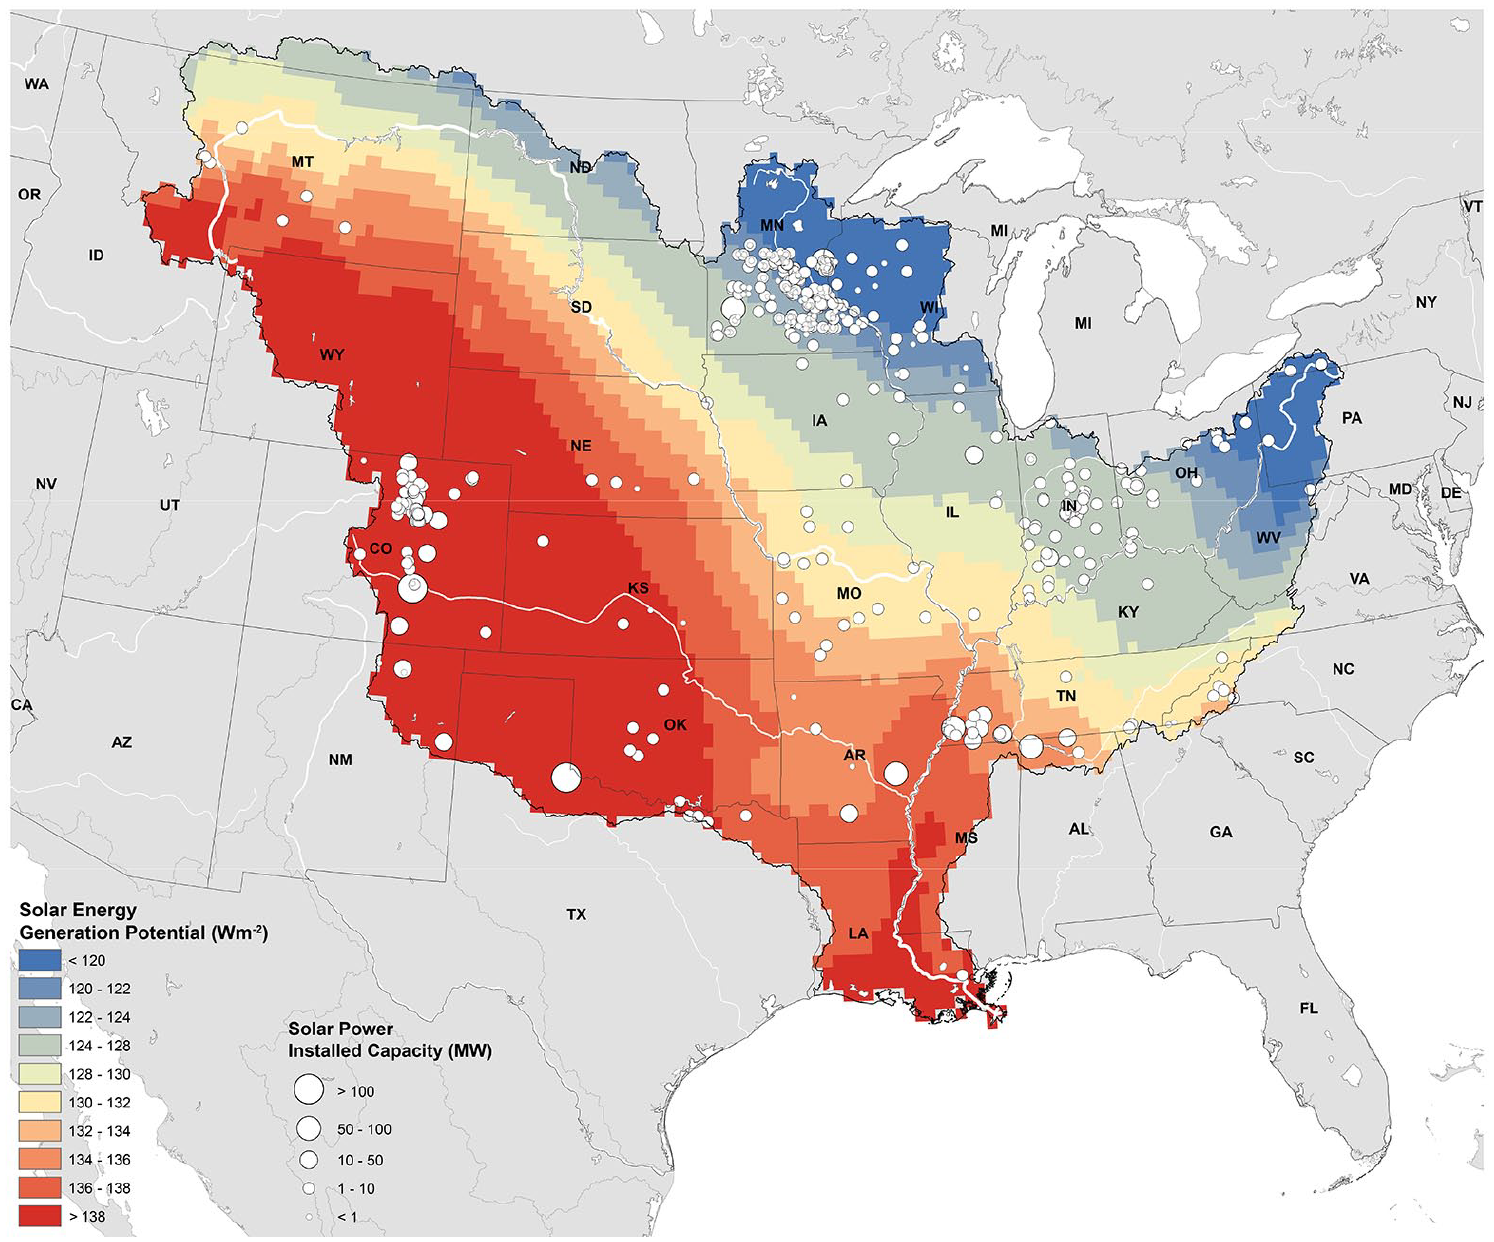
Solar energy generation potential (W m−2) and solar power installed capacity (MW).
Available wind energy and its anthropogenic diversion in the MRB
As the sun heats the basin’s surface, it also warms the air above it, causing it to rise and converting around half of the energy input it provides into turbulent heat fluxes. This refers to the convection caused by the influx of solar energy, either by condensational heating (moist convection) or by land surface heating (dry convection): the two impose limits on the total atmospheric energy availability (Kleidon, 2016: 167). These motive forces have encouraged climatologists to compare Earth’s atmosphere to an engine, where energy flows from the warmth of the planet’s surface to the cooler atmosphere, just as the heat of an engine flows from its combustion chamber to cooler surrounding air. Such temperature differentials dictate the maximum amount of work a given system can carry out, be it an engine or a planet (Kleidon et al., 2003). In the Earth system, the motion of such heat fluxes is constrained by the difference between the temperature of the surface and the atmosphere. Only a fraction of these fluxes can be converted, this percentage is dictated by the temperature difference divided by the surface temperature, around 10%. This means just 28 TW of the 260 TW of heat fluxes are converted into kinetic energy, creating updrafts and driving the hydrological cycle: while a large quantity of this energy is diverted into water vapour (See Fig. 1). But a large part of this movement, wind, occurs in the middle section of the atmosphere, where Earth’s surface does not act as an impediment. This kinetic energy is eventually brought down by convection and changing velocity gradients, where it is converted back into heat as a result of the friction encountered when it reaches Earth’s surface at lower speeds (Miller et al., 2011, 2015).
As wind energy reaches Earth’s surface, some of it is available as usable energy. The magnitude of this can be estimated by computing surface dissipation from wind speed and turbulent stress in the lower 100 meters of the atmosphere, about the average height of a modern wind turbine. It has been suggested 26% of this wind energy can be extracted for human use (Miller et al., 2015). On this basis, we calculated a theoretical wind power potential of 1.75 TW for the region. 10 As it stands, there is already an installed wind power capacity of 0.06 TW, from which around 0.0414 TW is successfully converted into electrical energy (See Fig. 1). Cleary the exploitation of potential wind power within the MRB can increase an order of magnitude before approaching limits to total wind availability. A limiting factor is that massed installation of turbines can reduce overall windspeeds by diverting a proportion of the atmosphere’s kinetic energy and lowering the gain of each additional turbine. Such incremental reductions in overall energy availability must be accounted for in evaluating the total wind energy potential of the MRB, as in any other region (Miller and Kleidon, 2016).
As with solar, opportunities for increasing wind energy potential with policy appear possible. Currently, a large proportion of regional wind power derivation takes place in the windswept Midwest, concentrating around the states of Iowa and Illinois. Iowa in particular ranks second in the U.S. (only below Texas) in installed wind capacity. This reflects an almost forty-year history of supportive legislation. Incentives such as tax breaks for wind power investment have been combined with regulatory frameworks, including RPS policies mitigating production risks (Righter, 2011: 38). Moreover, given wind turbines’ relatively minimal land requirements, wind farm development has not competed with the agro-industrial crops of corn and soybeans so much as added an additional layer of productivity to the landscape, and a welcome additional source of income for farmers. However, as shown in Map 3, despite a wind power potential comparable to that of the Midwest, Southern-Eastern MRB states (Kentucky, Tennessee, Indiana, Ohio) do not make significant use of wind power capacity. Moreover, the location of facilities in mountainous states is not always optimal. In Colorado, for example, turbines are situated in sites of low wind power potential, with explanations ranging from prohibitive windspeeds, difficulties in turbine installation, transmission problems and resistance from utility companies (Janke, 2010). Irrespective, this simple mapping exercise suggests considerable opportunities exist to increase wind power exploitation across many sections of the region.
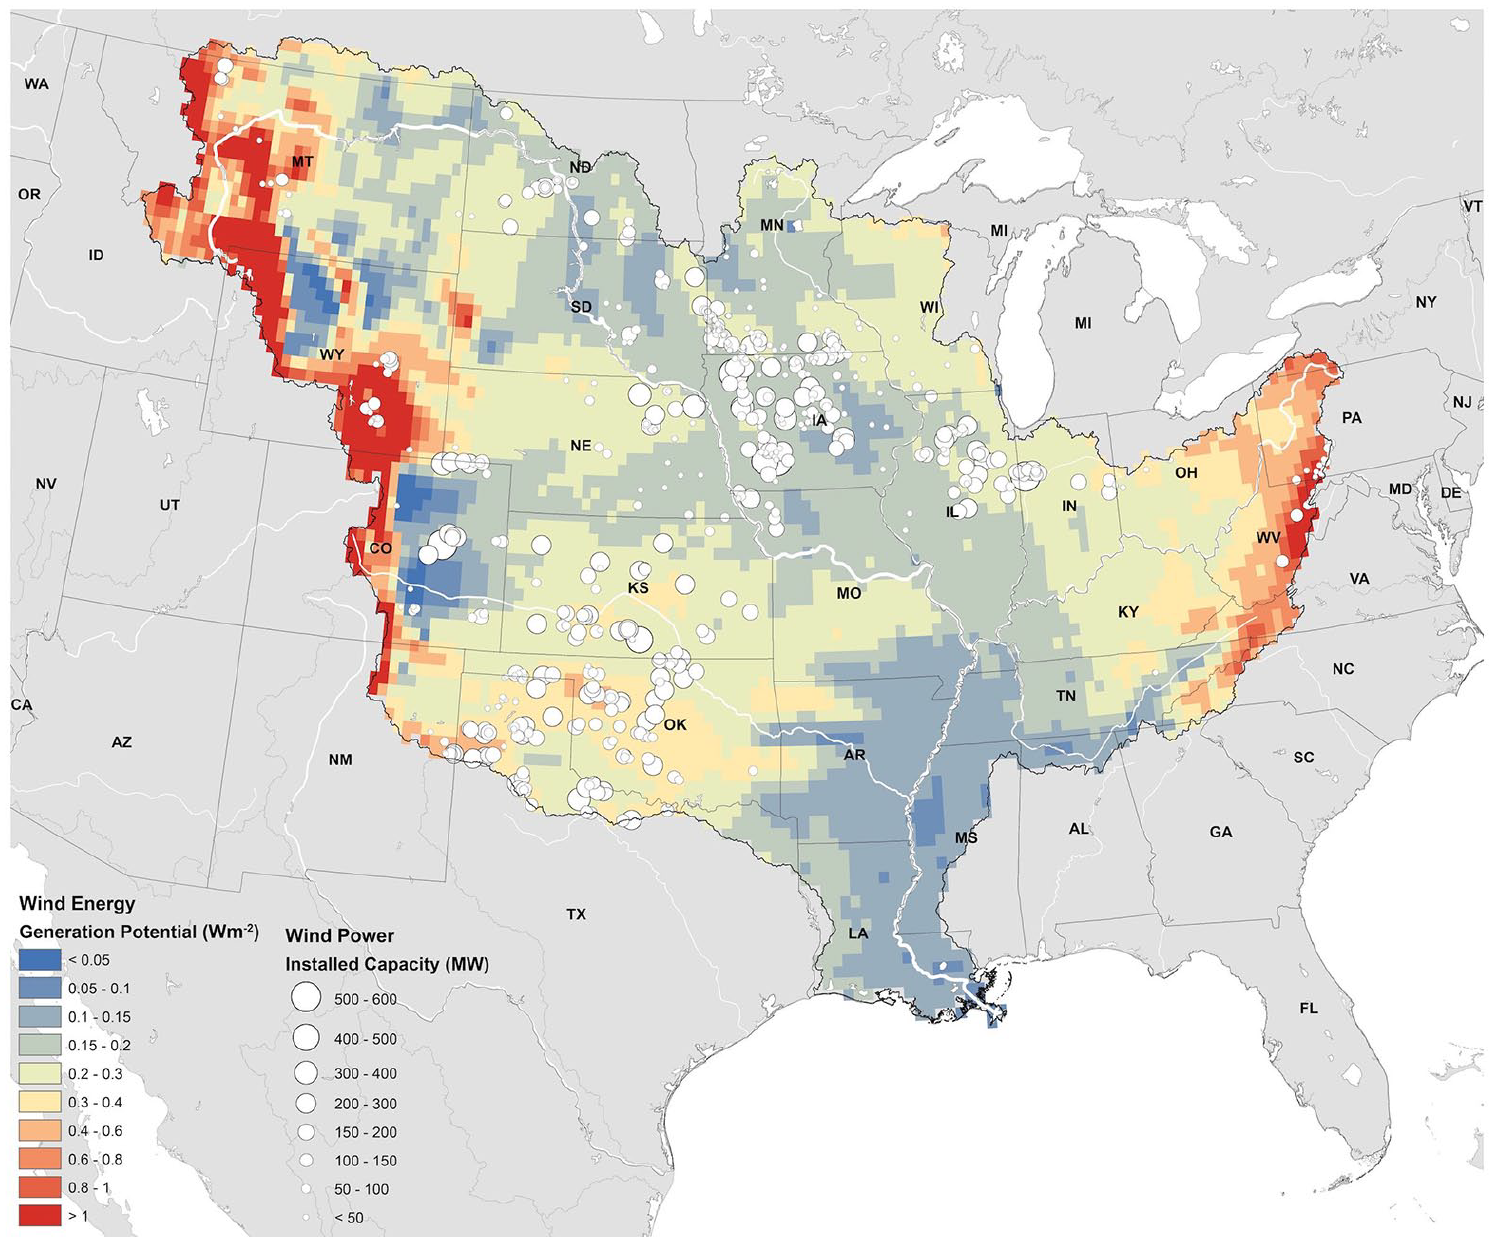
Wind power installed capacity (MW) and wind energy potential (W m−2).
Available hydropower energy and its anthropogenic diversion in the MRB
The atmospheric motion caused by solar radiation not only drives wind but also the hydrological cycle. Evaporation draws water into the atmosphere, consuming a proportion of terrestrially available solar radiation. Atmospheric motion is required to transport the moisture towards land. When air rises and cools it eventually condenses to form clouds. Condensation may persist according to changes in topography, airborne particulates, air temperature, or air pressure, such that large clouds can accumulate and precipitation may follow. Where precipitation reaches the land surface, its mass and elevation above sea level dictate the theoretical potential energy of that catchment area’s surface water (Leopold and Langbein, 1962). Given the topography of the MRB and the precipitation it receives, the theoretical physical limit for deriving power from the region’s surface water is around 0.5 TW. This figure is significantly reduced by runoff processes, such as infiltration, drainage and flows into saturated and unsaturated soil, leading to a considerably lower availability of 0.07 TW of useful riverine energy. At present, nearly 0.02 TW of hydropower (0.0157 TW) is derived from the MRB’s rivers (See Fig. 1) and installed hydropower capacity (0.09 TW) exceeds the region’s riverine potential (0.07 TW), indicating hydropower use is here already close to its physical limit. 11
A related and important issue is that the development of dams has faced increased opposition due their impacts on ecosystems, hydrology and sedimentary processes (Goudie and Viles, 2016: 130–131). In recent decades, more than 1200 dams have been removed from U.S. rivers in an attempt to restore lost ecosystem and river system functions (Bellmore et al., 2017: 1164). If hydropower is to have a role in regional decarbonisation, it would be necessary to transition from environmentally damaging large-scale dams to small-scale modular facilities that would make use of some of the 50,000 existing U.S. dams currently not used for power generation (Hadjerioua et al., 2012). There are 291 such dams in the MRB which could be retrofitted for power generation and could contribute 0.0078 TW of additional hydropower capacity p.a. (Map 4) without additional impacts on river systems and their ecology.
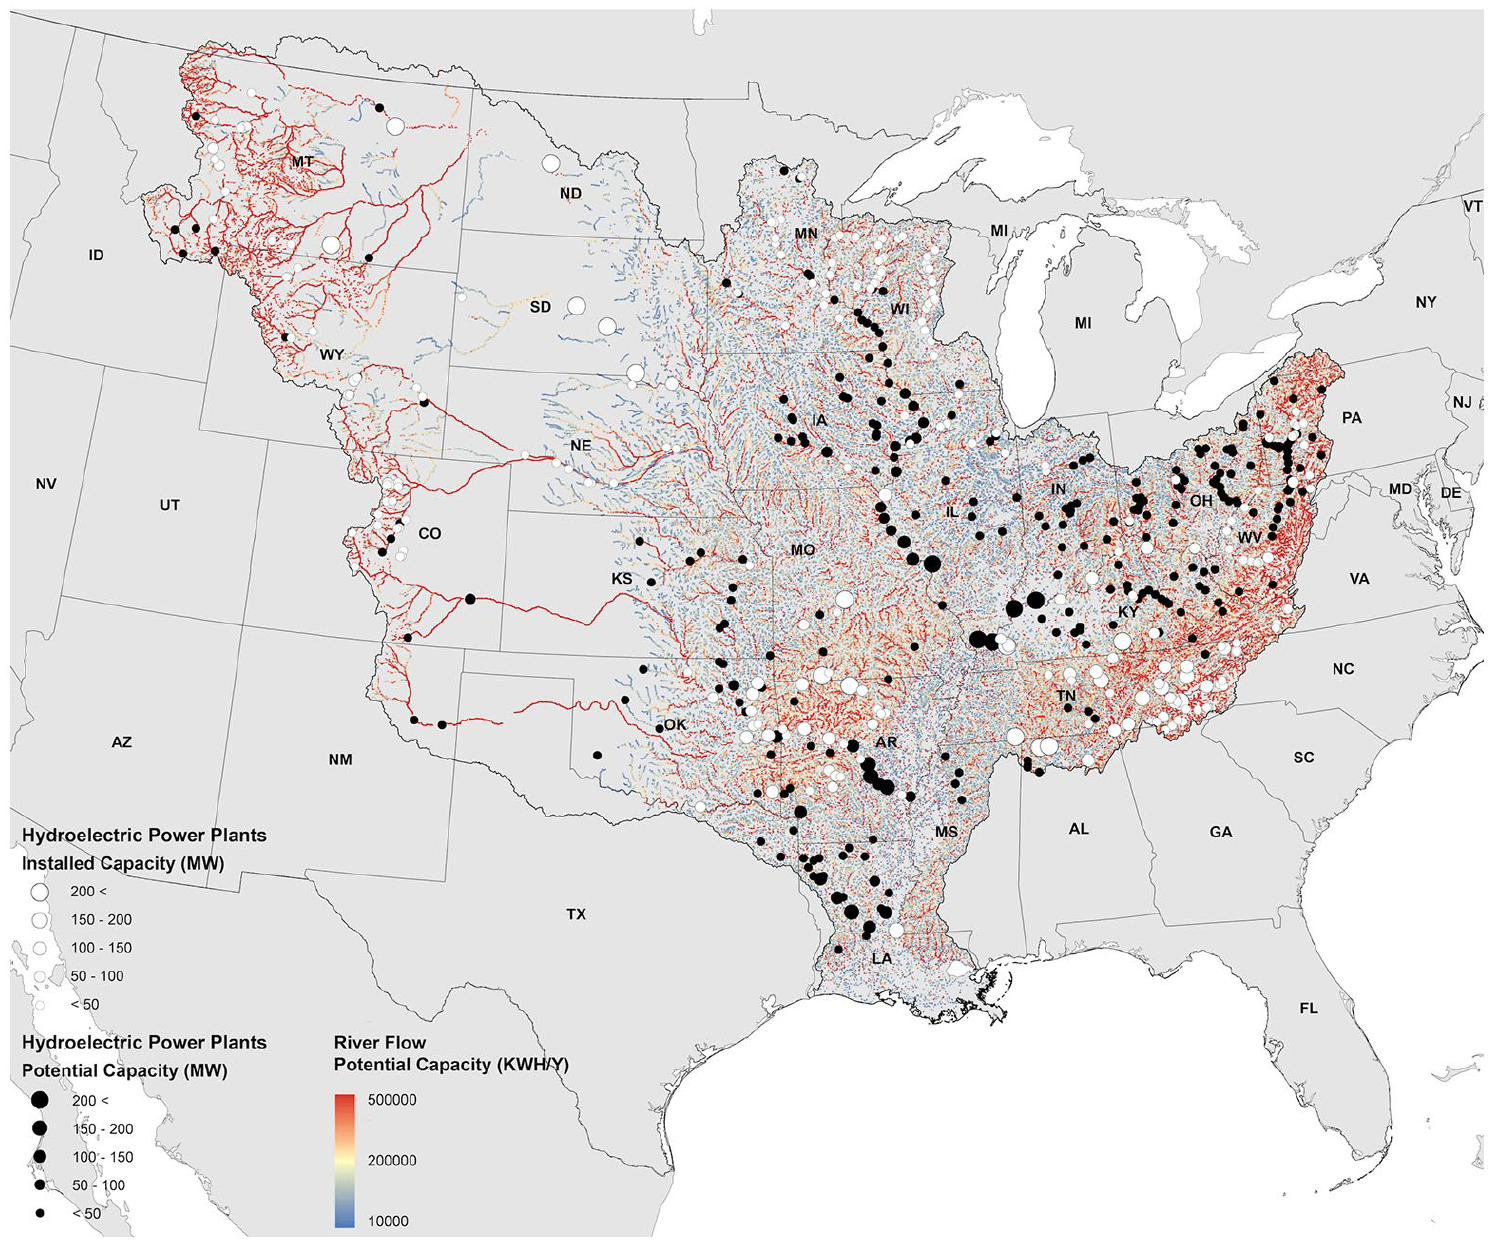
Installed capacity of hydroelectric power plants (MW, white circles) in the MRB and potential capacity for retrofitted hydropower plants (MW, black circles) superimposed on riverine potential hydropower capacity (kWh/a, red-blue gradient).
Biotic free energy availability in the MRB
The availability of wind and water, or abiotic sources of power, are joined by various biotic energy availabilities, the products of solar-powered organismic growth. As sunlight hits the basin, some of this radiative energy meets the leaves of plants. In each photochemical organism, reactions occur in which compounds from the Earth and atmosphere are used to create chemical energy that drives plant growth; most relevant is that carbon dioxide and water are converted into carbohydrates and oxygen. Photosynthetic energy conversions are constrained by the availability of sunlight, water and nutrients. Moreover, it is estimated that the maximum efficiency of photosynthesis is around 12%, but observable efficiencies tend to be less than 3% (Kleidon, 2016: 243). On this basis, a simple method for calculating the primary productivity of photosynthetic energy can be based on an observed linearity between plant growth and evapotranspiration. The amount of evapotranspiration taking place in a given area is taken as a correlate of the amount of carbon produced via photosynthetic growth, a metric termed ‘water use efficiency’ (Law et al., 2002).
Using this metric, we could engage in another thought experiment: we could imagine the MRB sown with the most efficient biomass producing crops available, meaning the upper limit of biotic productivity in the region would be around 7.3 TW. 12 Again, such a figure is theoretical. Alongside food and biofuel production, extant ecosystems require large quantities of incoming photosynthetic energy to maintain their functions. There are also problems posed by the use of large areas of land exclusively for crop growth, not least particulate pollution (Hill et al., 2019). As it stands, crop yield data, available for the year 2000, indicates that the entire basin actually afforded around 0.16 TW of biotic resources, of which 0.06 TW were diverted for use as biofuels, the component of this total we are concerned with (See Fig 1., Cassidy et al., 2013: 189). The outsized biotic productivity of this region is readily apparent: the MRB provides around 13% of the entire planet’s annual crop yield. 13 The distinctiveness of this region’s intensive biotic production is observable via remote imaging: the upper MRB, bisected by the ‘Corn Belt’ shows the highest summer chlorophyll fluorescence of any place on Earth (Mueller et al., 2016: 318).
A dense network of agricultural and energy converting infrastructure has been developed to generate and harvest this photosynthetic throughput. Corn and soybean fields are interwoven with bioenergy processing plants connected by freight railway corridors (Map 5). In the U.S. heartland, corn grain yields have increased more than eight-fold from an average of 1.3 tons per hectare (t/ha) in 1930, to a record of 10.6 t/ha in 2015. Soybean yields increased more than three-fold from 875 kg/ha to 3.2t/ha in the same period (Smil, 2019: 124–125). At what cost? As Smil notes, alongside hybrid and transgenic crop use, mechanization and petrochemically derived fertilizers have meant these productivity increases have been significantly fossil-fuelled. The most recent analysis shows that between 1991 and 2010 each bushel of corn (25.4 kg) grown in the U.S. required 50.39 British thermal units (Btu/bu) of fossil energy (Gallagher et al., 2016) and each bushel of soybeans (27.2 kg) required 39.88 Btu/bu (Pradhan et al., 2009). With an annual production of 13bn bushels of corn (330.2 bn kg), and bushels of soybeans at 3.5 bn (95.2 bn kg) in the U.S. for the year 2019 (USDA, 2020), these two crop harvests required respective additional inputs of 21.9 MW and 4.7 MW of fossil energy. 14 These numbers are merely indicative, as additional fossil energy is used almost all stages of the agricultural process. Whatever the exact figure, these additional energetic inputs have allowed the agricultural yields of the MRB to move far beyond natural productivity levels. But this has meant, across the U.S., fossil-fuelled farming consumes finite stocks of energy to turn renewable agricultural land into non-renewable sites of temporary productive abundance that are now carbon sources rather than sinks (Lu et al., 2018).
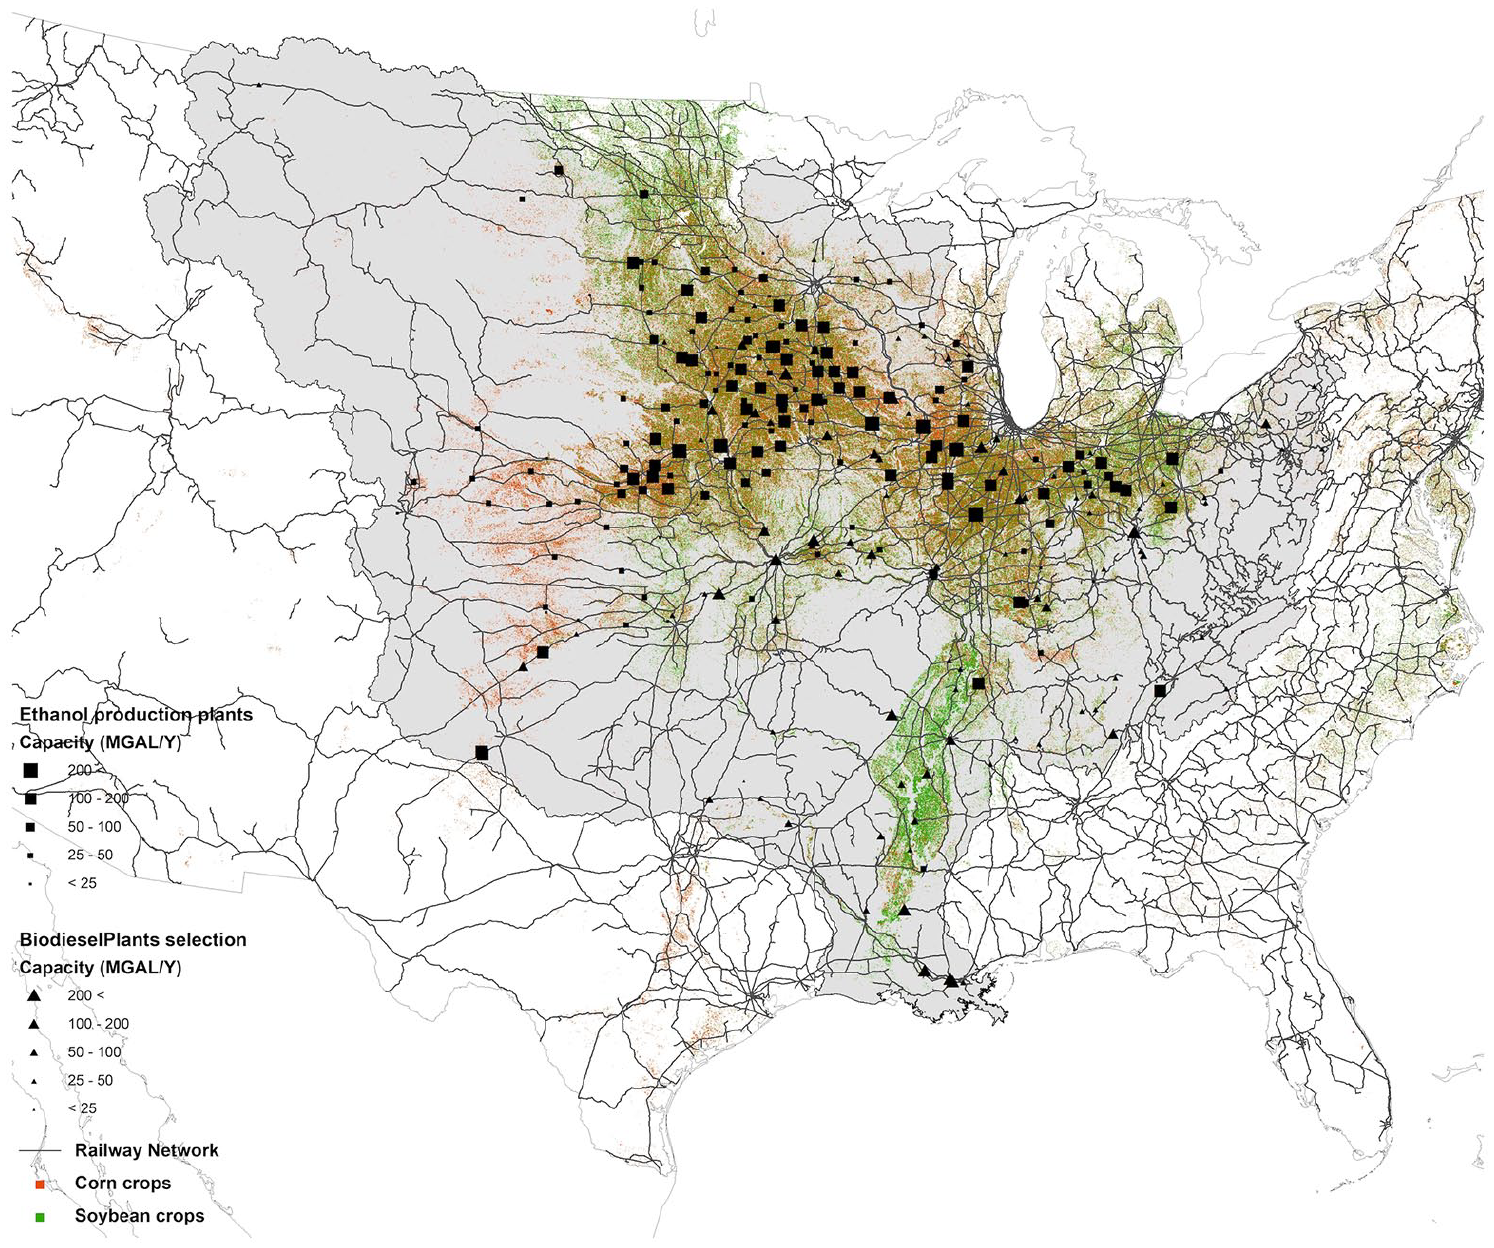
The fabric of industrial agriculture across the MRB: corn cultivation (red) and soybeans (green), biofuel production plants (black), railways (black lines).
What are these crops used for? An estimated 80% of the nation’s soy crop is processed into livestock feed and 36% of corn is used as animal feed (Foley, 2013; Manceron et al., 2014). Solar and fossil energy is converted into biomass, around 60% of which is turned into animal proteins. Like all energy conversions, losses occur at each stage, with the result that the total rate at which the energy of crops is converted into animal protein is around 7% to 8% (Shepon et al., 2016). Furthermore, around 20% of soy and 40% of the corn crop becomes biofuels: soybean biodiesel and corn grain ethanol (Cassidy et al., 2013; Foley, 2013). The efficacy of biofuel production is contested, depending on the boundary conditions of energy analysis (what if groundwater pumping or pesticide production is included for example?). Studies can demonstrate that biofuel conversion is a process that consumes more energy than it produces, other studies show credible energy returns on energy invested (Lewandrowski et al., 2020; Malins and Searle, 2019). Whatever estimate is made, the entropy law dictates any additional process of energy conversion, be it livestock farming or biofuel production, can only cause losses in overall energy availability. Given the scale of additional conversions, though the Midwest could theoretically feed 16 people per hectare of farmed land, the rate of delivered calories feeds just 5.4 (Cassidy et al., 2013: 2). While our emphasis has been on biofuels, it is clear plant-rich diets would increase biotic conversion efficiencies and overall calorie delivery, reducing agricultural fossil fuel use and aiding decarbonisation (Hayek et al., 2021).
The MRB and Gulf of Mexico as a fossil fuel habitat
For much of the Holocene the MRB was a region in which people made almost exclusive use of the Sun’s energy (Odum et al., 1987: 13). Foraging, hunting, and early agriculture meant that, besides firewood, human labour was the primary energy source. Only low-impact energy diversions occurred via dam building, pyro-agriculture, and animal tracking (Mueller et al., 2020; Nye, 1998: 16). Following European colonization, anthropogenic impacts appeared to increase an order of magnitude (Knox, 2006). The first recorded steam engine arrived in North America in 1753 (Pursell, 1969: 5). By 1838, two thousand coal-fired engines were in operation in North America (Hunter, 1980), each capable of exploiting the fossilised remains of hundreds of millions of years of photosynthetic productivity (Arnold, 2013; Dukes, 2003). Less than 150 years later, large coal fields in the central U.S. and Appalachian Mountains were being intensively exploited. As a result, by 1890 coal would come to rival and then dwarf the power diverted from renewable flows of energy in the U.S. (Righter, 1996: 35).
Much U.S. coal comes from within the MRB, between the Rockies and Appalachian Mountains (Odum et al., 1987: 4; Tully, 1996). It formed during the Middle and Late Pennsylvanian Epoch (315-298 million years ago), when the present U.S, sat at the Equator as Pangea formed (Correia and Murphy, 2020). As the continent took shape, in an oxygen-rich atmosphere densely packed tree-like plants that could grow over 50 meters tall grew alongside other biota in vast peat swamps (Cross and Philips, 1990; Waters, 2019). As sea levels fluctuated in response to phases of glaciation, such swamps were repeatedly flooded and dried out, inundating carbon-rich plant matter with sediment from rivers, deserts, and the ocean (Cecil et al., 1985), thereby burying carbon-rich peat and inadvertently altering the climate (Dai et al., 2020). In Eastern and Western parts of the MRB, peats were inundated by tectonic subsidence and accumulations of river and delta deposits, this force created heat and pressure that compacted it into coal (Cross and Philips, 1990; Waters, 2019), while Appalachian coal was formed predominantly as a result of tectonic activity (Cecil et al., 1985).
As well as coal, the MRB, and its precursor landscapes, acted as a habitat for accumulating and transforming organic matter into petroleum. 15 The Mississippi River has flowed south to what is now the Gulf of Mexico (GoM) since dinosaurs walked the Earth (Russell et al., 2021), channeling sediment, water, nutrients, and organic debris from the continent into the bucket-like GoM (Ewing et al., 1958: 1000–1001), The GoM was created by tectonic events in the late Triassic period and extends from North America’s southern coast to Southern Mexico, with an average depth of 3 kilometers in its abyssal plain (Ewing and Galloway, 2019: 627). Beaches, deltas, tidal flats, and coastal wetlands developed around the GoM through the Mesozoic and Cenozoic Eras, built up by influxes of nutrients and sediment deposited by rivers that predated the Mississippi (Blum, 2019; Russell et al., 2021), while the coast was periodically inundated by fluctuating sea levels (Ewing and Galloway, 2019). In such nutrient- and sediment-rich shallows, photosynthetically formed eukaryotic organisms and bacteria grew in abundance, while larger quantities of pelagic phytoplankton and bacteria grew in deeper waters (Mason et al., 2016; Kennicutt, 2017). When these organisms died, they sunk to the ocean floor and accumulated, sequestering carbon. Subject to sediment and tectonic activity, this organic material could break down into short hydrocarbon chains, first forming kerogen, then petroleum, and if exposed for long enough, natural gas. Both oil and gas are less dense than groundwater, and so travel upwards through rock and sediment and will bubble or ooze onto land, seabed, or surface water if allowed to rise unimpeded (Kennicutt, 2017). Petroleum reservoirs form when hydrocarbons are trapped underground. In the GoM, this can occur in subterranean salt domes, themselves the result of past sea-level fluctuations, which act as a permeable trap (Locker and Hine, 2020; Stow, 2010: 90).
As a result of these biogeochemical processes, the GoM has been described as one of the ‘foremost petroleum provinces in the world’, as oil-rich as the Arab-Iranian oil province or the West Siberian basin. In fact, it is estimated that the Gulf contains an estimated 9% of the world’s recoverable oil and 11% of its gas (Nehring, 1995: 446). On the surface of the water, occasional gas plumes and oil seeps can be observed. Pre-Columbian Karankawa people used this surface oil to decorate pottery and waterproof their boats, and Spanish colonialists used the tar that accumulated on shores to caulk ships (Kennicutt, 2017: 278). Following the installation of the first major offshore oil extracting platform in 1947, the GoM became one of the most developed offshore petroleum reserves in the world with around 4000 platforms, 35,000 wells, and 89,000 miles of pipeline tapping its reserves (Priest, 2007, see Map 6). As onshore petroleum production wanes, and if the destructive use of fossil fuels continues, a hydrocarbon-powered future will most likely depend on such offshore resources.
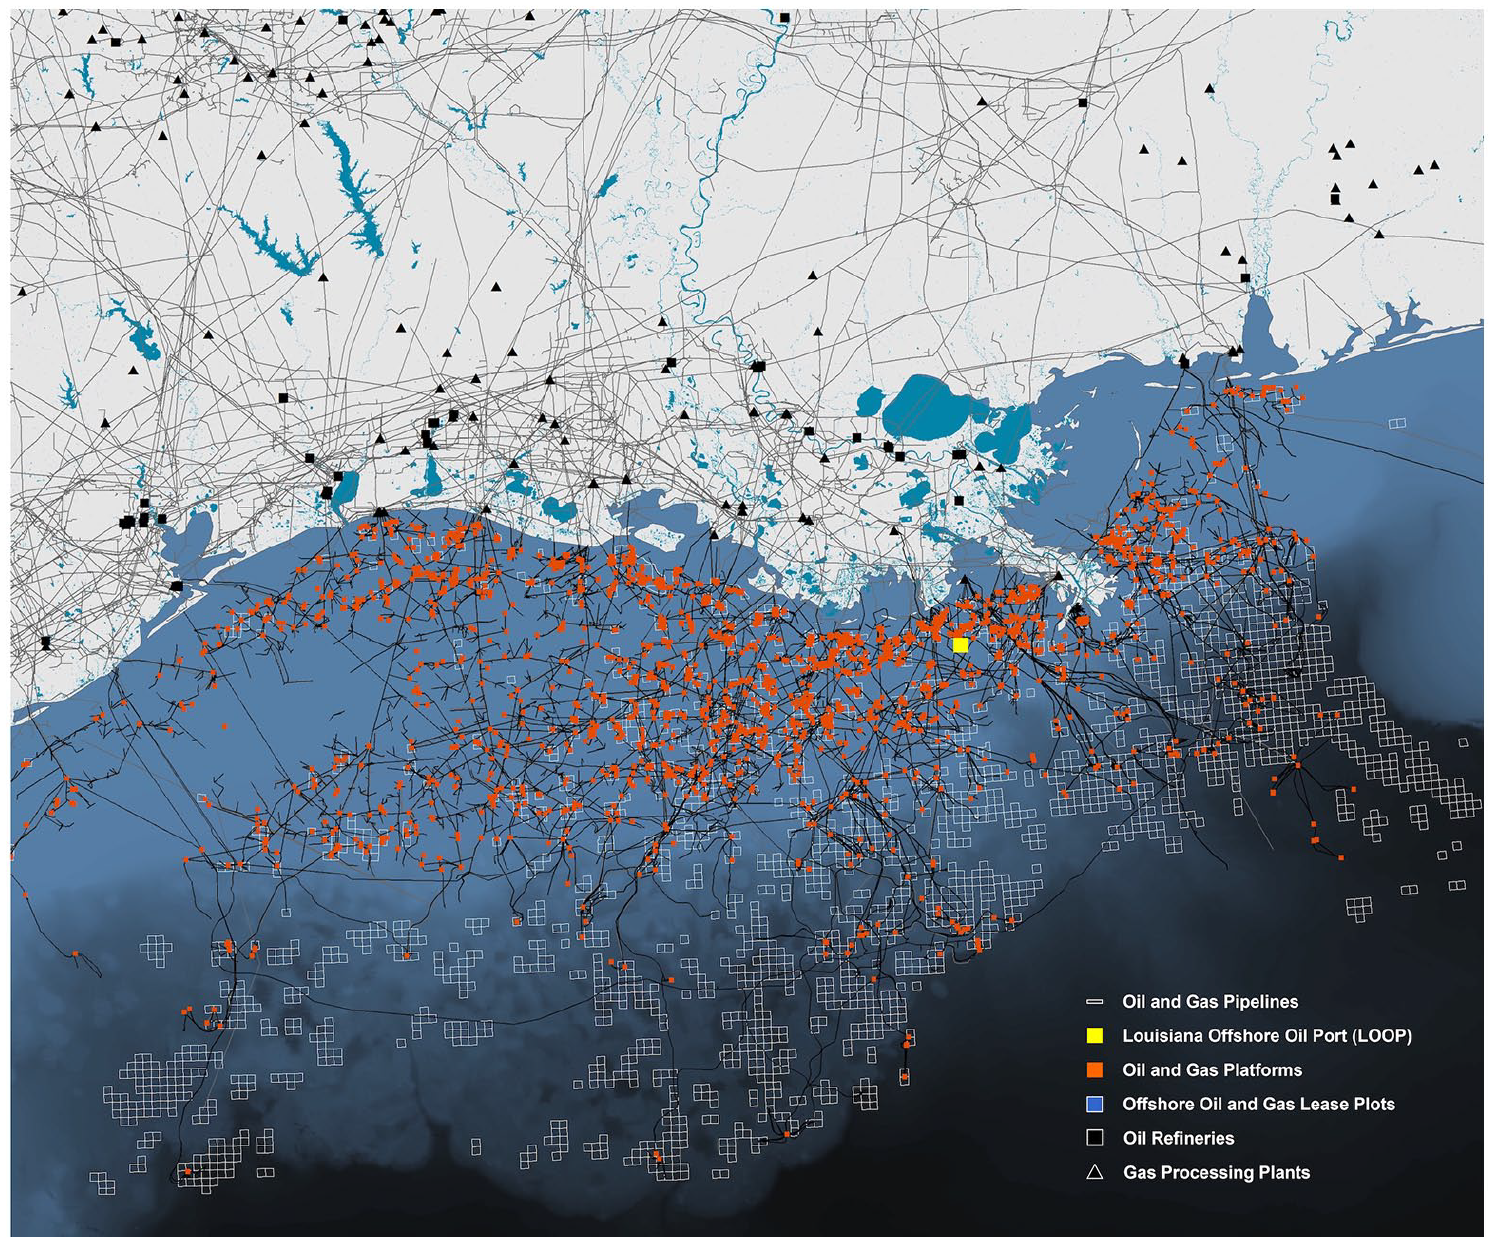
Offshore oil and gas infrastructure in the Gulf of Mexico: platforms (red), lease plots (grey lines), Louisiana Offshore Oil Port (yellow).
Where photosynthetic matter and organisms concentrate, as they do in river valleys, deltaic, lacustrine or deep-water environments such as the MRB and the GoM into which it flows, their fossilised remains offer a far denser energy source than conventional biomass (Kennicutt, 2017: 291). For example, wood can contain an average 6 MJ of chemical energy per kilogram, whereas bituminous coal has an energy density five times greater at 29 MJ per kilogram, and crude oil can be more than seven times greater at 43 MJ per kilogram (Smil, 1983: 77–78, 161). However, less than 0.09% of land-based photosynthetic material forms coal. For petroleum, derived from similar formation processes in marine environments, conversion rates are orders of magnitude lower, at 0.000093 (93 × 10−6) percent for oil and 0.000084 (84 x 10−6) percent for gas (Dukes, 2003: 38). But while they form inefficiently, over long timescales fossil fuels accumulate in vast quantities (McGlade and Ekins, 2015). Moreover, they are an effective means of energy storage, remaining useful for around 350 million years as opposed to between ∼1 and a couple of 100 years for most biomass fuels (Dukes, 2003: 38–40). Fossil fuels constitute finite ‘stocks’ of energy, while most other terrestrially available energies are ‘flows’, replenished by incoming solar energy, but impractical to store (Palmer and Floyd, 2020: 1–2). Recent advances in hydrogen and fuel cell technologies indicate improvements in storing and controlling such flows (Staffell et al., 2019), but since colonization, it has been those energy-dense and long-lasting fossil fuel stocks that have dominated anthropogenic energy use in the MRB (Odum et al., 1987: 12).
The predominant use of fossil fuels could continue. A recent assessment of the ‘undiscovered technically recoverable oil and gas resources’ (UTRR) within the U.S. owned section of the GoM estimates that the equivalent of 73.6 billion barrels of oil equivalent (BBOE) remain: 50% of the UTRR for the entire U.S. 16 Adding the amount that has so far been produced, the potential petroleum endowment of the Gulf of Mexico stands at 153 BBOE (Snedden and Galloway, 2019: 248). This stock of technically recoverable fossil energy, if fully exploited, could provide the U.S. with sufficient energy to meet its total primary energy consumption for 4.5 years at its current consumption rate, or provide 14 TW of energy. 17 This amount of energy almost equates to recent annual fossil-energy use at a planetary scale, at 15 TW (Bardi, 2016). This estimate does not include petroleum owned by other countries in the Gulf, whose reserves will of course further contribute to global climate change. 18 Moreover, it is clear that fossil-fuelled increases in radiative forcing at a planetary scale are creating localized feedbacks that are altering MRB dynamics, not least increased precipitation and flood risk (Nijssen et al., 2001). In effect, fossil energy use has made the Earth system more effective at storing incoming solar energy. As the climate warms the waters of the Atlantic and GoM it creates more frequent and destructive hurricanes on the Gulf Coast and its Mississippi Delta (Trenberth et al., 2018).
Moreover, the region’s fossil energy superabundance, though not solely consumed in the MRB, has done much to fuel energy-intensive production in the region and U.S. more widely. The refinery complexes of Louisiana, on the lower river, benefit from easy access to abundant oil and gas, and the extant infrastructures that shape carbon-intensive life. Not least, the GoM also plays host to both the U.S. Strategic petroleum reserve and Louisiana Offshore Oil Platform (LOOP), which since 1981 provides an offloading point for GoM petroleum and 12% of U.S. imported oil (Theriot, 2012). This intensely operationalised landscape continues to cause damage to human health and the local and regional environment, particularly in the Gulf, as occurred with the 2010 Deepwater Horizon oil spill, and along the lower river where petrochemical industries cluster and affect local air quality and human health (Colten, 2012). Among other petrochemical products, these industries produce vast quantities of plastics that are exported planet-wide, contributing to a novel cycle of damaging sedimentary material within the Earth system (Gabbot et al., 2020: 54; Jobin, 2020). This industrial geography partly results from Louisiana’s comparatively lax regulations, which allowed land between Baton Rouge and New Orleans to become informally designated as an expendable sacrifice zone, a ‘Chemical Corridor’ in which health has been ceded to profit and productivity (Allen, 2006; Colten, 2012; Steininger, 2021). De-fossilisation of both energy supply and industry would clearly be of clear benefit both locally and planet-wide.
Current Anthropogenic energy diversion and use and theoretical renewable energy potentials in the MRB.
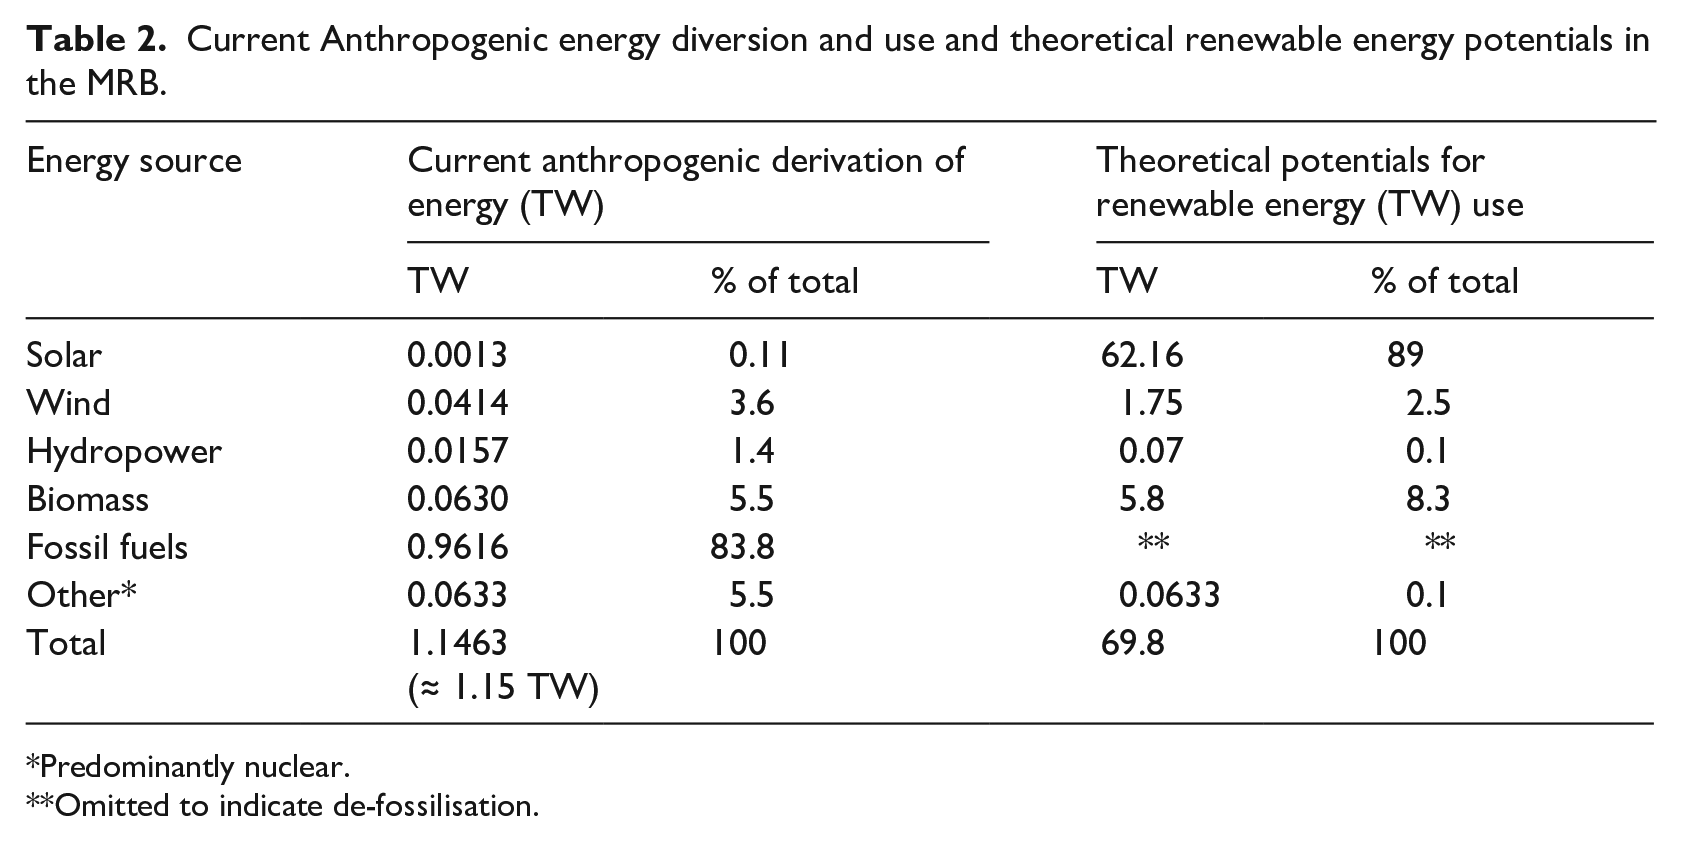
Predominantly nuclear.
Omitted to indicate de-fossilisation.
Human history has clearly played a role in reconfiguring the flows and stocks of available energy in the MRB. Pre-Columbian societies were subjugated by European colonization, which in turn triggered a dramatic transition toward the use of stocks of fossil energy, and this led to the acceleration of landscape operationalization and resultant increases in energy and resource throughput. Based on the estimates underlying this paper, today, the quantity of fossil and other non-renewable forms of energy consumed by humans within the MRB amounts to ≈ 1.15 TW (Fig 1., Table 1 and Table 2). With regard to the availability of regional non-fossil energy in support of de-fossilisation, makes it clear hydropower (riverine potential: 0.07 TW) alone cannot support de-fossilisation. Wind power (1.75 TW) and biotic energy (5.8 TW) are more promising, their increased provision could theoretically meet and greatly exceed anthropogenic energy demand in the region, though land and energy use conflicts are particularly acute with regard to the latter. This leaves the abundant potential of solar energy within the region, which if harnessed with PV could not only meet but extraordinarily increase anthropogenic energy availability. It is sunlight that offers the greatest and most obvious means for de-fossilisation, but deploying PV on a vast scale will likely impose environmental problems of its own (Bardi, 2016; Hernandez et al., 2014). Significantly, given its areal needs, PV also risks creating ‘green sacrifice zones’ in which the lands of indigenous and marginalized communities are one more expropriated in pursuit of growth (Zografos and Robbins, 2020: 543). Clearly de-fossilisation must be a just process. Moreover, historical analysis of past U.S. energy transitions demonstrates that their success depended upon adequate energy distributing infrastructure and the availability of intermediate technologies able to exploit new energy carriers (Suits et al., 2020; see also Map 1). The question is not one of just supply, but a system’s capacity for change.
Conclusion
This paper has provided a quantitative and descriptive account of the energy affordances of the Mississippi River basin. An attempt has been made to quantify the available and anthropogenic energy affordances of this distinctive region. In doing so, the aim has been to develop the concept of the energy region, to highlight the scale of energy-driven anthropogenic impacts in the MRB, and outline an analytical approach that provides a situated account of the thermodynamics of the Earth system which is of both local and planetary consequence. A second aim has been to show the geographical distribution of renewable energy affordances within the MRB. It is clear these do not always spatially cohere with installed capacities for the derivation of power and existing productive infrastructure. This exercise, though broad-brush, demonstrates the significant untapped potential for achieving de-fossilisation, from biomass and wind, but most notably from the deployment of PV technologies. Moreover, society’s commitment to using ever greater power use should also be reconsidered, as massed deployment of PV could involve further impacts upon planetary boundaries and its constituent regional systems, moving us far from known Holocene conditions. Given the risks wrought by fossil fuel use, the affordances of non-fossil energy, if over-utilized, would likely have similarly transformative effects on the Earth system.
In outlining the limits and affordances of this energy region, and in highlighting the interconnected aspects of this multifaceted system, the constraints presented by topography, land use, fossil fuel formation, and anthropogenic appetites for energy-intensive consumables have been touched upon. In doing so, the paper has argued that over the last three centuries, the landscape of the MRB has been significantly operationalised to direct ever-greater quantities of energy toward productive processes. The landscape has been transformed into a means for driving agricultural and industrial throughputs at an unprecedented rate. It has also been demonstrated that in a region so significantly affected by anthropogenic processes and activities, defossilisation of the energy system should not be attempted by imposing generalized technological solutions and overarching policies on a variegated space. The challenge is fundamentally geographic: i the region’s abundant alterantive energy flows must be more fully utilised in a site-sensitive manner which recognises the MRB as a component of a planetary thermodynamic system.
Supplemental Material
sj-docx-1-anr-10.1177_20530196211029678 – Supplemental material for Quantifying available energy and anthropogenic energy use in the Mississippi river basin
Supplemental material, sj-docx-1-anr-10.1177_20530196211029678 for Quantifying available energy and anthropogenic energy use in the Mississippi river basin by Thomas Turnbull, Maik Renner, Annu Panwar, Nikos Katsikis, Axel Kleidon and Alexander Schindler in The Anthropocene Review
Footnotes
Declaration of conflicting interests
The author(s) declared no potential conflicts of interest with respect to the research, authorship and/or publication of this article.
Funding
The authors received no financial support for the research, authorship, and/or publication of this article.
Supplemental material
Supplemental material for this article is available online.
Notes
References
Supplementary Material
Please find the following supplemental material available below.
For Open Access articles published under a Creative Commons License, all supplemental material carries the same license as the article it is associated with.
For non-Open Access articles published, all supplemental material carries a non-exclusive license, and permission requests for re-use of supplemental material or any part of supplemental material shall be sent directly to the copyright owner as specified in the copyright notice associated with the article.