
Abstract
We consider whether the Anthropocene is recorded in the isotope geochemistry of the atmosphere, sediments, plants and ice cores, and the time frame during which any changes are recorded, presenting examples from the literature. Carbon and nitrogen isotope ratios have become more depleted since the 19th century, with the rate of change accelerating after ~
Introduction
The Anthropocene, the term used informally to denote the current interval where humans have become a dominant force of global environmental change (Crutzen, 2002; Crutzen and Stoermer, 2000), is contentious. There is no doubt that humanity has left its mark on the planet. For example, humans now transport more soil and rock around the surface of the Earth than natural processes do (Wilkinson, 2005), CO2 levels have risen dramatically to the highest levels seen in at least 800,000 years (Keeling et al., 2005; updated: http://scrippsco2.ucsd.edu/data/in_situ_co2/monthly_mlo.csv; Lüthi et al., 2008) and humanity is implicated in causing rates of species extinctions to increase well beyond background levels (Barnosky et al., 2011). Consequently, a working group of the International Commission on Stratigraphy is set to present its preliminary findings in 2016 on whether the Anthropocene is distinctive and enduring enough to be defined as a new epoch and if so where the Holocene–Anthropocene boundary should be set (Foley et al., 2013; Gale and Hoare, 2012; Vince, 2011; Zalasiewicz et al., 2011). Ruddiman (2003, 2013) and Ruddiman et al. (2011, 2014) have argued the Anthropocene started in the early to mid Holocene, when they suggest land clearance and agriculture initiated changes in the composition of the atmosphere. Crutzen and Stoermer (2000), Crutzen (2002) and Steffen et al. (2011) have suggested a later date, in the late 18th or early 19th centuries, associated with the Industrial Revolution in Northern Europe. Alternatively, a ‘Great Acceleration’ in human impacts on the global environment has been suggested to have occurred ~
There is an urgent need to understand the impact humans have had on the global environment and when changes occurred. This review concentrates on wide-scale anthropogenic impact as recorded by isotope data from natural archives. Isotopes are different types of an element: they have the same number of protons but a different number of neutrons (e.g. Hoefs, 2009; Sharp, 2007). The ratio of one isotope of an element to another can vary through time depending on a host of environmental factors, meaning changes in isotope ratios can be used to reconstruct changes in, for example, climate, pollution and the composition of the atmosphere. In this review, we have selected the isotopes that previous studies have highlighted as important in tracking human impacts on the global environment. We show how isotopes record heavy metal contamination linked to technological innovations from Greek and Roman times onwards (lead isotopes), late-Holocene forest clearance and widespread fossil fuel burning since the onset of the Industrial Revolution (carbon isotopes), increased production and use of artificial fertilisers (nitrogen isotopes), acid rain (sulphur isotopes) and atmospheric nuclear weapons testing (caesium and plutonium isotopes). We consider how isotopes could contribute to the debate on where to set the Holocene–Anthropocene boundary.
Notation and standardisation of stable isotope data are summarised in Sharp (2007) and Hoefs (2009). δ13C represents the ratio of 13C/12C and δ15N the ratio of 15N/14N and are given in per mil (‰) relative to VPDB and AIR respectively. δ34S represents the ratio of 34S/32S and is given in ‰ relative to VCDT. Lead isotopes are measured against a variety of standards as reviewed in Komárek et al. (2008). The abundance of 14C (Δ14C) in a sample is given in ‰ relative to NIST oxalic acid activity corrected for decay (Stuiver and Polach, 1977). The abundance of radioisotopes such as 137Cs and 239,240Pu are measured in becquerel (Bq), with one Bq representing one decay per second (L’Annunziata, 2012).
Changes in the global carbon cycle
Human activity has altered the concentration and isotopic composition of the gases in the atmosphere. Rises in atmospheric methane (CH4) and carbon dioxide (CO2) are captured in gas bubbles in ice cores (e.g. MacFarling Meure et al., 2006; Rubino et al., 2013) ~5000 years ago and ~8000 years ago, respectively. Ruddiman (2003, 2013) and Ruddiman et al. (2011, 2014) have argued these increases were caused by humans, and this has led to the Early Anthropogenic Hypothesis, which argues anthropogenic effects on global climate began millennia ago and had it not been for human-induced greenhouse gas increases leading to global warming the climate would have cooled substantially during recent millennia. A key part of their argument involves using carbon isotopes to trace the origins of these increases in CH4 and CO2 to wetland expansion, linked to rice production, and to widespread forest clearance. δ13C of atmospheric CH4 (δ13CH4) from ice core bubbles from the late Holocene have values ~−47‰ to −49‰ (Ferretti et al., 2005; Mischler et al., 2009). While some argue that these low values of δ13CH4 could be explained by increased delivery of depleted (more negative) carbon from natural wetlands (e.g. Schmidt et al., 2004), Ruddiman et al. (2011) contend this would have been unlikely because of the drying in the late Holocene of northern monsoonal regions and the cooling of boreal regions, which would have reduced, not increased, CH4 emissions of natural wetlands. Rather, they suggest that δ13CH4 data could be explained by human emissions, with the observed mean of −48‰ satisfied by emissions from rice paddies (−63‰) and livestock (−60‰) and anthropogenic burning of grasses (−25‰). In terms of CO2, Elsig et al. (2009) argue that the very small decrease in the δ13C of atmospheric CO2 (δ13CO2) in the mid to late Holocene (before the Industrial Revolution), as atmospheric CO2 concentrations were rising, would limit the net terrestrial contribution to atmospheric CO2 during the last 7000 years to only ~5 ppm. Instead, there could have been large releases of CO2 from the oceans (Broecker et al., 1999; Ridgwell et al., 2003). However, Ruddiman et al. (2011) argue that Elsig et al. (2009) underestimate carbon burial in boreal peat, and if burial in peat over the last 7000 years was greater than Elsig et al. (2009) calculated then it would require far greater anthropogenic emissions, via forest clearance, to balance the δ13CO2 budget. The complexities of the carbon cycle mean the debate vis-à-vis the relative importance of human versus natural sources and sinks of carbon is complicated, and many researchers (e.g. Steffen et al., 2011) dismiss the plausibility of the Early Anthropogenic Hypothesis, but it is clear carbon isotopes are a key part of this debate.
As recorded in direct measurements from the atmosphere, in gas bubbles trapped in ice cores and in natural archives including tree rings (February and Stock, 1999; Stuiver and Quay, 1981), corals (Nozaki et al., 1978; Swart et al., 2010), foraminifera (Al-Rousan et al., 2004; Black et al., 2011) and marine molluscs (Butler et al., 2009), there has been a more substantial change in the δ13CO2 of the atmosphere since the 19th century, with the trend to lower values through the 19th century accelerating after ~
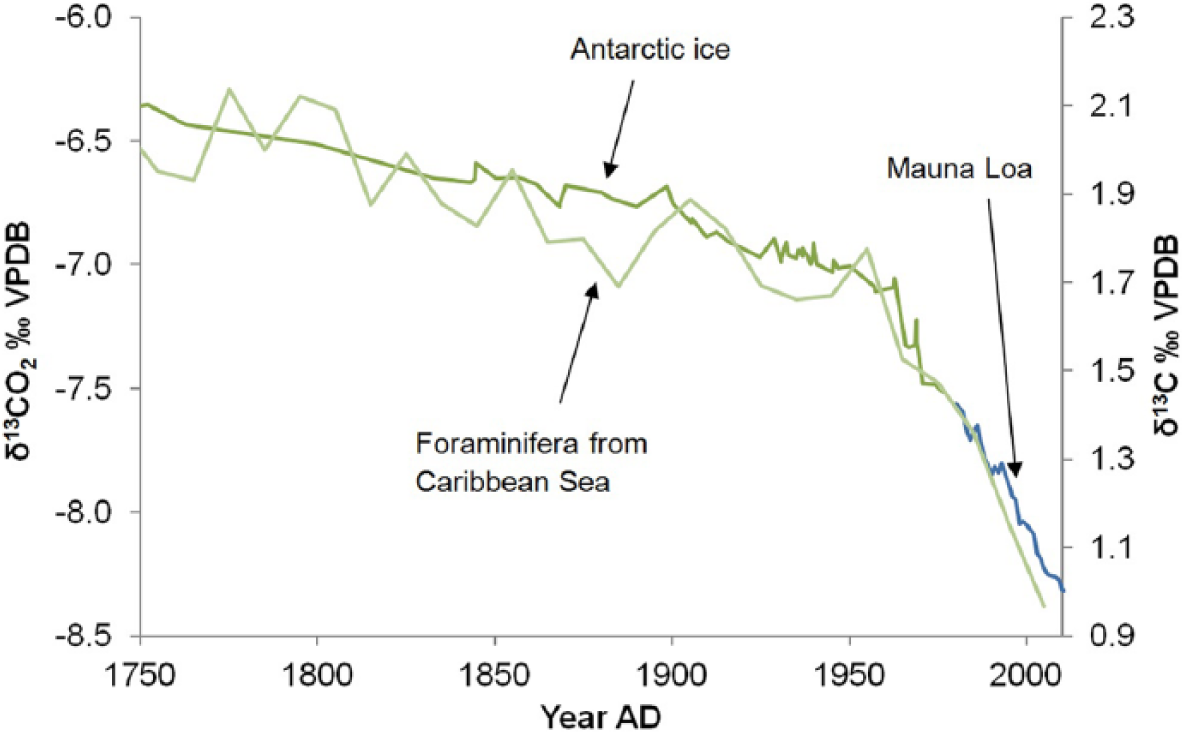
δ13CO2 from Antarctic ice core record (Rubino et al., 2013), δ13C record from foraminifera from the Caribbean Sea (Black et al., 2011) and δ13CO2 from the Mauna Loa monitoring station (Keeling et al., 2005; updated: http://scrippsco2.ucsd.edu/data/in_situ_co2/monthly_mlo.csv). The former two records show a gradual depletion through the 19th century and an acceleration after ~
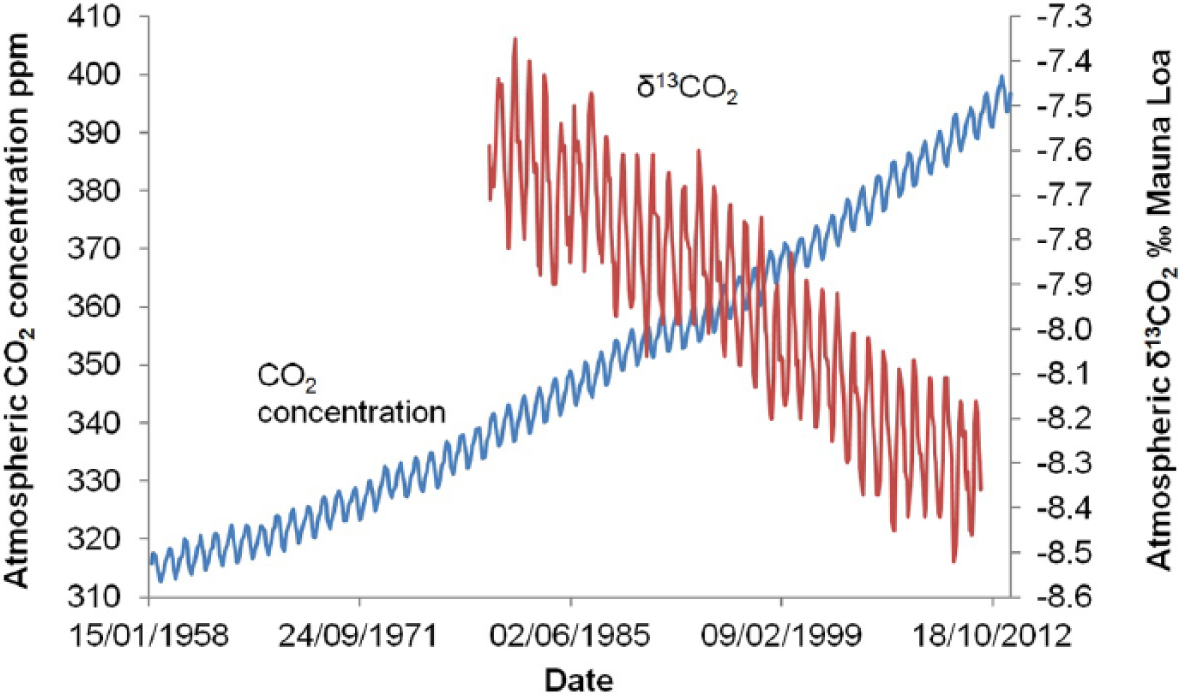
Monthly data from the Mauna Loa monitoring station (Keeling et al., 2005; updated: http://scrippsco2.ucsd.edu/data/in_situ_co2/monthly_mlo.csv) showing an increase in the concentration of CO2 in the atmosphere from 1958 and a decline in δ13CO2 from 1980 when monitoring of this began.
Changes to the nitrogen cycle
There have also been changes in the global nitrogen cycle, with increases in the amount of reactive nitrogen (nitrogen compounds such as nitrogen oxides that support biological growth) in the atmosphere, thought to be mainly due to the burning of fossil fuels and the use of fertiliser in agriculture (Galloway et al., 2004; Jaegle et al., 2005). As with carbon isotopes and the carbon cycle, δ15N can be used to track changes in the nitrogen cycle and identify the sources of the nitrogen released. Anthropogenic reactive nitrogen sources, especially fertilised soils (Park et al., 2012; Pérez et al., 2001), but also fossil fuel emissions (Felix et al., 2012), are generally thought to be depleted in δ15N relative to natural sources (although they can have highly variable values and some have argued δ15N from fossil fuel emissions is unlikely to be lower than that from natural sources; Sharp, 2007; Geng et al., 2014). In organic matter from remote lake sediments from across North America and the Arctic (Holmgren et al., 2010; Holtgrieve et al., 2011; Wolfe et al., 2013), and in nitrate (NO3–) from ice cores from Greenland (Hastings et al., 2009), there have been declines in δ15N from ~
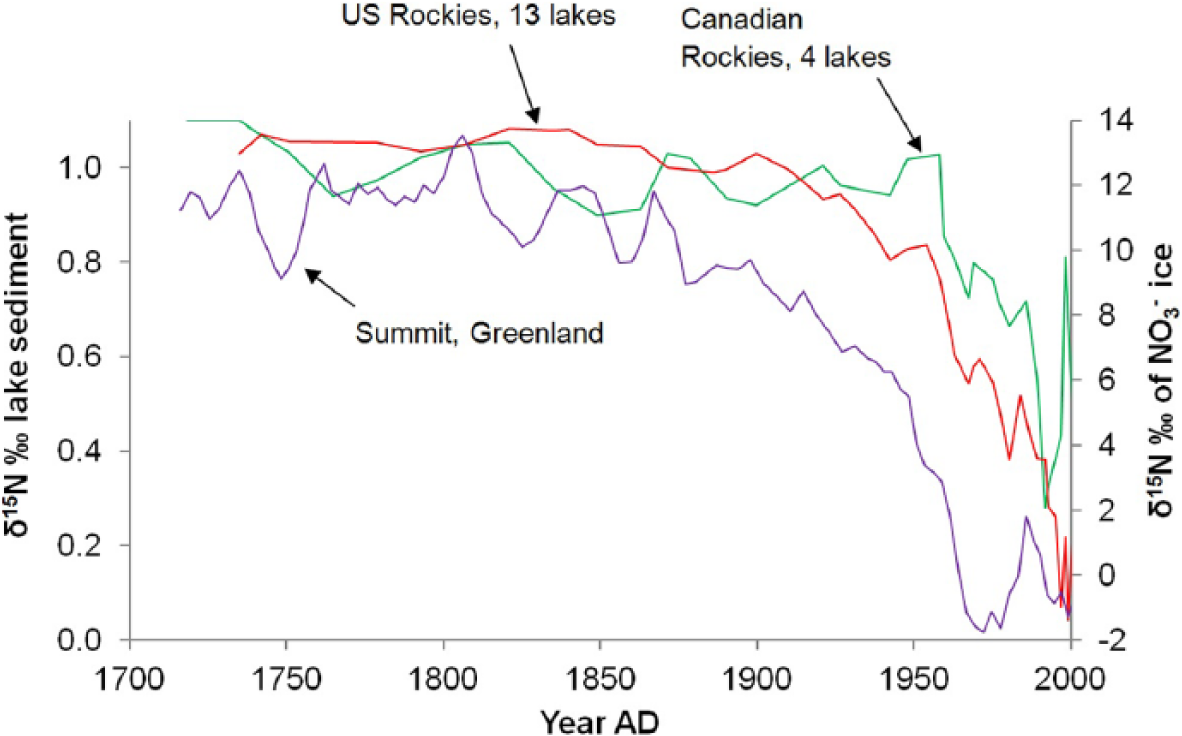
δ15N from organic matter from lake sediments from the US and Canadian Rockies (three-point moving average) (Wolfe et al., 2013) and from nitrate in Greenland ice cores (Hastings et al., 2009). Depletion occurs after ~
As with δ13C, while there is a decline in δ15N from the 19th century in many records, it is really after ~
Tracing pollution
As well as causing changes in the carbon and nitrogen cycles, human activity has caused pollution by remobilising certain elements. This can be traced using isotopes.
Lead isotopes
For millennia, humans have been mining and smelting lead ores, which has released vast quantities of lead into the atmosphere, causing widespread airborne pollution (Adriano, 2001; Settle and Patterson, 1980). There is evidence for lead contamination in Greenland ice cores, carried there in the atmosphere as microparticles, for over 2000 years (e.g. Hong et al., 1994; Rosman et al., 1997). Since different lead ores have different lead isotope ratios, it is possible to pinpoint where the lead was being mined. Rosman et al. (1997) showed that between ~150
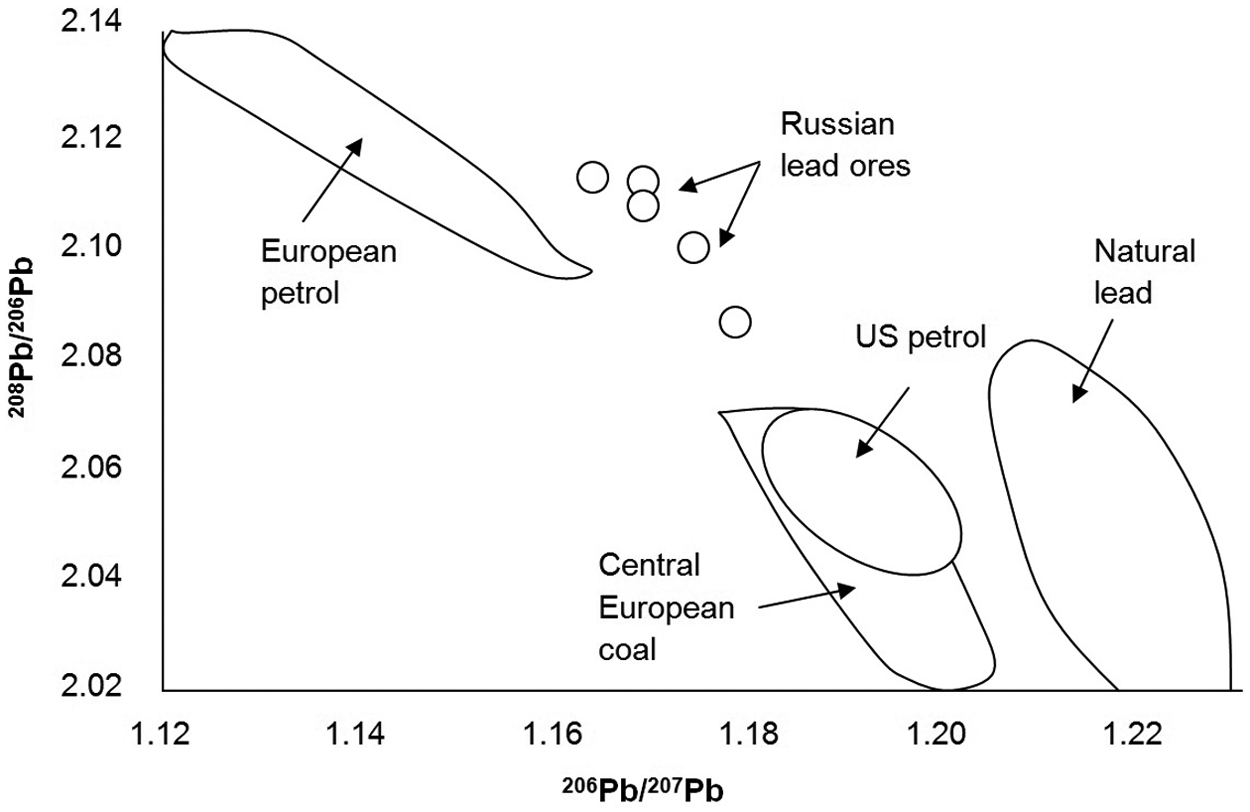
A 206Pb/207Pb versus 208Pb/206Pb plot showing the different isotopic compositions of selected lead sources. Modified from Komárek et al. (2008).
Trends in lead isotope ratios (especially 206Pb/207Pb) can also be used to track changes in pollution through time. For example, in Sweden, background 206Pb/207Pb is thought to be around 1.5, whereas atmospheric lead pollution derived from smelting, leaded petrol and burning of coal has a 206Pb/207Pb value of ~1.2 (Renberg et al., 2002). Lake sediments show there was a decline in the ratio in Roman times (to ~1.46), and then an increase to higher values in the Dark Ages ~
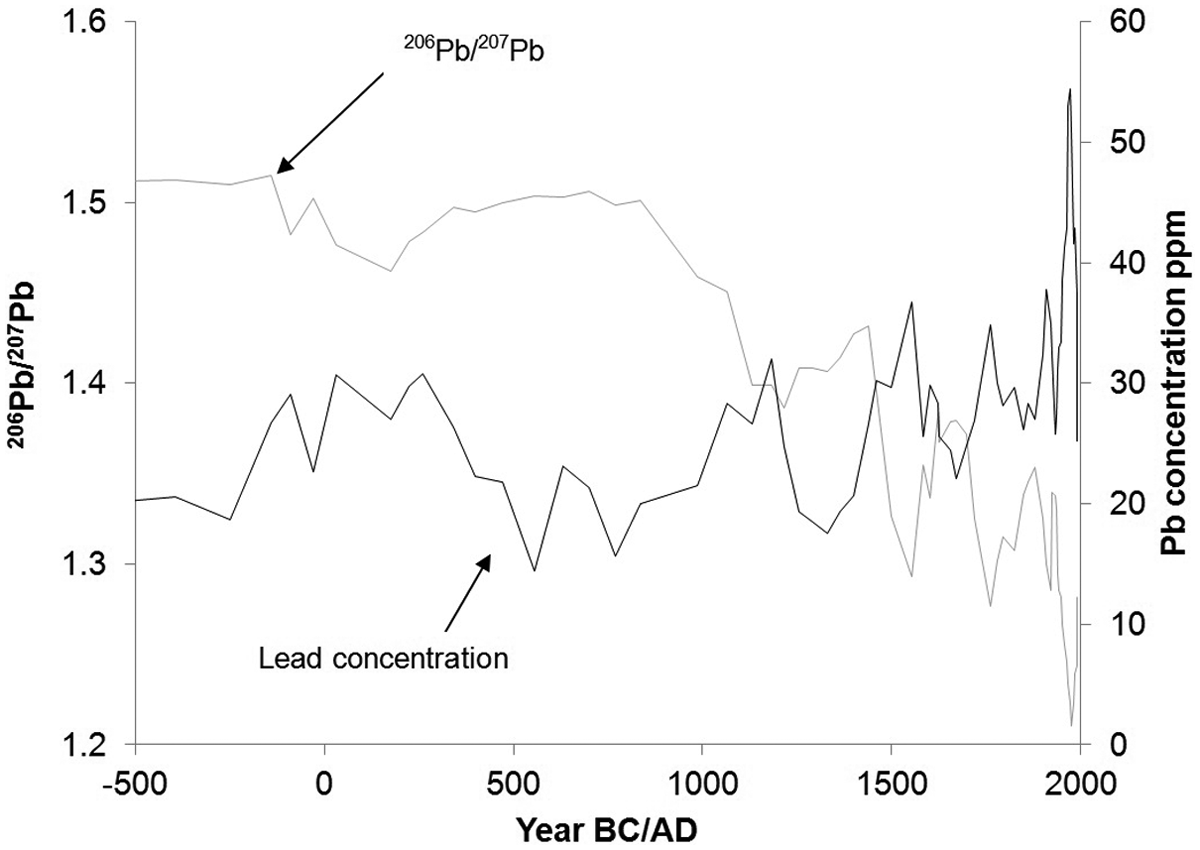
Trends in 206Pb/207Pb and lead concentrations from Lake Koltjärn in Sweden, with a depletion in the ratio taken to represent increased anthropogenic lead pollution (Renberg et al., 2002).
Sulphur isotopes
Sulphur isotope ratios can be used to track fossil fuel burning and to trace the sources of pollution because, as with lead isotopes, natural and anthropogenic sources often have different isotope ratios (e.g. Krouse et al., 1984; Lim et al., 2014). Sulphur released into the atmosphere has the potential to cause acid rain. Concerns over widespread ecosystem damage resulting from acid rain first gained prominence in Europe in the late 1950s. Tracing the sources of sulphur pollution is particularly important given sulphur compounds produced and released into the atmosphere in one country can travel across borders and cause acid rain in another (Metcalfe and Derwent, 2005). Yu et al. (2007) demonstrated how the δ34S of sulphate in meteoric waters from Chuncheon in South Korea vary from +2.6 to +7.5‰, which is significantly different from the δ34S of sulphate from locally combusted coal (−4.5 to −0.7‰). This was taken to suggest that sulphur implicated in acid rain in that region was not the result of local pollution. A decline in emissions over time from brown coal power stations in eastern Germany has been recorded in an increase in δ34S of rain in Wroclaw in Poland, demonstrating the effectiveness of measures taken to reduce acid rain resulting from anthropogenic emissions (Jędrysek, 2000). Indeed, global sulphur emissions are showing an overall decline (Klimont et al., 2013). This demonstrates that some anthropogenic impacts on the environment, in this case acid rain linked to sulphur emissions as recorded by δ34S, have peaked, at least in some parts of the world.
Radioisotopes
Some isotopes (e.g. 137Cs, 239Pu and 240Pu) occur on Earth almost entirely because of their production and release into the atmosphere from nuclear reactors and especially atmospheric nuclear weapons testing. They provide a rather precise stratigraphic point in geological archives, with detectable levels first apparent ~
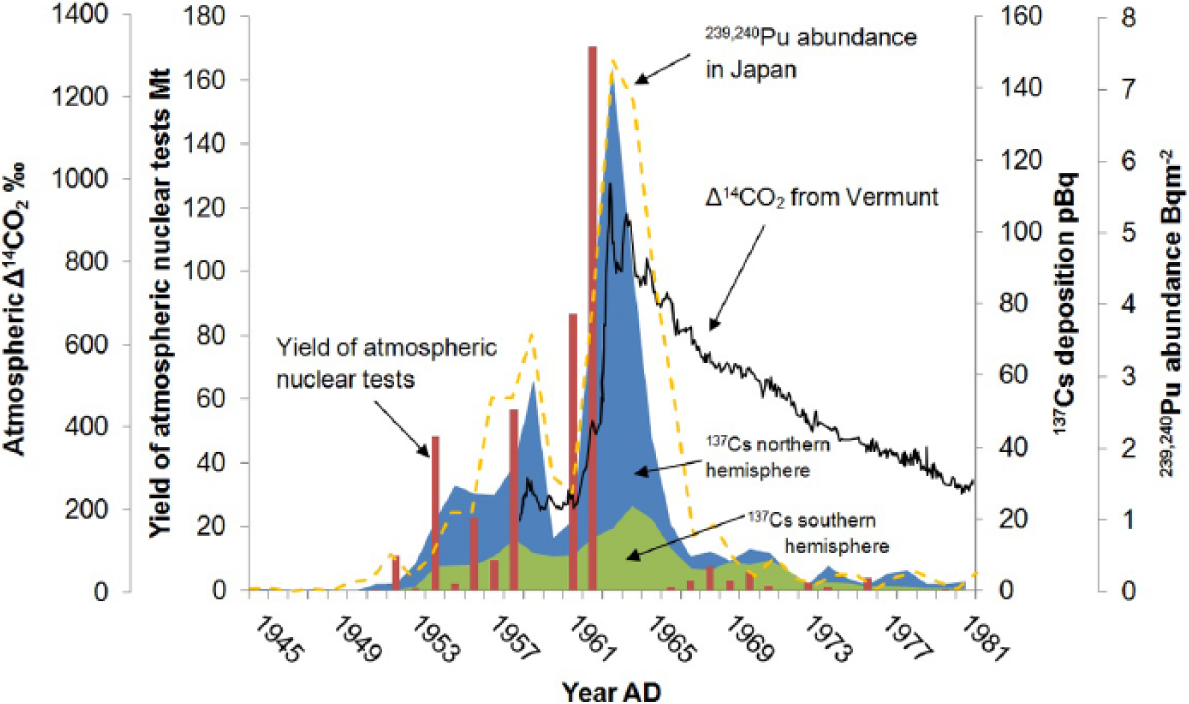
Yield of atmospheric nuclear tests per year shown by bars (UNSCEAR, 2000), 137Cs deposition in Northern and Southern Hemispheres represented by areas (UNSCEAR, 2000), 239,240Pu deposition in Japan shown by the dashed line (Hirose et al., 2000) and Δ14CO2 measured at Vermunt, Austria shown by the solid line (Levin et al., 1985). The yield of atmospheric nuclear tests in the atmosphere peaked in 1962. Δ14CO2 at Vermunt, 239,240Pu in Japan and 137Cs deposition in the Northern Hemisphere peaked in 1963 and 137Cs in the Southern Hemisphere in 1964.
Conclusion
Changes in isotope geochemistry demonstrate that humans are having an impact on the global environment. Different isotopes have recorded different anthropogenic impacts, and changes have occurred at different times and different rates. δ13C and Δ14C show the input of fossil fuel-derived CO2 into the atmosphere, δ15N records reveal a change in the global nitrogen cycle, lead and sulphur isotopes are tracers of human pollution histories and radioisotopes record the point at which humans mastered nuclear weapons technology. Some of the isotopes that we use to demonstrate human impacts, especially carbon and nitrogen isotopes, could also be influenced in similar ways by natural processes. This complexity has led to the Early Anthropogenic Hypothesis debate. On the other hand, other isotopes, especially radioisotopes, but arguably also lead isotopes, show a clear human imprint: in the case of certain radioisotopes their occurrence is almost entirely due to human-induced nuclear reactions and in the case of lead isotopes the ratios are changed in ways unlikely to be due to natural processes.
As for whether isotopes can contribute to the debate on where to set the Holocene–Anthropocene boundary, we have shown there is a clear acceleration in the trend to lower δ13C and δ15N after ~
Footnotes
Acknowledgements
Frank Oldfield and Jan Zalasiewicz are thanked for their invitation to write this review and three anonymous reviewers are thanked for their comments that improved the manuscript. We are also grateful to David Black, Alexander Wolfe and Ingemar Renberg for providing us with data to use in our figures and to Elsevier for permission to reproduce ![]() . This work is published with the permission of the Executive Director of the British Geological Survey.
. This work is published with the permission of the Executive Director of the British Geological Survey.
Funding
This research received no specific grant from any funding agency in the public, commercial, or not-for-profit sectors.