
Abstract
Background
Reliable and safe sedation is a prerequisite for endoscopic interventions. The current standard is rather safe, yet, an objective device to measure sedation depth is missing. To date, anaesthesia monitors based on processed electroencephalogram (EEG) have not been utilised in conscious sedation.
Objective
To investigate EEG parameters to differentiate consciousness in endoscopic propofol sedation.
Methods
In total, 171 patients aged 21–83 years (ASA I–III) undergoing gastrointestinal and bronchial endoscopy were enrolled. Standard monitoring and a frontotemporal 2-channel-EEG were recorded. The state of consciousness was identified by repeated requests to squeeze the investigator’s hand.
Results
In total, 1132 state of consciousness transitions were recorded in procedures ranging from 5 to 69 minutes. Thirty-four EEG parameters from the frequency domain, time-frequency domain and complexity measures were calculated. Area under the curve ranged from 0.51 to 0.82 with complexity and optimised frequency domain parameters yielding the best results.
Conclusion
Prediction of the state of consciousness with processed EEG parameters is feasible, and results for sedation in endoscopic procedures are similar to those reported from general anaesthesia. These results are insufficient for a clinical application, but prediction capability may be increased with optimisation and modelling.
Key summary
EEG-based anaesthesia monitors, like the Bispectral Index, have been investigated as an adjunct to monitor propofol sedation in the endoscopy ward. These studies showed very limited benefit. Capability of processed EEG parameters to differentiate the state of consciousness (SOC) in endoscopy is similar to general anaesthesia. However, artefacts arising from the less controlled endoscopy environment as compared to anaesthesia limit their use in sedation monitoring. The Bispectral Index and its underlying parameters are ineffective in the determination of the SOC in sedation during endoscopic procedures.
Introduction
Optimal conscious sedation is a crucial requirement for safe, patient-friendly and high-quality endoscopic procedures. Propofol sedation is the current sedation standard in Europe 1 , 2 and has proven to be safe, 3 , 4 but it has some drawbacks. 5 The most common adverse events are hypoxaemia and hypotension occurring in up to 7% of all procedures. 4 , 6 Additional factors such as sedation stability, contentment of the patient and endoscopist, and traumatic arousal are suboptimal.
Dedicated neuromonitoring systems have been established as a reliable indicator of the patients’ narcotic state in general anaesthesia. This equipment, however, cannot be transferred to conscious sedation procedures, as depth of sedation, applied medication and other factors influencing EEG interpretation (e.g. patients’ movement) differ profoundly. Consequently, attempts to deploy anaesthesia monitors in the endoscopy ward were unsuccessful.7–9 These monitors are based on processed EEG (pEEG) parameters for which ample research in the environment of the operating theatre exists. Knowledge on the performance of pEEG parameters in endoscopy wards, however, is very limited. 10 We performed this exploratory study to evaluate established pEEG parameters in their potential to differentiate the state of consciousness (SOC) during conscious sedation.
Materials and methods
We aimed to assess prediction accuracy of pEEG to predict the SOC in patients undergoing a variety of endoscopic procedures with propofol sedation. Therefore, we used an array of previously published processed EEG parameters from general anaesthesia to predict the SOC (conscious vs. unconscious). Prediction accuracy was measured as area under the curve (AUC) in the receiver operating characteristic (ROC).
Participants, inclusion and exclusion criteria
Patients undergoing endoscopies at our tertiary referral centre were considered for inclusion in the study. Adult patients with a planned endoscopy with an anticipated duration of over 20 minutes and capable of giving written informed consent were included. Exclusion criteria included impaired hearing, pregnancy, cognitive impairment as defined by a Glasgow Coma Scale ≤ 14 or psychic alteration, a structural or malignant brain disease, known allergies or intolerances to propofol or its components and a sedation regimen other than propofol sedation.
Sample size estimation to detect a 5% difference in mean prediction accuracy for the prediction of SOC based on available literature from general anaesthesia11–13 revealed the necessity of 6–131 observations (α = 0.05; 90% Power) for different pEEG parameters. The final sample size for this exploratory study was determined by the primary study goal as stated on the clinical trials register platform. As per protocol, the final sample size for this study was defined during data acquisition. Hence, the sample size given on the trials platform was not required and represented the maximum number of inclusions for which resources would have been available.
Patient monitoring
Standard procedural monitoring consisted of a one-lead electrocardiography (ECG), pulse oximetry and intermittent non-invasive blood pressure measurement. Furthermore, a 2-channel fronto-temporal EEG (Electrodes Neuroline 720, Ambu, Denmark) was placed in positions AT1-Fz and F7-F8 according to the international 10–20 system with Fpz as ground (Figure 1). For left-handed patients the placement was mirrored. Before standardised electrode placement, the skin was cleaned and degreased using alcohol wipes. Electrode impedance was monitored to not exceed 10 kilo-ohm. To record data, a patient monitor with an installed EEG module (IntelliVue MP40, Philips, the Netherlands) was used, and all data were transferred in real time to a personal computer equipped with the ixTrend Express Software (ixitos GmbH, Germany). During the procedure, clinical events were marked in the data stream by the investigator using hot keys to avoid synchronisation issues. The ECG was recorded at a frequency of 500 Hz, while EEG (125 Hz), pulse oximetry (125 Hz) and respiration (62.5 Hz) had a lower recording frequency. Blood pressure was recorded every 3 minutes. The recording of data started with application of the first propofol dose.
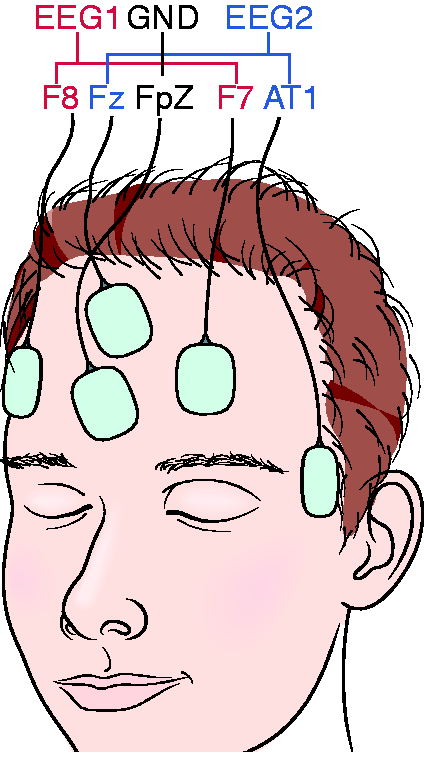
Electrode placement of the 2-channel frontotemporal EEG. EEG1: F8-F7, EEG2: Fz-AT1, Ground: Fpz. For left-handed individuals the electrode placement was mirrored.
Procedure
To evaluate the SOC during the procedure we used the isolated forearm technique: the investigator asked the patient to squeeze his hand at intervals of 30 seconds. If no response occurred, the request was repeated after 5 seconds. If the patient still did not respond, loss of consciousness was assumed and documented. Return of consciousness was evaluated in the same manner. Data recorded up to 30 seconds before a change in consciousness were disregarded in the analysis. The applied doses of propofol were recorded in real time. Here, the investigator did not interfere in the sedation procedure that was performed by a trained nurse according to the national German recommendations, which are very similar to European guidelines. 1 , 2 Recording was stopped when the patient was awake and had regained basic orientation after the procedure had ended, corresponding to a Modified Observer’s Assessment of Alertness/Sedation Scale of 5. 14 J.G. and F.D., who were trained in assessment of SOC with the isolated forearm technique and proper real-time documentation beforehand, recorded all procedures.
Analysis
EEG and vital sign raw data were pre-processed to eliminate artefacts. Zero activity and extremes values (±187.5 µV) were rejected as artefacts, and the signal was band pass filtered between 0.5 and 49.5 Hz. Parameter calculation was performed with self-written C code. The list of the 34 calculated EEG parameters is summarised in Table 1; all parameters were calculated at a rate of one value per second. The first three types of parameters were derived for each of the eight considered EEG bands, using windows corresponding to an average of 10 EEG oscillations for each band with windows overlapping by 50%. Specifically, (a) the logarithm of the absolute EEG power in each band, (b) the logarithm of the relative EEG power (absolute power divided by the sum of powers for all bands) and (c) phase synchronisation between the two EEG signals 15 were analysed. The second set of parameters was chosen to match those previously considered in analyses of sedation data and is summarised in Table 1 as well. Based on Fast Fourier Transformation of overlapping 8-second windows of EEG data median frequency, spectral edge frequency and weighted spectral median frequency (WSMF, with two different frequency limits) 11 were calculated together with the SyncFastSlow (SFS) parameter from bispectral analysis 12 and permutation entropies (for three somewhat different definitions, see Table 1). 13 Additionally, PowerFastSlow (a relative power previously compared with SFS) and bicoherence (the corresponding normalised bispectral value) were determined. 12 , 16 Results for the two EEGs were averaged except for phase synchronisation, which yields only one value for a pair of signals.
Processed EEG parameters with their corresponding frequency ranges and area under the curve (AUC) in the receiver operating characteristic.
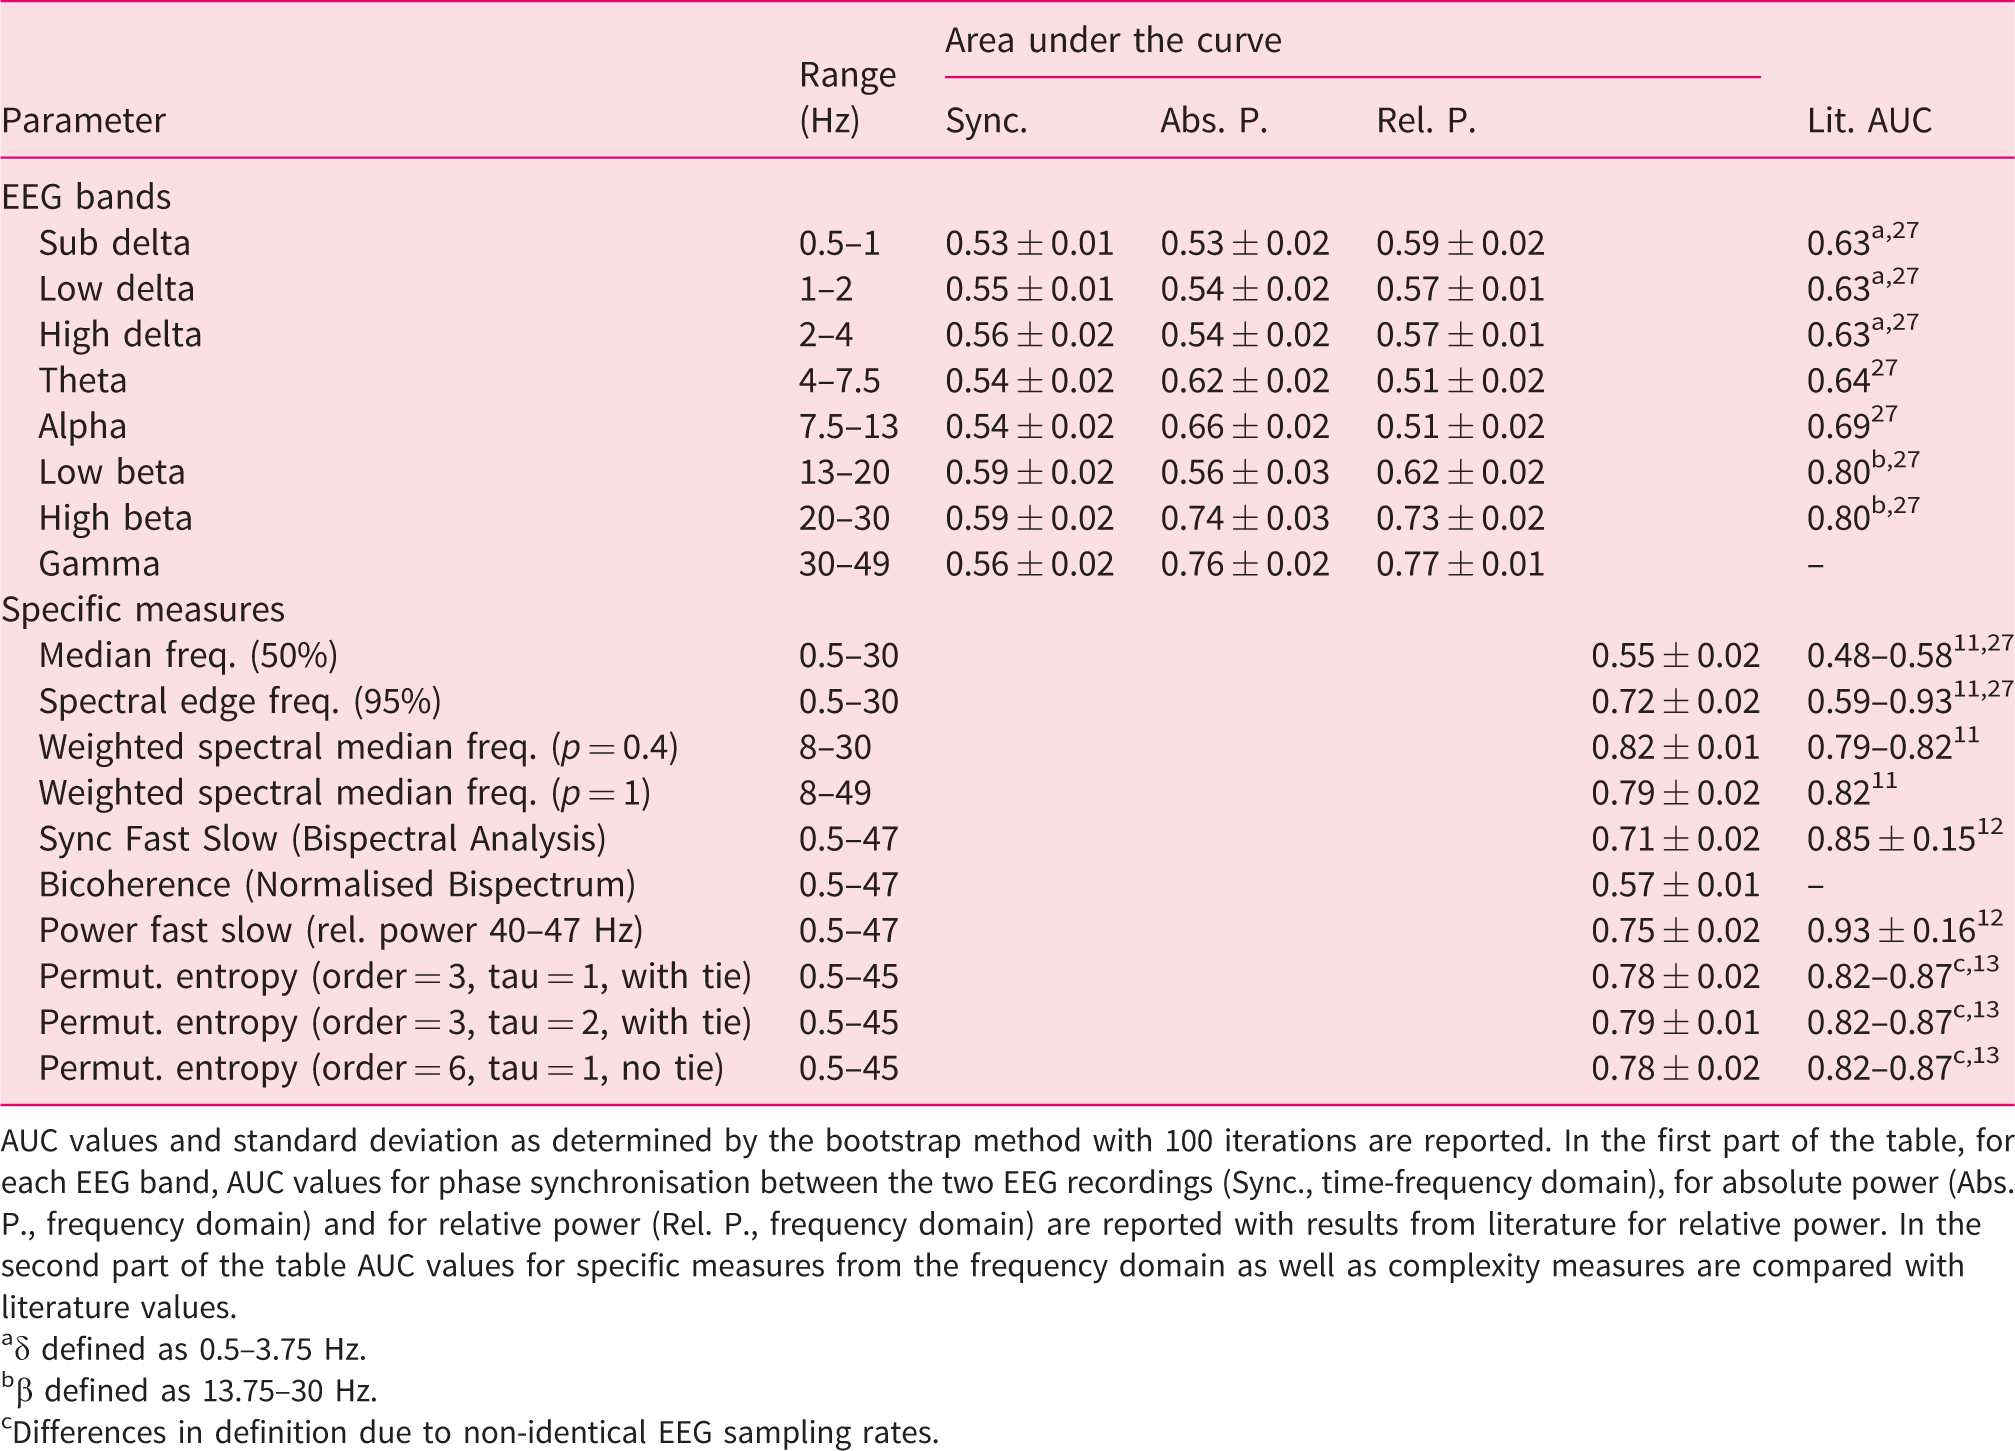
AUC values and standard deviation as determined by the bootstrap method with 100 iterations are reported. In the first part of the table, for each EEG band, AUC values for phase synchronisation between the two EEG recordings (Sync., time-frequency domain), for absolute power (Abs. P., frequency domain) and for relative power (Rel. P., frequency domain) are reported with results from literature for relative power. In the second part of the table AUC values for specific measures from the frequency domain as well as complexity measures are compared with literature values.
aδ defined as 0.5–3.75 Hz.
bβ defined as 13.75–30 Hz.
cDifferences in definition due to non-identical EEG sampling rates.
In order to assess prediction accuracy for the SOC, ROC curves were plotted and corresponding AUC values calculated. The bootstrap method (with 100 interactions) was used to determine standard deviations for the AUC values. Furthermore, we performed sensitivity analyses with prediction accuracy in dependence of sample size and intervention type.
Results
In total 225 patients were screened, and of these 171 patients (71 female patients, 42%) with a mean age of 60.3 (21–83) years were enrolled and a full data set was recorded. ASA Physical Status ranged from I to III. Reasons for exclusion in 54 patients are shown in the study flow chart (supplementary figure 1). The recorded procedures comprised 10 gastroscopies, 47 combined gastroscopies and colonoscopies, 26 colonoscopies, 60 endoscopic ultrasounds, 13 bronchoscopies and 15 endobronchial ultrasounds.
We recorded 4382.9 minutes of EEG raw data with 1132 SOC transitions. A median of six loss/return of consciousness-pairs was recorded per intervention. On average 240.6 mg of propofol were administered. Additional descriptive statistics are shown in Table 2.
Patients, intervention and sedation characteristics of 171 records.
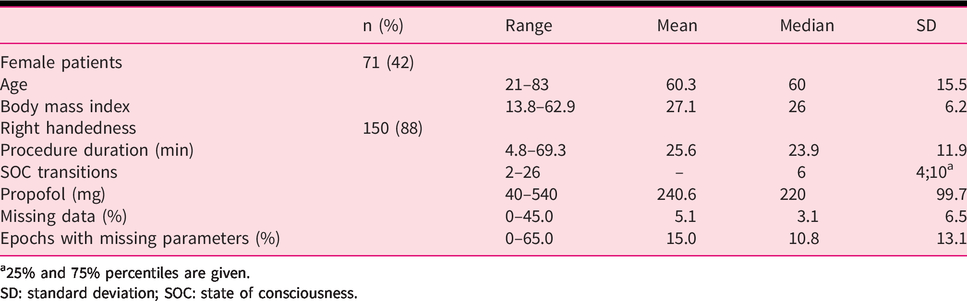
a25% and 75% percentiles are given.
SD: standard deviation; SOC: state of consciousness.
Records included a median of 3.1% missing data, resulting in a median of 10.8% epochs with a least one missing pEEG parameter.
Figure 2 shows the ROC curves for the combined data of all 171 subjects and selected EEG parameters. The AUC values for each parameter reported in Table 1 indicated the parameter’s ability to separate the SOC and ranged from 0.51 to 0.82. Permutation entropies and the optimised frequency domain parameter WSMF showed considerably better performance (AUC 0.78–.82) than classical frequency domain and time-frequency domain parameters (AUC 0.51–.72), including phase synchronisation, the Bispectral Index™ (BIS) parameter SFS. Intermediate AUC values were obtained for the absolute and relative spectral power in the high β-band (AUC 0.74 and 0.73) and γ-band (AUC 0.76 and 0.77), and PowerFastSlow (AUC 0.75).
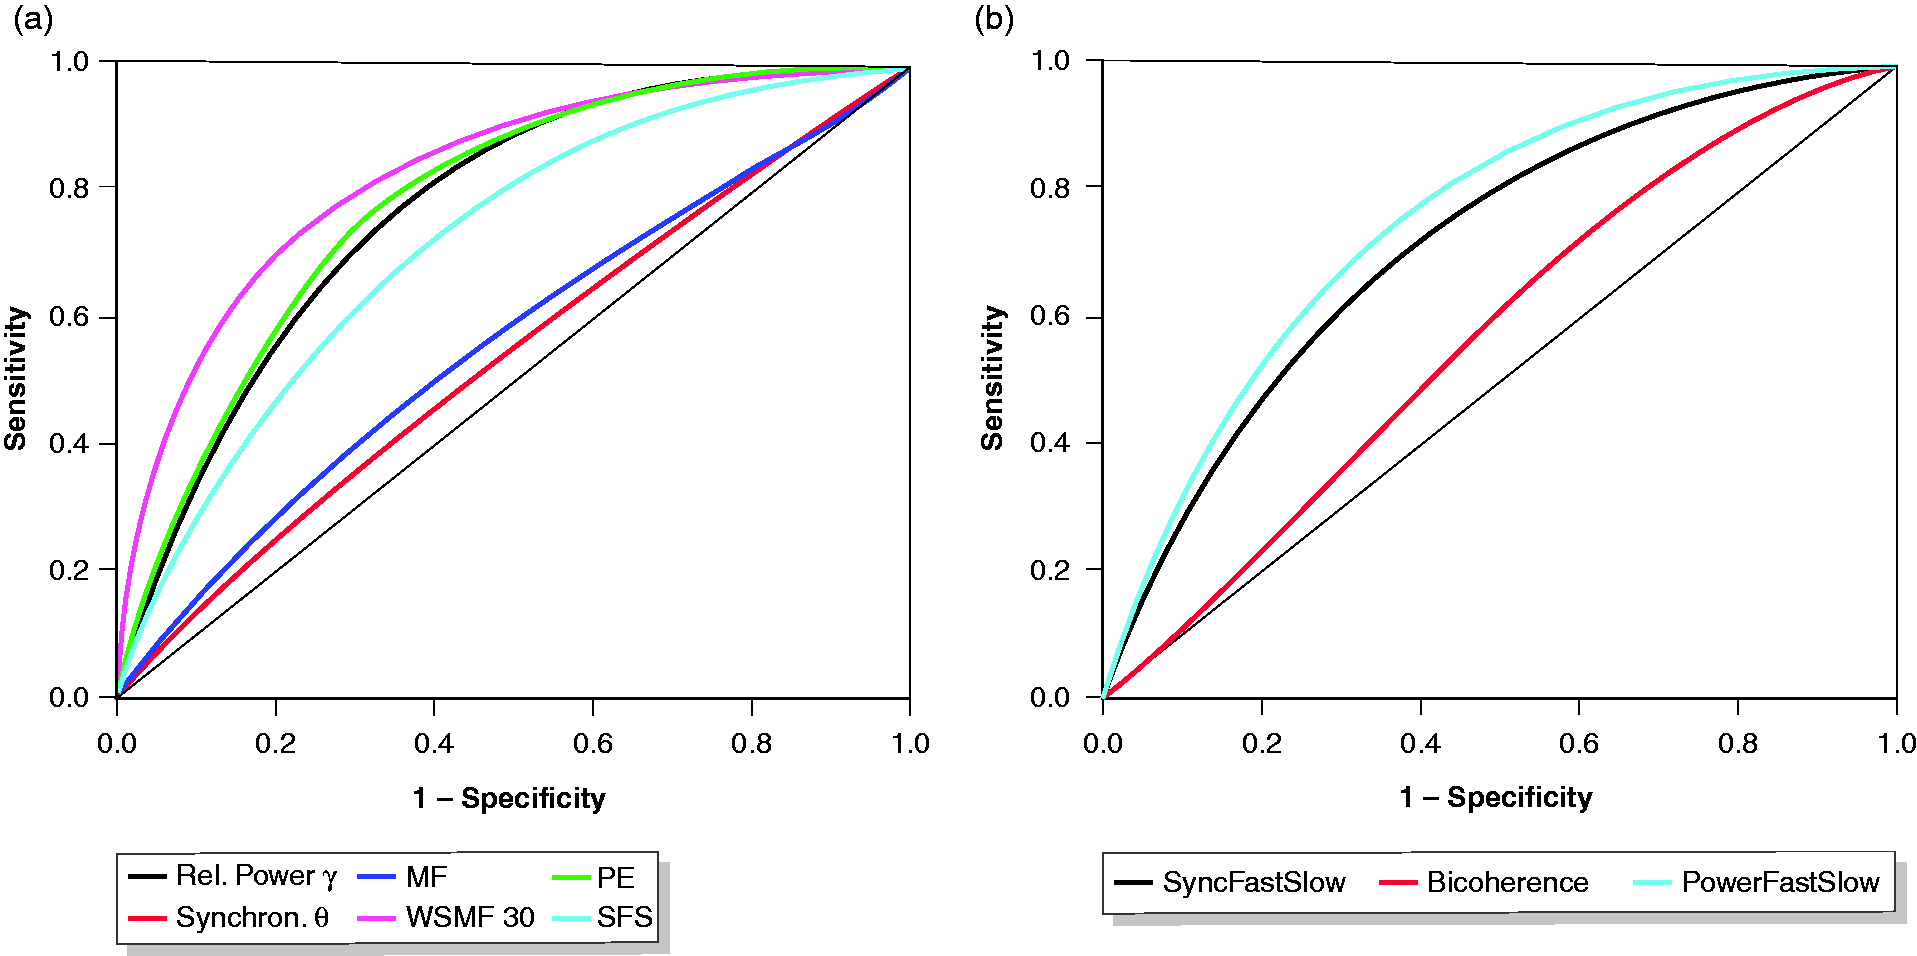
Receiver operating characteristic of processed EEG parameters for the differentiation of the state of consciousness. (a) Relative spectral Power in the gamma band (Rel. Power γ), phase synchronisation in the theta band (Synchron. θ), median frequency (MF), weighted spectral median frequency (WSMF 8–30 Hz), permutation entropy (PE) and SyncFastSlow (SFS). (b) Bispectral Index parameters SFS, Bicoherence and PowerFastSlow. Cumulated data from 171 patients and 4382.9 minutes of EEG with 1132 changes in the state of consciousness.
Discussion
Processed EEG parameters can predict the SOC in different endoscopic procedures. However, the prediction probability varies and is in general slightly inferior to results reported from general anaesthesia. Arguably, this observation can be explained by a variety of factors such as the use of different drugs, the non-steady-state nature of propofol sedation and inferior EEG signal quality due to missing relaxation.
Data analysis and general observations
We aimed to investigate parameters from all areas of the pEEG. The frequency domain has been investigated thoroughly and was incorporated with classic and modern parameters. In addition to frequency and amplitude, phase angle as a third property of cerebral oscillations was incorporated in the time-frequency domain. Furthermore, we investigated parameters that the BIS relies on and, lastly, calculated permutation entropy as a measure of signal complexity. This broad panel of parameters allowed for a comprehensive comparison of performances from general anaesthesia and endoscopy sedation.
To establish the SOC we used the isolated forearm technique – a method popular in general anaesthesia for its validity and reliability. 17 Thus, we were able to compare results from anaesthesia with our endoscopy setting. In endoscopy, sedation scales such as the modified ASA scale recommended by the European Society of Gastrointestinal Endoscopy are more prevalent and oriented towards a slightly different endpoint: clinical sedation depth. However, it is beyond the scope of this manuscript to explore performance of pEEG for a multi-level sedation depth scale and we therefore focused our analysis on the SOC.
Our results did not contradict previously reported prediction probabilities for the differentiation of the SOC. Parameters known to be superior to others exhibited the same behaviour in our dataset. However, we partly observed lower prediction probabilities. We hypothesise different factors to explain our observation. Firstly, parameters were developed in an environment without confounding factors present 18 and our setup, in an endoscopy ward, differed from this considerably. Several stimuli such as endoscope insertion, ambient noise, different patient postures, pain levels and other factors might have contributed to a less continuous degradation of consciousness and more artefacts in the EEG signal, thereby resulting in lower prediction probability of the pEEG. Secondly, induction in anaesthesia leads to a much deeper sedation than encountered in conscious sedation and thus induces more distinct EEG changes. Lastly, a series of variables including artefact rejection algorithms, band pass filtering, epoch length and other pre-processing features are not standardised and differ between studies. 14 ,18–20
Most importantly, even in the sedated state, we regularly encountered extreme values in the EEG. These extremes resulted from patient movement, grimacing and manipulation (e.g. hand resting on the patient’s forehead during bronchoscopy), whereas such artefacts are not present in relaxed patients in the operating theatre.
Generally, good quality EEG signals are difficult to register in the endoscopy setting. Some potential confounders like handedness, major brain disorders and skin preparation can be controlled for. However, due to the factors mentioned above, missing values regularly occurred in a median of 3.1% of data points resulting in a median of 10.8% of epochs for which at least one parameter was not calculable (Table 2). This highlights the importance of robustness against artefacts of pEEG as a major concern for monitoring in endoscopy compared to general anaesthesia.
Classic frequency and Bispectral Index parameters
In the frequency domain, absolute and relative spectral power in the high β- and γ-band seemed to contain the most information on SOC (AUC ≥ 0.73) compared with other bands (AUC ≤ 0.66), emphasising the importance of information outside the classic EEG-spectrum from 0.5 to 30 Hz. Prior findings were consistent with our observation 19 and many anaesthesia monitors rely on EEG information up to 45 Hz 21 , 22 or even higher. 23
The BIS monitor is the most prevalent anaesthesia monitor. Although its algorithm is proprietary, it claims to rely on parameters from the time-frequency domain, mainly SFS in light anaesthesia. 12 , 16 The BIS monitor has been evaluated in several studies as an adjunct to propofol sedation protocols. These studies did not find convincing benefit in BIS monitoring.7–9 The SFS parameter did not exhibit favourable characteristics and was comparable or inferior to other time-frequency domain parameters (Figure 2(b)). In particular, its bispectral component, the bicoherence parameter, was not useful for the determination of the SOC. This might explain the previously described poor performance of the BIS monitor in sedation.
Optimised frequency domain and complexity parameters
WSMF is a generalisation of median and spectral edge frequency and optimised for the detection of the loss of consciousness in general anaesthesia. 11 In our dataset it yielded the best result with an AUC of 0.82 (Figure 2), suggesting that this prior finding can be replicated and translated to an endoscopy setting.
Permutation entropy as described by Olofson et al. 20 was calculated in three different ways (Table 1, Figure 2), according to the literature 13 , 20 and due to different sampling rates of the EEGs. Our results are in line with previously reported performance metrics. With Shannon-, Approximate-, Spectral-, Response-, State-Entropy and others a variety of alternative complexity measures have been described. 24 We limited this exploratory investigation to permutation entropy for its ease of calculation and robustness against EEG artefacts. 25
Sensitivity analyses
In order to assess whether a larger case number would further improve prediction accuracy of pEEG parameters and ascertain performance for intervention types, we performed sensitivity analyses. With increasing case numbers changes in calculated AUC and confidence intervals decreased and eventually became marginal (Figure 3). We therefore believe that higher case numbers will not increase prediction accuracy any further. We opted to include all typical types of endoscopic interventions in our study to ensure universal applicability for endoscopy, and thus, improving generalizability of our results. This led to EEGs being recorded with different patient postures, unique artefacts, pain levels and varied sedation depths. Nevertheless, the performance was mostly independent of endoscopy type demonstrating the feasibility of our approach (supplementary figure 2).
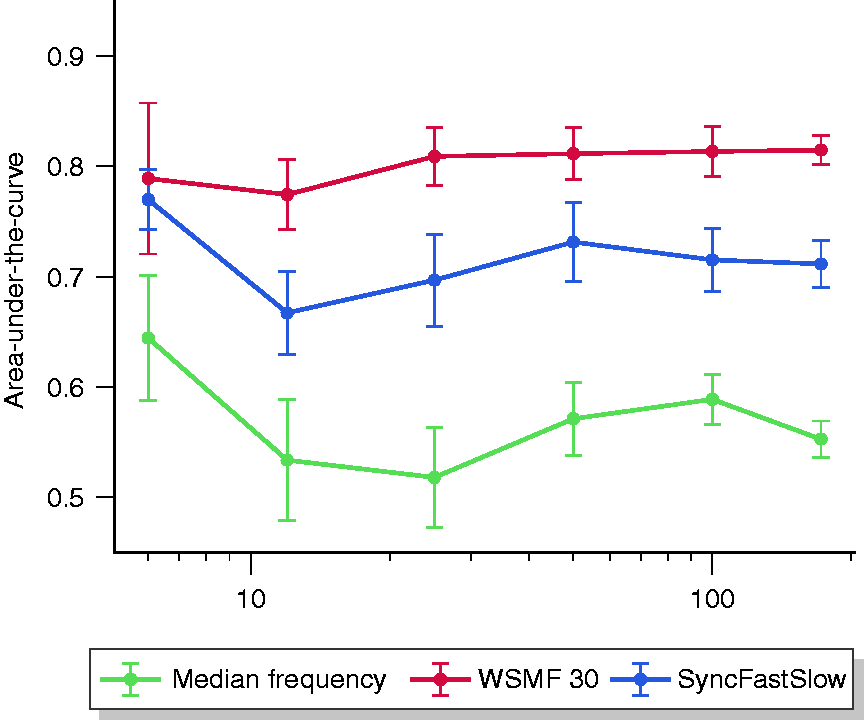
Area under the curve of selected processed EEG parameters by sample size. Prediction accuracy expressed as area under the curve with corresponding standard deviation as determined by the bootstrap method is plotted for three parameters with different sample sizes (n= 6, 12, 25, 50, 100, 171) using randomly drawn recordings from the dataset. For clarity, sample sizes on the abscissa are drawn on a logarithmic scale. WSMF30: weighted spectral median frequency 8–30 Hz.
Limitations
Losing consciousness is a gradual process with a continual decomposition of higher neural assemblies. Although the gold standard in anaesthesia studies, 26 we recognise that the isolated forearm technique we applied to check for the SOC places an arbitrary cut-off in this continuum. We conceive that checking for the SOC in 30-second intervals potentially introduced a bias as the state transition might have occurred at any point within this interval. Therefore, we decided to exclude these 30-second intervals in our analysis.
Additionally, it has to be noted that this dataset did not include endoscopic retrograde cholangio(pancreatico)graphies due to spatial requirements of our experimental setup and exposure of the investigator to radiation. Therefore, the transferability of results to this intervention may be limited.
Conclusion
SOC prediction in propofol sedation with pEEG parameters as previously developed for general anaesthesia is feasible, with similar accuracy. However, most parameters rely on artefact-free EEG signals. We encountered a considerable number of artefacts, which limited practicality. Therefore, further investigations should focus on the parameters’ robustness against artefacts. Higher prediction accuracy may be obtained by optimisation of parameters for endoscopy and modelling.
Supplemental Material
sj-pdf-1-ueg-10.1177_2050640620959153 - Supplemental material for Capability of processed EEG parameters to monitor conscious sedation in endoscopy is similar to general anaesthesia
Supplemental material, sj-pdf-1-ueg-10.1177_2050640620959153 for Capability of processed EEG parameters to monitor conscious sedation in endoscopy is similar to general anaesthesia by Jakob Garbe, Stephan Eisenmann, Jan W. Kantelhardt, Florian Duenninghaus, Patrick Michl and Jonas Rosendahl in United European Gastroenterology Journal
Footnotes
Acknowledgements
The authors thank Dr. Adam Smant as a native English speaker for the language revision of this manuscript.
Data availability
Deidentified patient data and C code for calculation of EEG parameters are available upon reasonable request to the corresponding author.
Declaration of conflicting interests
The authors declare that there is no conflict of interest.
Ethics approval
This study was registered at the German Clinical Trials Register (DRKS00016605). Ethical approval was obtained from the Ethics Committee of the Martin-Luther-University Halle-Wittenberg (2019-010; 18 April 2019). Good clinical practice standards were adhered to, and the study was conducted according to the 1975 Declaration of Helsinki and its later amendments.
Funding
The authors received no financial support for the research, authorship and/or publication of this article.
Informed consent
All patients included in this study gave their written informed consent.
Supplemental material
Supplemental material for this article is available online.
References
Supplementary Material
Please find the following supplemental material available below.
For Open Access articles published under a Creative Commons License, all supplemental material carries the same license as the article it is associated with.
For non-Open Access articles published, all supplemental material carries a non-exclusive license, and permission requests for re-use of supplemental material or any part of supplemental material shall be sent directly to the copyright owner as specified in the copyright notice associated with the article.