
Abstract
Background
There is conflicting evidence regarding reliability criteria for the controlled attenuation parameter (CAP; a marker for hepatic steatosis [HS]). Thus, we assessed the diagnostic performance of CAP according to different reliability criteria based on real-world data from an academic centre.
Methods
Patients undergoing measurement of CAP and liver biopsy (±6 months) at the Medical University of Vienna were included. HS was assessed according to SAF score.
Results
In total 319 patients were included. The main aetiologies were non-alcoholic fatty liver disease (NAFLD, n = 177, 55.5%), viral hepatitis (n = 49, 15.4%), and alcoholic liver disease (ALD, n = 29, 9.1%). Histological steatosis and fibrosis stages were: S0: 93 (29.2%), S1: 100 (31.3%), S2: 67 (21.0%), and S3: 59 (18.5%); F0/F1: 150 (47.0%), F2: 47 (14.7%), and F3/F4: 122 (48.3%). In the overall cohort, the area under the receiver operating characteristic curve (AUC) of CAP was 0.843 (95% confidence interval [CI]: 0.798–0.887) for diagnosing HS ≥ S1), 0.789 (95%CI: 0.740–0.839) for ≥S2, and 0.767 (95%CI: 0.712–0.823) for S3. CAP corrections as suggested by Karlas et al. did not improve the diagnostic performance. Importantly, the AUC of CAP for HS ≥ S1 was numerically highest in patients with CAP-IQR/median<0.10 or <0.20 (obtained in 37.9% and 74.9%), in whom CAP also had better diagnostic performance, as compared with patients not meeting these criteria. Moreover, it was substantially higher in 288 (90.3%) patients with CAP-IQR/median<0.3: 0.856 (95%CI: 0.809–0.903) vs. patients not meeting this criterion (0.530 [95%CI: 0.309–0.751]). In contrast, the previously suggested reliability criterion of CAP-IQR<40 dB/m was not associated with an improved diagnostic performance for HS≥S1 (0.866 [95%CI: 0.812–0.920] vs. 0.799 [95%CI: 0.717–0.881]) and was only obtained in 199 (62.4%) patients.
Conclusion
CAP-IQR/median<0.1, <0.2, and <0.3 identify reliable measurements for diagnosing any hepatic steatosis (≥S1). Importantly, CAP-IQR/median<0.3 has a considerably higher applicability in clinical practice, as compared with the previously suggested CAP-IQR<40 dB/m criterion.
Keywords
Introduction
Non-alcoholic fatty liver disease (NAFLD) is highly prevalent and has become a major cause of liver-related morbidity and mortality worldwide. 1 Recent data indicate a link between hepatic steatosis (HS) severity and liver fibrosis in patients with NAFLD, independently of hepatic inflammation.2–4 Moreover, HS also seems to drive disease progression in HCV,5,6 HBV,7,8 and autoimmune hepatitis (AIH). 9 Finally, HS itself has been linked to cardiovascular risk factors such as insulin resistance, dyslipidemia, and arterial hypertension. 2 These data underline the importance of HS across different aetiologies of chronic liver disease (CLD) and the need for reliable non-invasive diagnostics.
Vibration-controlled transient elastography (VCTE) is a non-invasive technique measuring the velocity of shear waves generated by a mechanical pulse in the liver, being faster if liver tissue is harder/stiffer (i.e. fibrotic/cirrhotic). 10 It is a promising tool to assess liver fibrosis and HS in a tertiary care setting, 11 as the controlled attenuation parameter (CAP) incorporated into the FibroScan®-device showed a good correlation with HS on liver histology.12,13 Since CAP is increasingly used as a surrogate for HS, correct measurements need to be identified. 14 While an interquartile range (IQR) to median ratio of <0.3 is used to identify reliable liver stiffness measurements, there is an ongoing debate on reliability criteria for CAP. Several authors15–17 have proposed a CAP-IQR <40 dB/m for the identification of reliable measurements when using liver histology as reference, while another study applying magnetic resonance imaging (MRI) as gold standard even recommended a more stringent cut-off of CAP-IQR <30 dB/m. 18 More recently, Eddowes and colleagues 19 reported that a large proportion of patients (39% and 57%, respectively) did not meet these criteria, which questions their clinical applicability. Furthermore, the authors were unable to identify a CAP-IQR cut-off for defining reliable measurements.
Due to considerable uncertainty regarding reliability criteria for CAP, we aimed to assess the diagnostic performance of CAP according to different reliability criteria based on real-world data from a large academic centre.
Materials and methods
Study design, patients, and definitions
All patients undergoing liver biopsy and CAP measurement within 6 months were considered for inclusion in this retrospective analysis. Exclusion criteria are presented in the supplement. Our study adhered to the modified ‘Standards for Reporting of Diagnostic Accuracy Studies’ (STARD), as proposed by Bousier et al. (i.e. the Liver-FibroSTARD standards). 20
Liver biopsy
Liver specimens were obtained by transjugular liver biopsy (n = 98, 30.7%) after measurement of hepatic venous pressure gradient (HVPG) using either an aspiration (Cook Medical, Bloomington, USA) or a Tru-Cut needle (Cook Medical, Bloomington, USA), or by percutaneous liver biopsy (n = 146, 45.8%) using an aspiration needle (B. Braun, Melsungen, Germany). 21 Moreover, intraoperative biopsies (n = 75, 23.5%) were included. Histological slides were read by pathologists specialized in liver histopathology and blinded to CAP data. Portal tracts were counted and insufficient specimens with <6 portal tracts were excluded from this analysis. Liver fibrosis and inflammation was graded according to the Batts–Ludwig, METAVIR or NAFLD activity score (NAS), as applicable.22–24 HS was semi-quantitatively assessed and graded according to the SAF score as no HS (S0, fat accumulation in <5% of hepatocytes), grade 1 (S1, fat accumulation in 5–33% of hepatocytes), grade 2 (S2, fat accumulation in 34–66% of hepatocytes), and grade 3 (S3, fat accumulation in ≥67% of hepatocytes). 25
Liver stiffness and CAP measurements
Liver stiffness and CAP measurements were performed by experienced operators in clinical routine using FibroScan® (Echosens, Paris, France), as previously described. 26 All measurements were performed after a minimum fasting period of at least 3 h. The M and XL-probe were chosen based on the recommendation of the device. The patients were lying in a dorsal position with the right arm in maximal abduction and measurements were performed in the right lobe of the liver, through intercostal spaces. Reliability of liver stiffness measurements was defined by previously established criteria. 11
Statistics
Statistical analyses were performed using IBM SPSS Statistics 25 (SPSS Inc., Armonk, New York, USA) and GraphPad Prism 8 (GraphPad Software, La Jolla, California, USA). Continuous variables were reported as mean ± standard deviation (SD) or median (IQR) according to their distribution, and categorical variables were shown as numbers and proportions of patients. Comparisons of continuous variables were performed using Student’s t-test or Mann–Whitney U test, as applicable. For comparisons of more than two groups, Chi square test or Fisher’s exact test were used. Areas under the receiver operating characteristic curve (AUC) were calculated to assess the diagnostic accuracy of CAP for the detection of HS in different subgroups of patients and also included 95% confidence intervals (95%CI) to quantify uncertainty. Youden’s index was used to calculate the optimal threshold for CAP to differentiate between HS stages. Net reclassification improvement (NRI) was used to compare the diagnostic accuracy of different CAP cut-offs. Univariate and multivariate linear regression analyses were performed to determine factors independently associated with CAP and CAP-IQR values. A two-sided p-value ≤ 0.05 was considered as statistically significant.
Ethics
This study was approved by the ethics committee of the Medical University of Vienna on 24/11/2016 (No. 2013/2016 and 1124/2017). Since this is a retrospective analysis, the requirement of a written informed consent was waived by the ethics committee. The study protocol conforms to the ethical guidelines of the 1975 Declaration of Helsinki as reflected in a priori approval by the institution’s human research committee.
Results
Patient characteristics
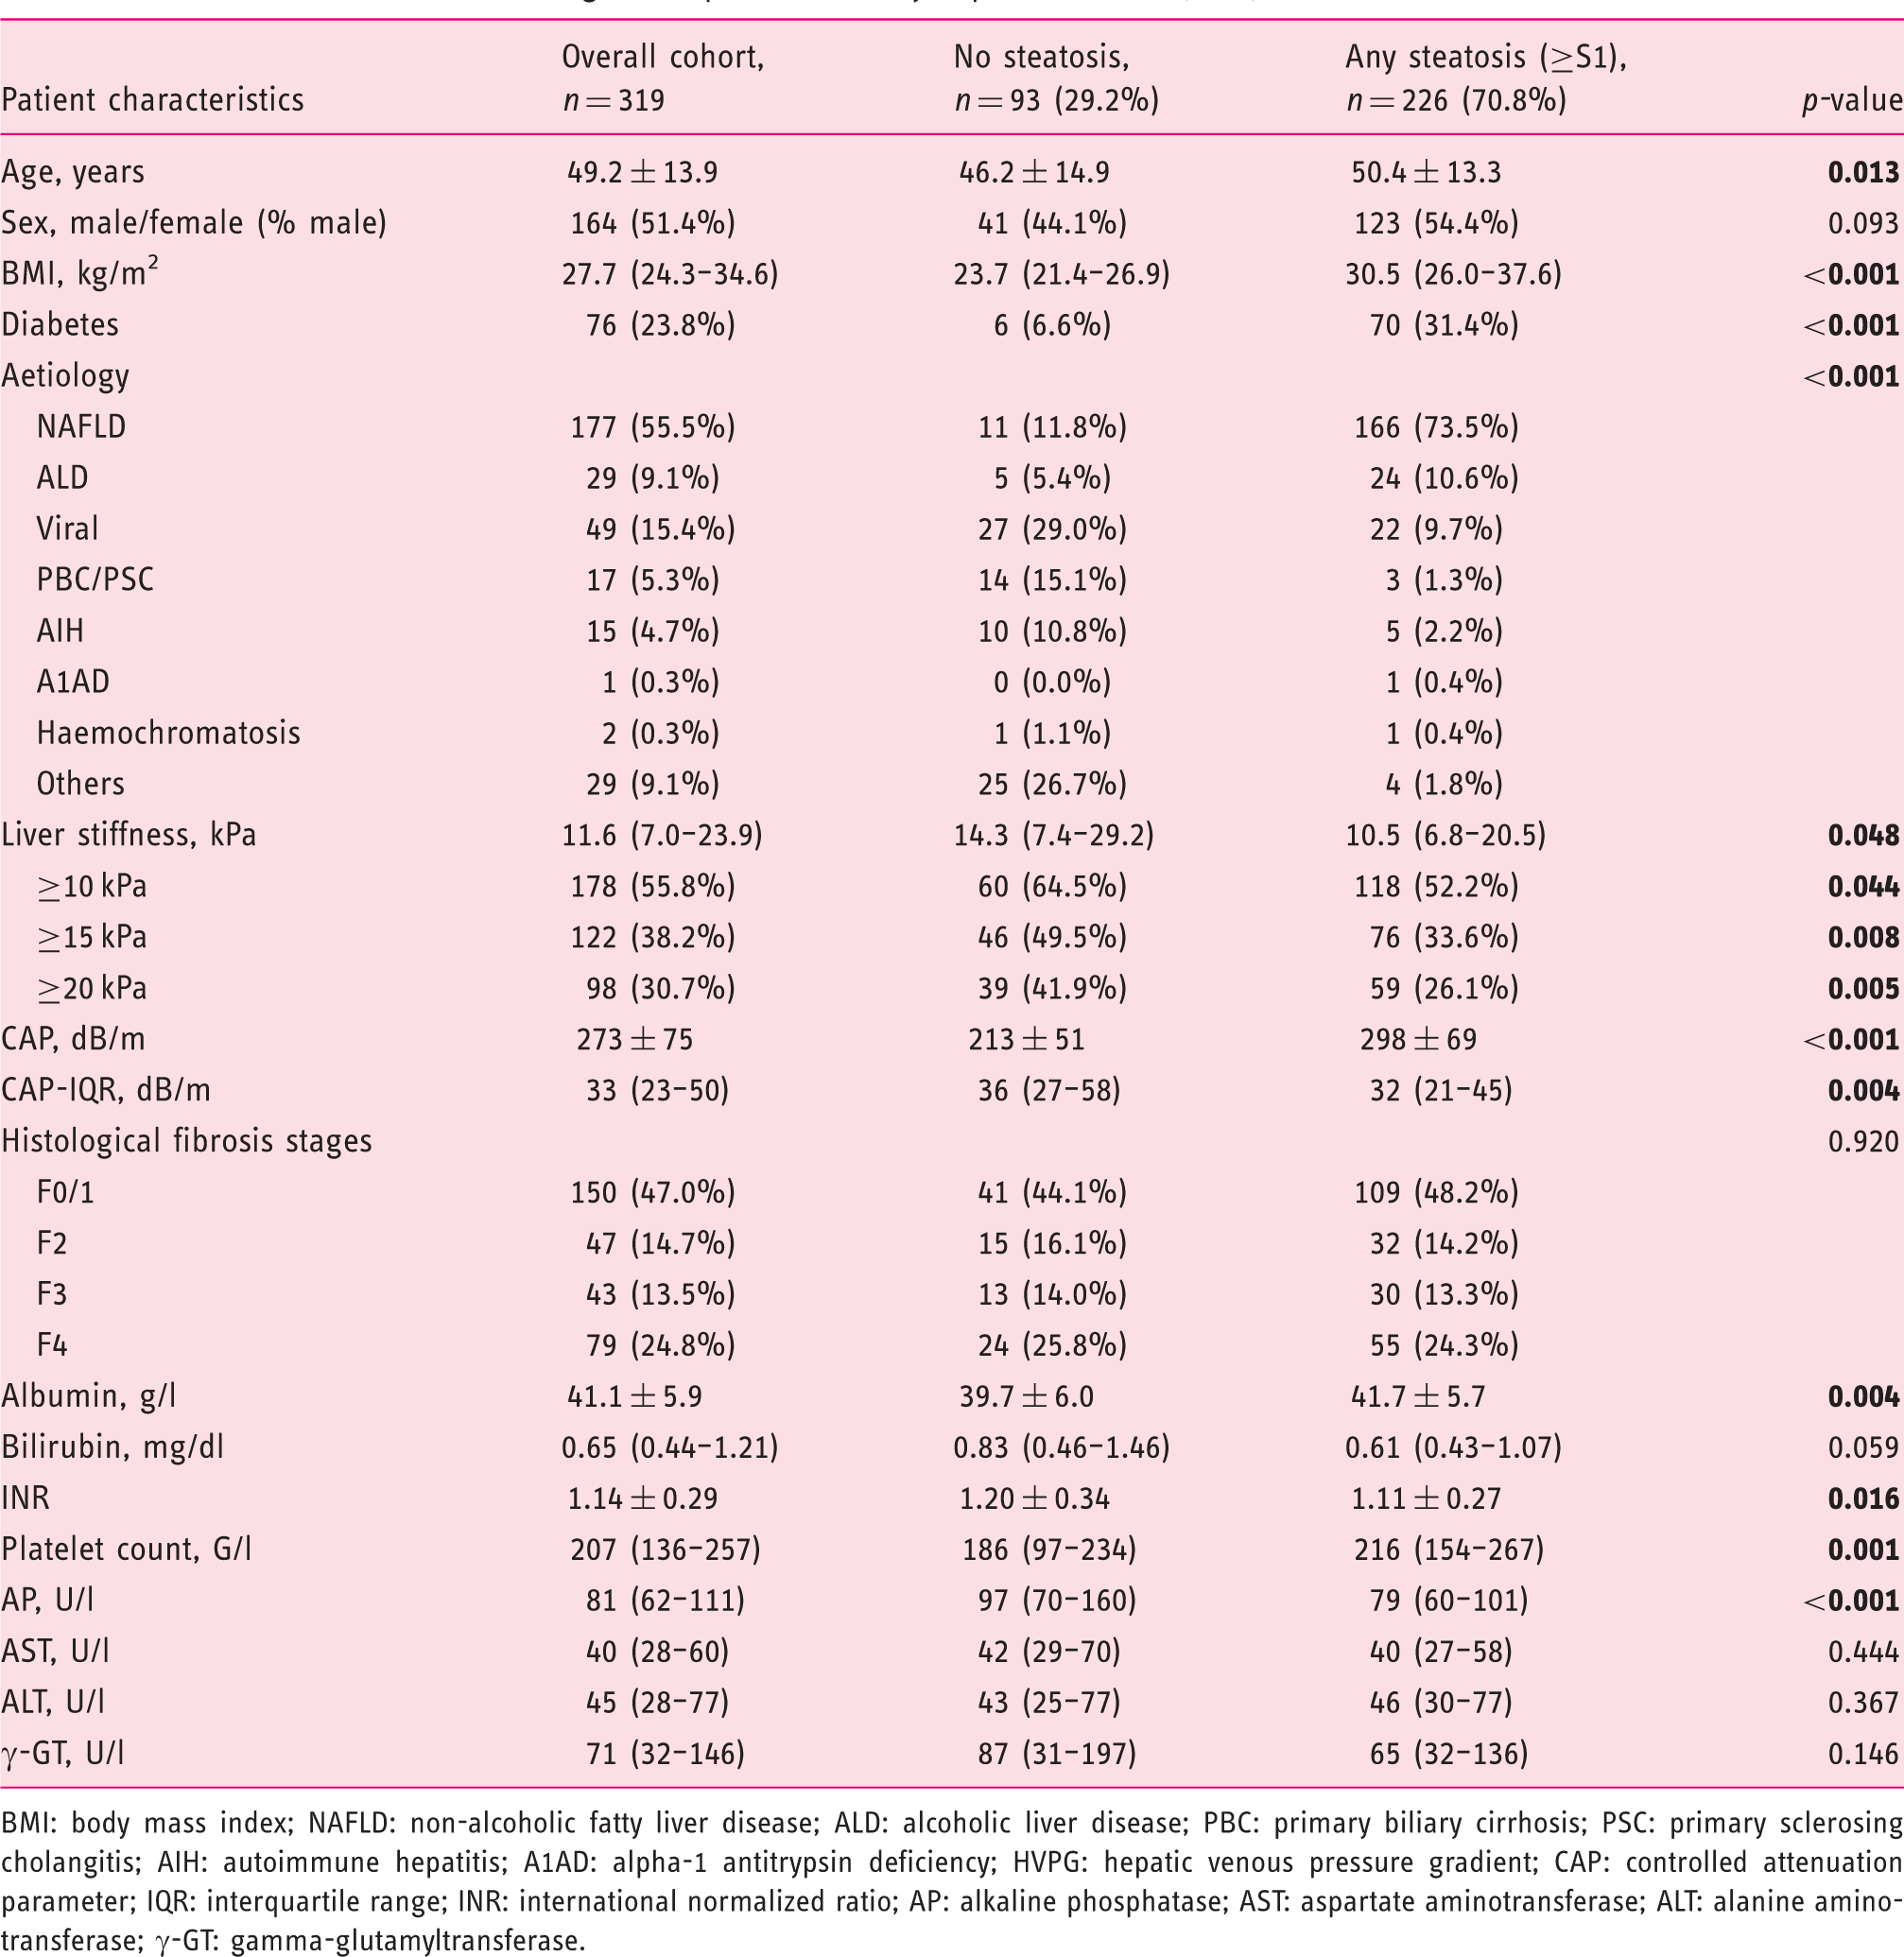
Patients characteristics according to the presence of any hepatic steatosis (≥S1).
BMI: body mass index; NAFLD: non-alcoholic fatty liver disease; ALD: alcoholic liver disease; PBC: primary biliary cirrhosis; PSC: primary sclerosing cholangitis; AIH: autoimmune hepatitis; A1AD: alpha-1 antitrypsin deficiency; HVPG: hepatic venous pressure gradient; CAP: controlled attenuation parameter; IQR: interquartile range; INR: international normalized ratio; AP: alkaline phosphatase; AST: aspartate aminotransferase; ALT: alanine aminotransferase; γ-GT: gamma-glutamyltransferase.
When comparing patients without HS with patients with any steatosis (≥S1), a lower age (46.2 ± 14.9 vs. 50.4 ± 13.3 years, p = 0.013), lower body mass index (BMI; 23.7 [IQR: 21.4–26.9] vs. 30.5 [IQR: 26.0–37.6] kg/m2, p < 0.001), lower prevalence of diabetes (6.6% vs. 31.4%, p < 0.001), lower CAP (213 ± 51 vs. 298 ± 69 dB/m, p < 0.001), and higher CAP-IQR (36 [IQR: 27–58] vs. 32 [IQR: 21–45] dB/m, p = 0.004) were evident. Moreover, patients without HS had more advanced liver disease as indicated by higher liver stiffness (14.3 [IQR: 7.4–29.2] vs. 10.5 [IQR: 6.8–20.5] kPa, p = 0.048), lower albumin levels (39.7 ± 6.0 vs. 41.7 ± 5.7 g/l, p = 0.004), higher international normalized ratio (INR; 1.20 ± 0.34 vs. 1.11 ± 0.27, p = 0.016), and lower platelet count (186 [IQR: 97–234] vs. 216 [IQR: 154–267], p = 0.001). However, the distribution of liver fibrosis stages was comparable between these groups. As expected, the distribution of liver disease aetiologies differed, with NAFLD (73.5% vs. 11.8%) and ALD (10.6% vs. 5.4%) being more prevalent in patients with HS ≥ S1, while viral hepatitis (9.7% vs. 29.0%), cholestatic liver disease (1.3% vs. 15.1%), and AIH (2.2% vs. 10.8%) were less common (p < 0.001).
Overall diagnostic performance of CAP
In the overall cohort, the AUC of CAP for diagnosing HS ≥ S1 was 0.843 (95%CI: 0.798–0.887) with a Youden’s index optimized cut-off of >246 dB/m and highly sensitive (90%) or specific (90%) cut-offs of >205 dB/m or >279 dB/m, respectively. In addition, AUC values for ≥S2 and ≥S3 were 0.789 (95%CI: 0.740–0.839) and 0.767 (95%CI: 0.712–0.823), respectively, with optimal cut-offs of >273 and >292 dB/m. Using the Youden’s index-derived cut-offs, sensitivity/specificity of CAP for ≥S1, ≥S2, and ≥S3 were 78.3%/80.6%, 82.5%/66.8%, and 83.1%/59.4%, respectively (Figure 1).
Diagnostic performance as assessed by area under the receiver operating characteristic curves (AUC) values of uncorrected controlled attenuation parameter (CAP) values and CAP corrected according to Karlas et al.
13
for diagnosing any hepatic steatosis (HS; i.e. HS ≥ S1), ≥S2, and ≥S3.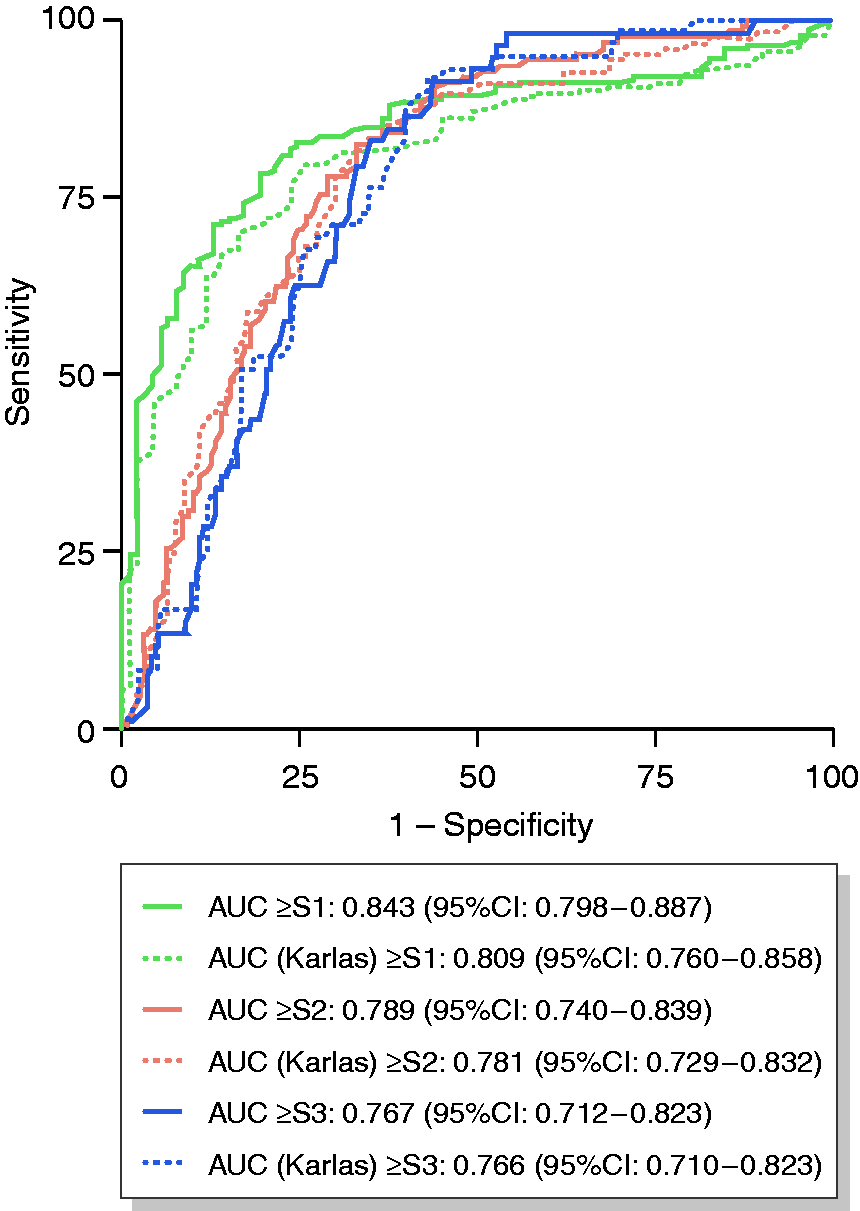
Noteworthy, applying corrections of CAP values according to Karlas et al. 13 resulted in an AUC of 0.809 (95%CI: 0.760–0.858) for ≥S1, 0.781 (95%CI: 0.729–0.832) for ≥S2, and 0.766 (95%CI: 0.710–0.823) for ≥S3. NRI for comparison of two models (corrected CAP values according to Karlas et al. vs. uncorrected CAP values) was –0.090 for ≥S1, –0.070 for ≥S2, and –0.090 for S3, indicating trends towards a worsening of the diagnostic performance, when using corrected CAP values according to Karlas et al. (Supplementary Table 1).
In a multivariate analysis investigating factors independently associated with CAP values, only diabetes (B = 26.343, p = 0.001), NALFD aetiology (B = 47.940, p < 0.001), and percentage of hepatic steatosis on liver histology (B = 0.887, p < 0.001) were significantly associated with CAP values (Supplementary Figure 2).
Comparison of different reliability criteria for CAP
In the overall cohort, CAP-IQR was 33 (IQR: 23–50) dB/m, with a small, but statistically significant difference between patients with and without HS ≥ S1 (36 [IQR: 27–58] vs. 32 [IQR: 21–45] dB/m, p = 0.004).
When comparing different cut-offs for CAP-IQR and CAP-IQR/median, there was a significant difference in the AUC values of patients with CAP-IQR < 20 dB/m and those ≥20 dB/m (0.935 [95%CI: 0.871–1.000] vs. 0.817 [95%CI: 0.764–0.870]); however, only 60 (18.8%) patients met this potential reliability criterion. In contrast, the AUC observed in patients with CAP-IQR <40 dB/m was not significantly different from patients with a CAP-IQR ≥40 dB/m (0.866 [95%CI: 0.812–0.920] vs. 0.799 [95%CI: 0.717–0.881]). Even the CAP-IQR <40 dB/m criterion was met by only 199 (62.4%) patients, leaving more than one-third of patients without a reliable measurement. Similarly, higher CAP-IQR cut-offs (<60 dB/m or <80 dB/m) were unable to discriminate between reliable and unreliable results.
Comparison of different reliability criteria for diagnosing any hepatic steatosis (≥S1).
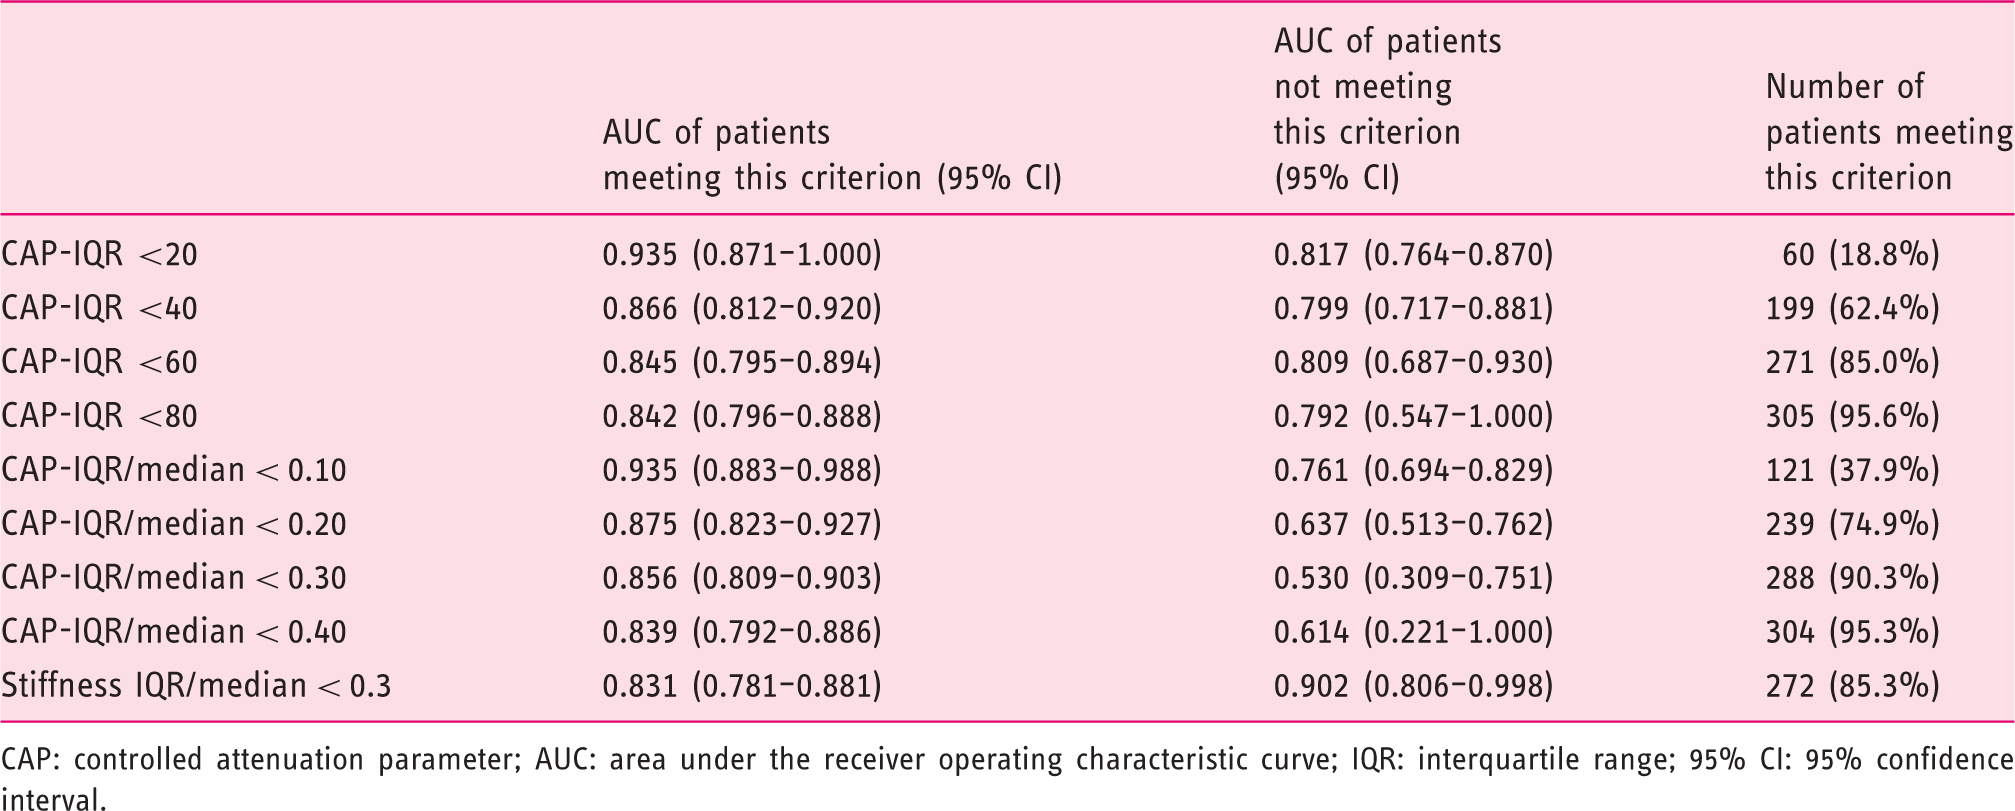
CAP: controlled attenuation parameter; AUC: area under the receiver operating characteristic curve; IQR: interquartile range; 95% CI: 95% confidence interval.
Comparison of patients stratified according to CAP-IQR/median ≥0.3 and discordance between CAP and liver biopsy regarding the presence of any steatosis.
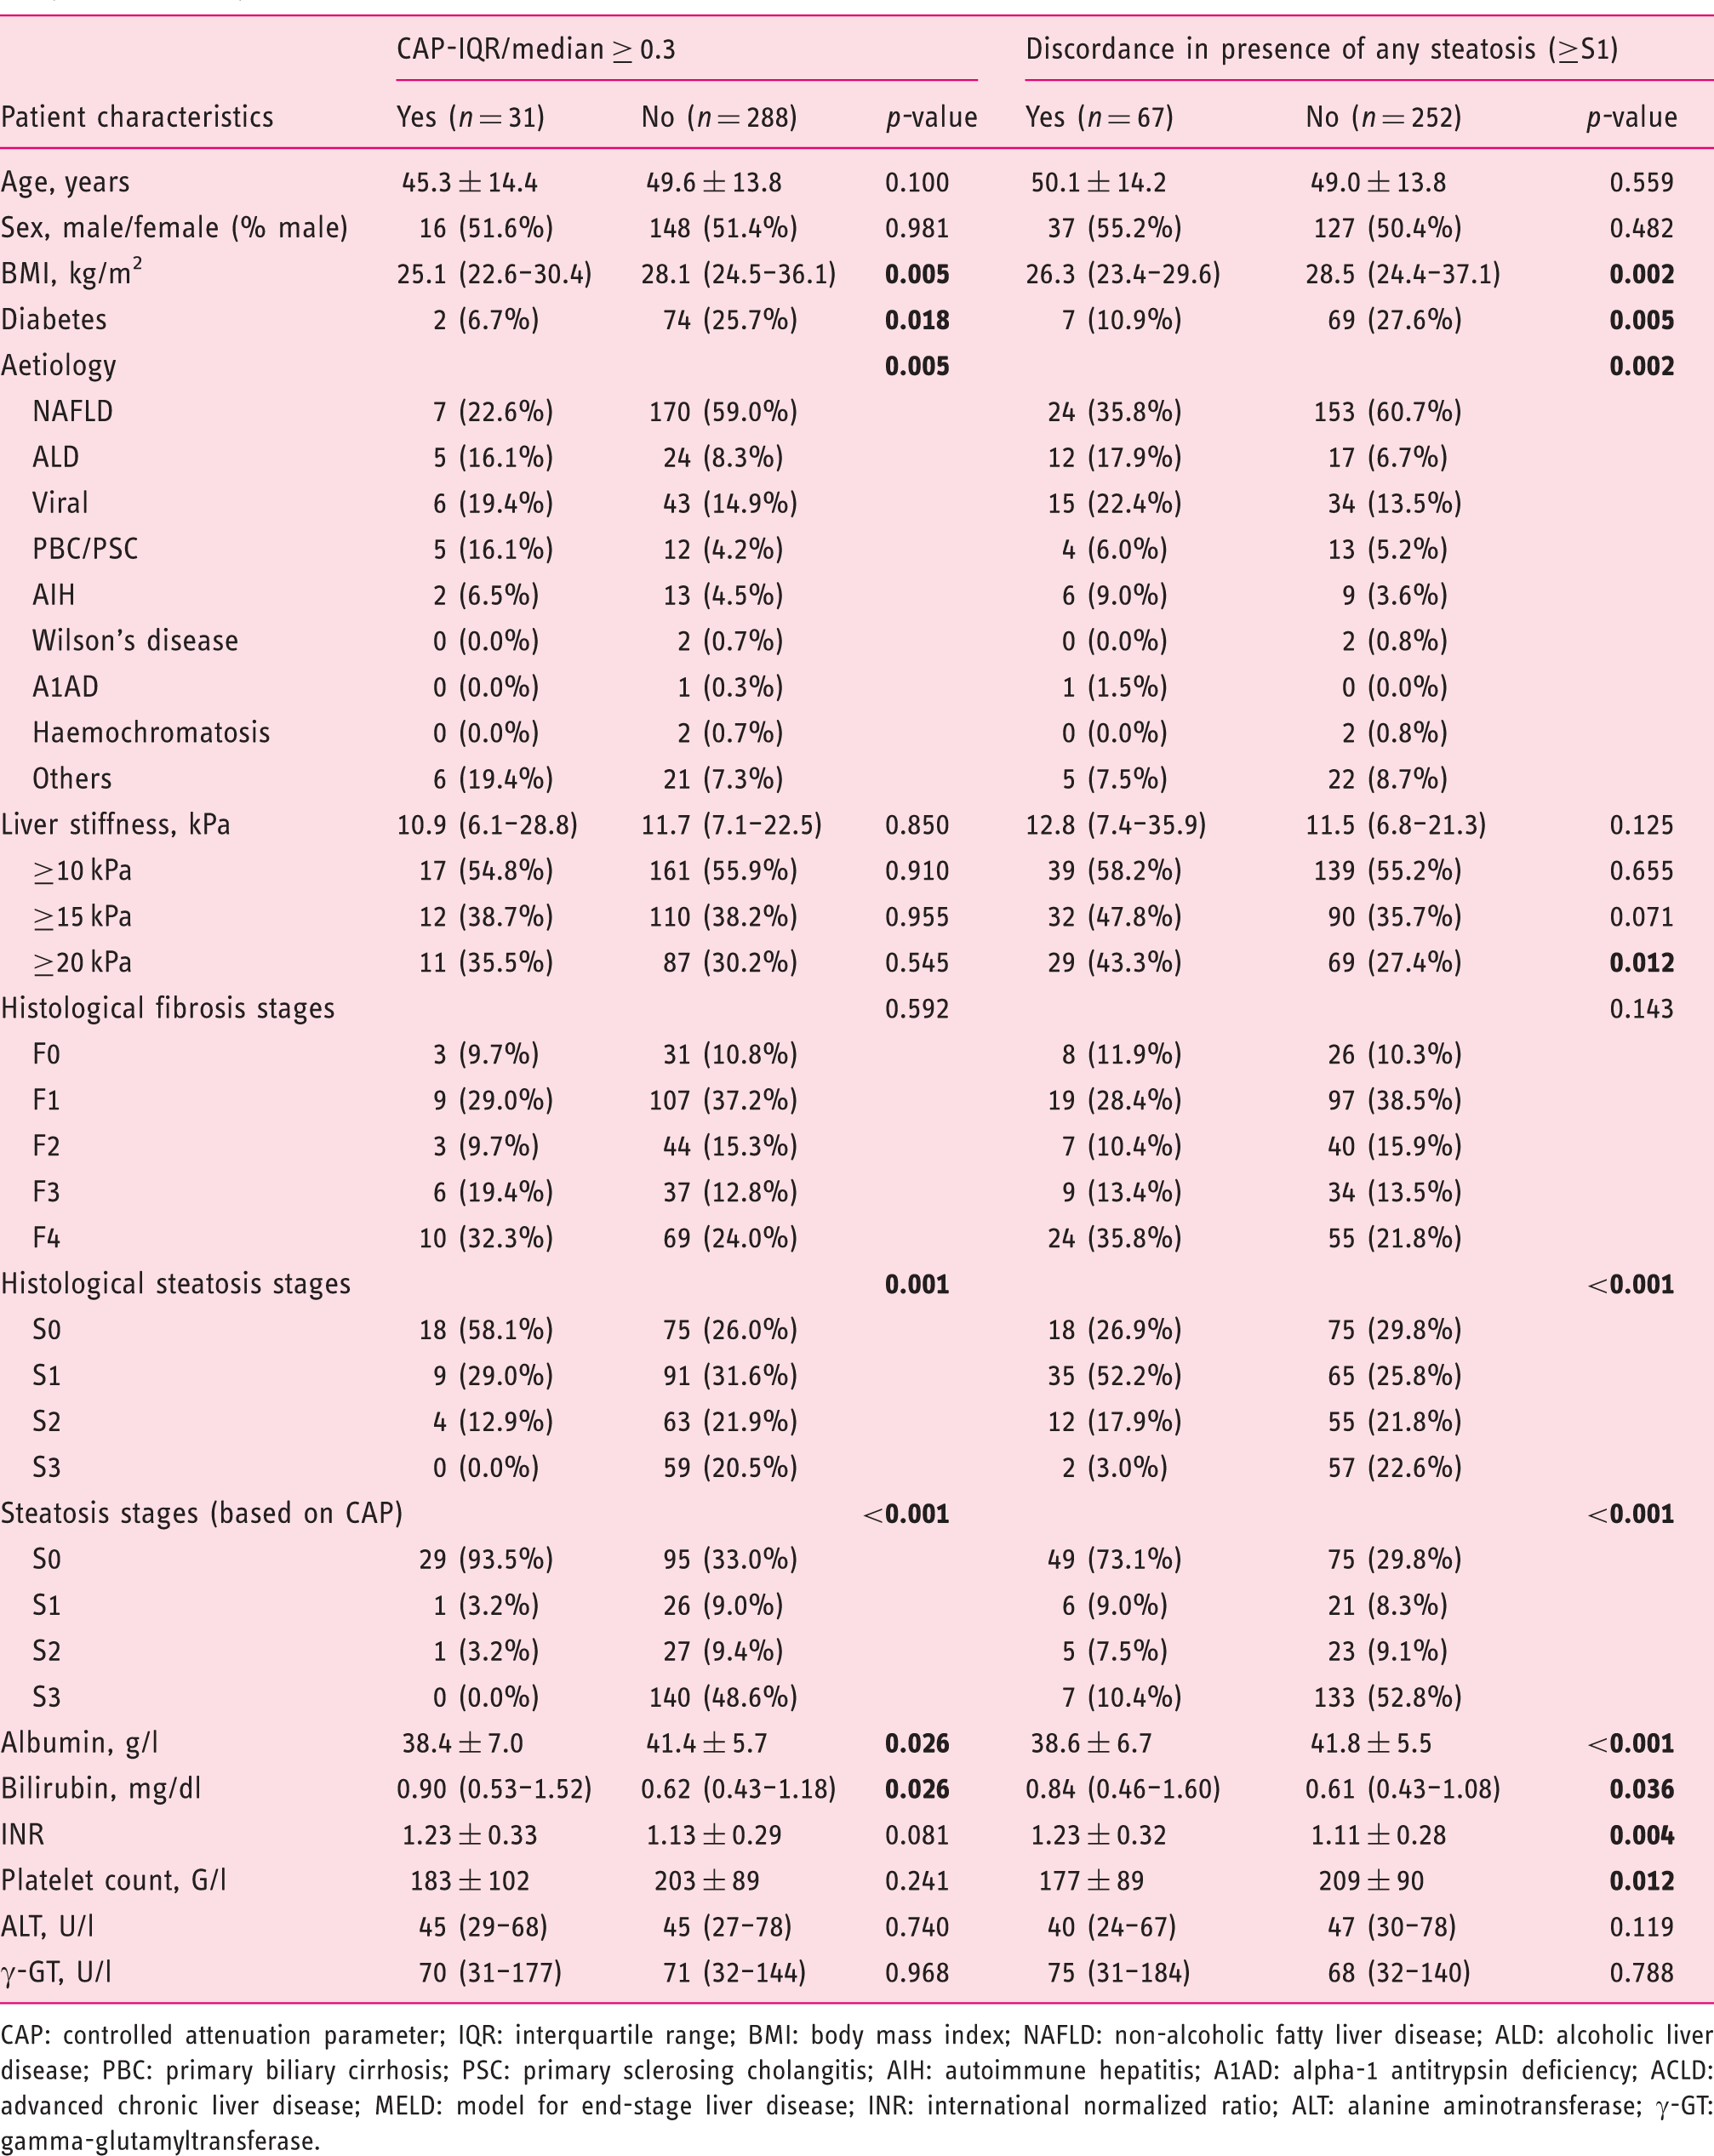
CAP: controlled attenuation parameter; IQR: interquartile range; BMI: body mass index; NAFLD: non-alcoholic fatty liver disease; ALD: alcoholic liver disease; PBC: primary biliary cirrhosis; PSC: primary sclerosing cholangitis; AIH: autoimmune hepatitis; A1AD: alpha-1 antitrypsin deficiency; ACLD: advanced chronic liver disease; MELD: model for end-stage liver disease; INR: international normalized ratio; ALT: alanine aminotransferase; γ-GT: gamma-glutamyltransferase.
We further evaluated the proportion of patients with CAP-IQR ≥40 dB/m and CAP-IQR/median ≥0.3 among CAP quartiles (Figure 2). This stratification revealed a prevalence of CAP-IQR ≥ 40 dB/m of 54.3% (n = 44) in the lowest CAP quartile (<217 dB/m), 38.0% (n = 30) in patients with 217–278 dB/m, 30.1% (n = 25) in patients with 279–332 dB/m, and 27.6% (n = 21) in patients with >332 dB/m. CAP-IQR/median ≥0.3 was present in 32.1% (n = 26) of patients with <217 dB/m, compared to 5.1% (n = 4), 1.2% (n = 1), and 0% (n = 0) in the other quartiles. In line with this finding, CAP-IQR was independently associated with age (per year: B = –0.213, p = 0.020) and HS (per % of hepatocytes: B = –0.124, p = 0.010) or CAP values (per dB/m: B = –0.057, p = 0.006; Supplementary Table 2).
Prevalence of CAP-IQR ≥ 40 dB/m and CAP-IQR/median ≥0.3 among CAP quartiles.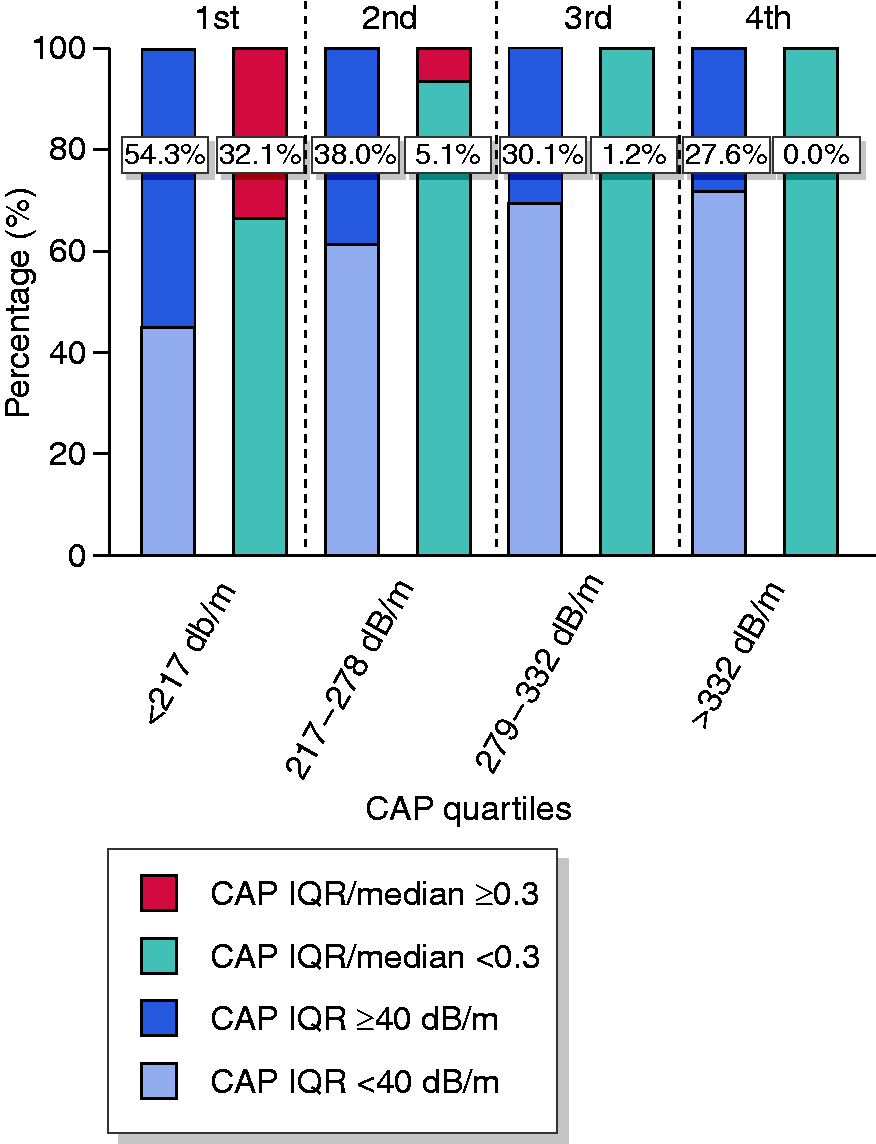
Finally, we compared different reliability criteria for the diagnosis of HS ≥ S2 and ≥ S3. These analyses did not reveal a statistically significant difference in AUC values, if stratified by CAP-IQR or CAP-IQR/median cut-offs (Supplementary Table 3).
Discordance between CAP and liver histology
Compared with 93 (29.2%)/ 100 (31.3%)/ 67 (21.0%)/ 59 (18.5%) patients with S0/S1/S2/S3 on liver histology, 124 (38.9%) patients had no HS according to CAP and 27 (8.5%) and 28 (8.8%) had values indicative for S1 and S2, respectively. Interestingly, 140 (43.9%) patients had CAP values suggesting S3. Accordingly, 67 (21.0%) had discordant results regarding presence of HS ≥ S1 and 101 (31.7%) patients had discordant results regarding presence of ≥S3. Specifically, 146 (45.8%) patients had concordant results between CAP and liver histology, 101 (31.7%) had disagreement in terms of one stage of HS while 63 (19.7%) and 9 (2.8%) patients had a difference of 2 and 3 stages, respectively (Supplementary Table 4).
A comparison of patients with discordant and concordant results regarding presence of HS ≥ S1 revealed similar results to the previously mentioned comparison of patients stratified by CAP-IQR/median 0.3 (Table 3). Evaluating the presence of discordant results among specific subgroups, a significantly lower prevalence was evident in obese (BMI > 30 kg/m2; p < 0.001), morbidly obese (>40 kg/m2; p = 0.024), and patients with diabetes (p = 0.005), while we observed a high prevalence in patients with cirrhosis on liver histology (F4, p = 0.018) and patients with liver stiffness >20 kPa (p = 0.012, Supplementary Table 5). Importantly, 80.6% (n = 54) of patients with discordant results regarding the presence of HS ≥ S1 had CAP-IQR/median ≥0.3, with discordant results being substantially more prevalent in this subgroup (41.3% vs. 18.8% in patients with CAP-IQR/median < 0.3, p = 0.003).
Diagnostic accuracy in specific subgroups of patients
In subgroup analyses restricted to obese patients (BMI > 30 kg/m2) and patients with diabetes representing two particularly relevant populations for CAP measurement, AUC values of CAP for diagnosing any steatosis (≥S1) were 0.871 (95%CI: 0.785–0.958) and 0.925 (95%CI: 0.844–1.000), with a high prevalence of HS ≥S1 (88.7% and 92.1%, respectively). Of note, CAP values correlated with percentage of steatotic hepatocytes (Pearson’s r = 0.371, p < 0.001) and hepatic steatosis stage (r = 0.412, p < 0.001) in obese patients.
In these subgroups, 59.4% and 73.3% achieved a CAP-IQR <40 dB/m while 94.0% and 97.4% had CAP-IQR/median <0.3. While the AUC was similar in obese patients with CAP-IQR <40 dB/m (0.865 [95%CI: 0.716–1.000]) and ≥40 dB/m (0.847 [95%CI: 0.733–0.962]), the diagnostic performance of CAP for diagnosing HS ≥ S1 was numerically worse in patients with CAP-IQR/median ≥0.30 (0.533 [95%CI: 0.101–0.965] vs. 0.879 [95%CI: 0.780–0.979]) (Supplementary Table 6). Interestingly, AUC values of CAP for ≥ S1 were only 0.667 (95%CI: 0.376–0.957) in patients with cholestatic liver disease and 0.620 (95%CI: 0.316–0.924) in patients with AIH.
Factors influencing CAP and its performance
CAP values were negatively associated with alkaline phosphatase (AP) and gamma-glutamyltransferase (γ-GT) in univariate analyses, which vanished when correcting for other factors. Notably, serological markers of inflammation or cholestasis were not associated with CAP-IQR (Supplementary Table 2). The diagnostic performance of CAP for HS ≥ S1 was comparable to the overall cohort in patients with hepatic inflammation (alanine amino transferase [ALT] or gamma-glutamyltransferase [γ-GT] >2 × sex-specific-upper-limit-of-normal, but tended to decline in patients with liver stiffness >20 kPa (0.780 [95%CI: 0.687–0.873]; Supplementary Table 5). When comparing the AUC for HS ≥ S1 among patients stratified according to histological inflammation in patients with NAFLD and viral hepatitis separately, no significant difference was evident (Supplementary Table 7). However, mean CAP values numerically increased with a higher inflammation grade in the same HS stage, being most pronounced in NAFLD patients with HS ≥ S3 (p = 0.018; Supplementary Table 8). Interestingly, CAP values tended to be independently associated with histological inflammation in patients with NAFLD in an analysis adjusted for HS stage (B for histological inflammation grade = 14.987, p = 0.060) or adjusted for % of steatotic hepatocytes (B for histological inflammation grade = 14.049, p = 0.078). In contrast, hepatic inflammation did not seem to influence CAP in a similar analysis restricted to patients with viral hepatitis (p = 0.336 and 0.349, respectively).
Discussion
In the present study, we evaluated the diagnostic performance of CAP for HS in 319 patients using liver biopsy as the reference standard and observed a good performance for diagnosing HS ≥ S1 at an optimal cut-off of >246 dB/m (AUC: 0.843). The diagnostic performance of CAP for more severe hepatic steatosis (i.e. ≥S2 and ≥S3) tended to be worse (both AUC < 0.8), which is in line with previous reports. 29 These findings underline the limited ability of CAP for differentiating individual grades of HS, and thus, monitor changes in HS over time.
More stringent reliability criteria such as CAP-IQR <20 dB/m or CAP-IQR/median <0.1 yielded the numerically highest AUC values. However, applying these criteria in clinical routine would have left a considerable proportion of patients (i.e. 81.2% and 62.1%, respectively) with unreliable measurements. Accordingly, these criteria would have substantially worsened the diagnostic value and clinical utility of CAP when evaluating the results by an intention to diagnose approach in the overall cohort. If applied in clinical routine, these criteria may raise the number of unnecessary further investigations, which are either resource-consuming and not broadly available (MRI) or invasive (liver biopsy). Importantly, CAP-IQR <40 dB/m was not associated with a significantly higher AUC and would have classified 37.6% of measurements as unreliable, potentially leaving more than one-third of patients without reliable results.
On the contrary, we identified CAP-IQR/median <0.10, 0.20, and 0.30 as valid reliability criteria since patients meeting these criteria had significantly higher AUC values for the non-invasive diagnosis of any HS, as compared with patients not meeting these criteria. Of note, the restrictive CAP-IQR/median <0.10 and 0.20 criteria led to the highest AUC values: 0.935 (0.871–1.000) and 0.875 (0.823–0.927), respectively. However, using less restrictive CAP-IQR/median criteria the proportion of patients without a reliable non-invasive CAP result was substantially reduced when compared with restrictive CAP-IQR/median or CAP-IQR criteria, since only 9.7% of patients had CAP-IQR/median ≥0.3. These findings indicate that a CAP-IQR/median <0.3 reliability criterion is more appropriate for clinical routine, as it maximizes the clinical utility of the diagnostic method, while still detecting a relevant proportion of patients in whom the diagnostic performance of CAP is not better than flipping a coin. Still, the confidence in the correct diagnosis of any steatosis by CAP measurement is highest in patients with a CAP-IQR/median <0.10 and 0.20.
In the study that initially proposed the CAP-IQR <40 dB/m reliability criterion, Wong and co-workers 15 discarded CAP-IQR/median as a potential reliability criterion, since they observed a negative correlation with CAP values (i.e. a lower prevalence of these criteria in patients with high CAP values). However, our findings challenge this approach: as previously mentioned, the main strength and clinical use of CAP is the confirmation of NAFLD (i.e. HS ≥ S1) and the diagnosis of any hepatic steatosis (i.e. HS ≥ S1) in other CLD aetiologies. The presence of HS ≥ S1 is highly likely in patients with high median CAP values, regardless of the dispersion of the individual measurements (as assessed by CAP-IQR). This was also confirmed by our study, as a median CAP of >279 dB/m was 90% specific for the presence of HS ≥ S1. Accordingly, in these patients, about 25–30% would have been left without a reliable non-invasive diagnosis due to CAP-IQR ≥40 dB/m, despite a 94.5% prevalence of HS ≥ S1. In contrast, this occurred only in 0–1.2% of patients when using the CAP-IQR/median ≥0.3 criterion.
Importantly, all reliability criteria failed to improve the diagnostic performance for HS ≥ S2 or ≥ S3 in our study, indicating that this is a general limitation of the technique, which cannot be overcome by simple reliability criteria. Of note, the proposed reliability criterion of CAP-IQR < 40 dB/m has not been evaluated for the diagnosis of moderate ( ≥ S2) and severe steatosis (≥S3) in previous studies.
Despite recent concerns about the accuracy of CAP in morbidly obese patients and patients with diabetes, 13 we found a good diagnostic performance of CAP in obese patients (BMI > 30 kg/m2; AUC: 0.871) and observed correlations with the percentage of fatty hepatocytes and HS stage. In addition, we found a good accuracy for HS ≥ S1 with an AUC of 0.925 in patients with diabetes, being a potential target population for HS assessment. Information is scarce on the value of CAP in patients with cholestatic liver disease and AIH. Therefore, we attempted to evaluate CAP in these aetiologies and found a poor diagnostic performance of CAP for HS ≥ S1 with AUC values of 0.667 and 0.620 and high proportions of discordant results (23.5% and 40.0%). Similar findings were reported by Wong and co-workers, 15 who observed an AUC of 0.62 in the subgroup of patients with cholestatic liver disease. Therefore, CAP needs to be interpreted with caution in these patients. Apart from diabetes and BMI, liver fibrosis has been suggested as a factor influencing CAP values.13,30,31 However, reports on its impact are inconsistent, but could have attenuated the correlation of CAP and histology in our cohort. Of note, inflammation (as assessed serologically) does not significantly impact on the performance of CAP, 13 which has been confirmed by our study. Interestingly, histological inflammation may increase CAP values in patients with NAFLD; however, we did not observe such an influence in patients with viral hepatitis. The potential impact of histological hepatic inflammation on CAP values warrants investigation in larger series of NAFLD patients.
This study has several limitations. We evaluated the performance of CAP in a real-world cohort of patients to simulate its use in clinical routine, which created a cohort of mixed aetiologies. Importantly, some of the diagnostic indices of non-invasive methods largely depend on the prevalence of the condition of interest. As this might also apply for the performance of quality criteria, the external validity of our findings has to be confirmed by further studies in different patient cohorts. However, at the same time, our observations are likely to be applicable to other settings, as our cohort might be representative for patients undergoing CAP at a tertiary centre. However, due to the small numbers of patients in several subgroups (e.g. cholestatic liver disease and AIH), our findings regarding these patient groups require confirmation in larger populations. Moreover, it is unclear whether a retest should be attempted in patients with CAP-IQR/median <0.3, or whether these patients should be directly referred to other diagnostic modalities. The significance of our findings is also limited by the use of different modalities of liver biopsy, which may have introduced some heterogeneity to our study. Both percutaneous and transjugular liver biopsies, as well as CAP measurement, were performed in the right liver lobe, while intraoperative liver biopsies were usually performed within the left lobe of the liver. Moreover, although we included only specimens with a sufficient sample length and ≥6 portal tracts in our study, the quality of the specimen may have been limited in some cases. Importantly, sampling variability and quality criteria have primarily been evaluated for staging of liver fibrosis and grading of hepatic inflammation, but not for HS. However, two studies reported a strong agreement, regardless sample lengths.32,33
In conclusion, a CAP-IQR/median <0.3 identifies assessments which are reliable for diagnosing any HS, while the previously suggested CAP-IQR < 40 dB/m criterion did not improve the diagnostic performance in our large series of real-world patients. Importantly, CAP-IQR/median <0.3 has a considerably higher applicability in clinical practice, as compared with the previously suggested CAP-IQR <40 dB/m criterion, which classified more than one-third of measurements as unreliable.
Supplemental Material
UEG900820 Supplemental Material - Supplemental material for Novel reliability criteria for controlled attenuation parameter assessments for non-invasive evaluation of hepatic steatosis
Supplemental material, UEG900820 Supplemental Material for Novel reliability criteria for controlled attenuation parameter assessments for non-invasive evaluation of hepatic steatosis by Georg Semmler, Katharina Wöran, Bernhard Scheiner, Lukas Walter Unger, Rafael Paternostro, Judith Stift, Philipp Schwabl, Theresa Bucsics, David Bauer, Benedikt Simbrunner, Albert Friedrich Stättermayer, Matthias Pinter, Michael Trauner, Thomas Reiberger and Mattias Mandorfer in United European Gastroenterology Journal
Footnotes
Acknowledgements
None.
Authorship Statement
Specific author contributions: Concept of the study (G.S., T.R., M.M.), data collection (all authors), statistical analysis (G.S., M.M.), drafting of the manuscript (G.S., T.R., M.M.), revision for important intellectual content (all authors). All authors approved the final version of this article.
Declaration of conflicting interests
The following authors disclose conflicts of interests outside the submitted work: B.S. received travel support from AbbVie and Gilead. J.S. received grant support from Gilead, as well as Eli Lilly and Company. P.S. received travel support from Boehringer Ingelheim and Gilead as well as speaker fees from Boehringer Ingelheim. T.B. received travel support from AbbVie, Bristol-Myers Squibb, and Medis, as well as speaker fees from Bristol-Myers Squibb. B.S. received travel support from AbbVie. M.P. received travel support from Bayer and served as advisory board member for Bayer, Bristol-Myers Squibb and Eisai. M.T. received travel support from AbbVie and Gilead, grant support from Cymabay, Falk, Gilead, Intercept, MSD, and Takeda, honoraria for consulting from AbbVie, Gilead, Intercept, MSD, and Regulus, as well as speaker fees from Falk, Gilead, and MSD. T.R. received travel support from Boehringer Ingelheim and Gilead, grant support from AbbVie, Boehringer Ingelheim, Gilead, MSD, Philips Healthcare, and W.L. Gore, speaker fees from Gilead, Intercept, MSD, and W.L. Gore, as well as honoraria for consulting from AbbVie, Boehringer Ingelheim, Gilead, and MSD. M.M. received travel support from AbbVie, Bristol-Myers Squibb, Gilead, and Medis, grant support from Medis, as well as honoraria for consulting and/or speaking from AbbVie, Bristol-Myers Squibb, Gilead, and W.L. Gore. G.S., K.W., U.L., R.P. and A.F.S. have nothing to disclose.
Funding
The authors received no financial support for the research, authorship, and/or publication of this article.
References
Supplementary Material
Please find the following supplemental material available below.
For Open Access articles published under a Creative Commons License, all supplemental material carries the same license as the article it is associated with.
For non-Open Access articles published, all supplemental material carries a non-exclusive license, and permission requests for re-use of supplemental material or any part of supplemental material shall be sent directly to the copyright owner as specified in the copyright notice associated with the article.