
Abstract
Background
The FibroScan® XL probe reduces failure of liver stiffness measurement (LSM) and unreliable results in obese patients.
Objective
The objective of this article is to evaluate the accuracy of controlled attenuation parameter (CAP) obtained using the XL probe for the estimation of hepatic steatosis in patients with non-alcoholic fatty liver disease (NAFLD).
Methods
Adult NAFLD patients with a liver biopsy within six months were included and were examined with the FibroScan® M and XL probes. Histopathological findings were reported according to the Non-Alcoholic Steatohepatitis Clinical Research Network Scoring System. Participants who did not have fatty liver on ultrasonography were recruited as controls.
Results
A total of 57 NAFLD patients and 22 controls were included. The mean age of the NAFLD patients and controls was 50.1 ± 10.4 years and 20.2 ± 1.3 years, respectively (p = 0.000). The mean body mass index was 30.2 ± 5.0 kg per m2 and 20.5 ± 2.4 kg per m2, respectively (p = 0.000). The distribution of steatosis grades were: S0, 29%; S1, 17%; S2, 35%; S3, 19%. The AUROC for estimation of steatosis grade ≥ S1, S2 and S3 was 0.94, 0.80 and 0.69, respectively, using the M probe, and 0.97, 0.81 and 0.67, respectively, using the XL probe.
Conclusion
CAP obtained using the XL probe had similar accuracy as the M probe for the estimation of hepatic steatosis in NAFLD patients.
Keywords
Background
Non-alcoholic fatty liver disease (NAFLD) is a major cause of liver disease worldwide with an estimated global prevalence of 25%. 1 The prevalence of NAFLD was 27% in a population-based study in Hong Kong. 2 In a study of healthy individuals attending medical health screening at a suburban medical facility in Malaysia, the prevalence of NAFLD was found to be 22.7%. 3 In a separate study, NAFLD was found in one in every two patients with diabetes mellitus. 4 NAFLD is also seen in a significant proportion of young adults, with a study estimating the prevalence to be 7.9%. 5 Histopathological examination of a liver biopsy specimen allows assessment of the severity of liver disease in the patient with NAFLD. However, the liver biopsy procedure is invasive and associated with pain and a small risk of serious complications.
Liver stiffness measurement (LSM) is an accurate, noninvasive tool to estimate the degree of fibrosis in patients with NAFLD. 6 The decrease in amplitude of ultrasound as it is propagated through the liver tissue can be estimated using the same radio-frequency data that are used for estimation of LSM using FibroScan® (Echosens, Paris, France), and is called controlled attenuation parameter (CAP). CAP has been shown to be good to excellent for the quantification of hepatic steatosis in patients with chronic liver disease. 7 In a study of 101 biopsy-proven NAFLD patients and 60 non-NAFLD controls, we found CAP obtained using the M probe to be excellent for the detection of significant hepatic steatosis but it was less accurate to distinguish between the different grades of significant hepatic steatosis in obese individuals. 8
The XL probe was introduced by the manufacturer of FibroScan® to overcome the limitation of the M probe in obese patients. The XL probe has a greater depth of measurement below the skin surface and has been shown to reduce failure of LSM and unreliable results in obese patients. Myers and colleagues 9 found that failure of LSM was less frequent with the XL probe (1.1%) compared with the M probe (16%) and that the XL probe was more often reliable (73%) compared with the M probe (50%) in their study on patients with body mass index (BMI) ≥28 kg per m2. Recently, CAP for the XL probe was successfully validated on Field II simulations and on tissue-mimicking phantoms, and in vivo performance was found to be good using magnetic resonance imaging as the reference standard. 10 However, its performance using histology as a reference standard has not been evaluated thus far. The primary aim of our study was to evaluate the accuracy of CAP obtained using the XL probe for the estimation of hepatic steatosis in NAFLD patients and to compare it with the M probe. The secondary aim was to compare the accuracy of LSM obtained using the XL probe and the M probe for the estimation of fibrosis stage in NAFLD patients.
Materials and methods
The study was conducted at the University of Malaya Medical Centre, Kuala Lumpur, Malaysia, and the Prince of Wales Hospital, Hong Kong, and included all adult NAFLD patients (aged ≥ 18 years) who had a liver biopsy within six months of the study period. The diagnosis of NAFLD was based on ultrasonography finding of fatty liver, and exclusion of significant alcohol intake, use of medications that can cause fatty liver, viral hepatitis B and C infection and other causes of chronic liver disease where indicated. 11 An additional 22 healthy people who did not have fatty liver on ultrasonography were recruited as controls. A liver biopsy was not performed for controls because of ethical considerations, but all other relevant data were obtained. Controls were considered to have a normal liver biopsy for the purpose of data analysis. The study was approved by the Medical Ethics Committee of the University of Malaya Medical Centre (MECID no.: 20151-972), and all individuals who participated provided informed consent.
Demographic, anthropometric, and relevant clinical and laboratory data were obtained using a standard protocol on the day of the liver biopsy procedure. BMI was calculated by dividing weight in kilogram by the square of height in meters. Individuals with BMI ≥ 25.0 kg per m2 were considered obese. 12 Waist circumference (WC) was measured at the midpoint between the lowest margin of the least palpable rib and the top of the iliac crest in the standing position. Central obesity was defined as WC > 90 cm for men and >80 cm for women. 13 All participants had venous blood drawn after an overnight fast for blood glucose, lipid profile, liver profile, and tests for viral hepatitis B and C infection. The Elecsys HBsAg II assay and the Elecsys Anti-HCV II assay (Roche, Mannheim, Germany) were used to test for viral hepatitis B and C infection, respectively.
Liver biopsy and histological assessment
Ultrasonography-guided percutaneous liver biopsy was performed using an 18 G Temno® II semi-automatic biopsy needle (Cardinal Health, Dublin, OH, USA). Liver biopsy slides were stained with hematoxylin and eosin stain and Masson’s trichrome stain. Liver biopsy slides were examined by an experienced histopathologist (NRNM) who was blinded to the clinical data. Histopathological findings were reported according to the Non-Alcoholic Steatohepatitis Clinical Research Network Scoring System. 14 The NAFLD activity score (NAS) is the sum of scores for hepatic steatosis (0–3), lobular inflammation (0–3) and hepatocyte ballooning (0–2). Hepatic steatosis was graded as follows: S0 = steatosis < 5%, S1 = steatosis 5%–33%, S2 = steatosis 33%–66%, and S3 = steatosis > 66%. Steatosis was considered significant at a grade of ≥S1. Fibrosis was staged as follows: F0 = no fibrosis, F1 = mild fibrosis, F2 = moderate fibrosis, F3 = severe fibrosis, and F4 = cirrhosis.
Transient elastography
Transient elastography was performed after overnight fasting using the FibroScan® 502 Touch with the M probe followed by the XL probe (Echosens, Paris, France). Each of the probes has a mechanical vibrator that generates a shear-wave, and the velocity of the shear-wave as it penetrates through tissue is measured by an ultrasound transducer mounted in the same axis within the probe. The ultrasound transducer of the XL probe uses a lower frequency (2.5 MHz vs. 3.5 MHz), and measures at a greater depth (35 mm–75 mm vs. 25 mm–65 mm) compared with the M probe. The frequency of the shear-wave generated by the mechanical vibrator is the same for both probes (50 Hz).
Participants were placed in a supine position with the right shoulder fully abducted and the right wrist placed behind the head, and the trunk flexed laterally to the left to expose the intercostal spaces. An imaginary vertical line from the xiphisternum was used to guide the placement of the probe over the liver at the intercostal space. Adequate pressure of the probe on the skin surface, good layering on TM mode and a straight imaginary line on A mode were ensured for each measurement. Ten valid measurements were obtained for each probe for each patient on the same spot. An examination was considered successful if there were 10 valid measurements, and reliable if the interquartile range (IQR)/median for LSM was ≤30%, or the LSM was <7.1 kPa when the IQR/median for LSM was >30%. 15 Participants with unsuccessful or unreliable examination with either the M probe or the XL probe were excluded from the analysis. The operator was blinded to the results of the liver biopsy at the time of performing the transient elastography measurements.
Statistical analysis
Sample size was calculated based on previously reported area under the curve (AUC) of 0.64 and 0.58 when using the M probe in obese NAFLD patients for estimation of hepatic steatosis ≥S2 and ≥S3, respectively. 8 The anticipated AUC when using the XL probe was set at 0.90. The required sample size for comparison of two diagnostic methods on the same individuals for AUC of 0.64 and for detection of an effect of 0.26 with 95% confidence level and 80% power is 50. The required sample size for comparison of two diagnostic methods on the same individuals for AUC of 0.58 and for detection of an effect of 0.32 with 95% confidence level and 80% power is 36. 16
Data were analyzed using a standard statistical software program (SPSS 15.0, SPSS Inc, Chicago, IL, USA). Continuous variables were expressed as mean ± standard deviation or median (IQR) as appropriate. Categorical variables were expressed as percentages. Boxplots were used to show the distribution of CAP values obtained using the M probe and the XL probe according to the grades of steatosis, and the distribution of LSM values obtained using the M probe and the XL probe according to the stages of fibrosis. LSM and CAP values for the different groups were compared using the Mann-Whitney test and the Kruskal-Wallis test. Significance was assumed when p < 0.05. The performance of LSM and CAP obtained using the M probe and the XL probe for the diagnosis of the fibrosis stages and the steatosis grades was determined using area under receiver operating characteristic curve (AUROC). AUROC was interpreted as follows: 0.90–1.00 = excellent, 0.80–0.90 = good, 0.70–0.80 = fair, <0.70 = poor. The optimal cut-off values of LSM for the diagnosis of the fibrosis stages, and of CAP for the diagnosis of the steatosis grades, were the values that provided the greatest sum of sensitivity and specificity. The sensitivity, specificity, positive-predictive value, and negative-predictive value using the optimal cut-off values were determined. MedCalc (MedCalc Software, Ostend, Belgium) was used to determine the 95% confidence interval (CI) for AUROCs and for pairwise comparison of AUROCs.
Results
Characteristics of the overall study population, healthy controls and NAFLD patients

NAFLD: non-alcoholic fatty liver disease; SBP: systolic blood pressure; DBP: diastolic blood pressure; FBS: fasting blood sugar; HDL: high-density lipoprotein; LDL: low-density lipoprotein; ALP: alkaline phosphatase; ALT: alanine aminotransferase; AST: aspartate aminotransferase; GGT: gamma glutamyl transpeptidase; E: liver stiffness measurement; IQR: interquartile range; CAP: controlled attenuation parameter; S: steatosis grade; F: fibrosis stage.
CAP values according to steatosis grade
The CAP values obtained using the M probe and the XL probe for the different steatosis grades are illustrated in Figure 1. The median (IQR) of CAP values obtained using the M probe for steatosis grades S0, S1, S2 and S3 were 205 (175–247) dB/m, 324 (268–350) dB/m, 321 (299–341) dB/m and 330 (299–344) dB/m, respectively (p < 0.001). CAP values were significantly different between S0 and S1 (p < 0.001), but not S1 and S2 (p = 0.790) and S2 and S3 (p = 0.858). The median (IQR) of CAP values obtained using the XL probe for steatosis grades S0, S1, S2 and S3 were 220 (191–248) dB/m, 339 (302–368) dB/m, 345 (298–389) dB/m and 345 (305–368) dB/m, respectively (p < 0.001). CAP values were significantly different between S0 and S1 (p < 0.001), but not S1 and S2 (p = 0.674) and S2 and S3 (p = 0.769). Overall, the XL probe provided significantly higher CAP values compared with the M probe (p < 0.001). CAP values were significantly higher when obtained using the XL probe compared with the M probe for steatosis grade S2 (p = 0.001). There was a trend toward higher CAP values obtained using the XL probe compared with the M probe for steatosis grades S0 (p = 0.194), S1 (p = 0.142) and S3 (p = 0.053).
Controlled attenuation parameter according to steatosis grade using the M probe and the XL probe.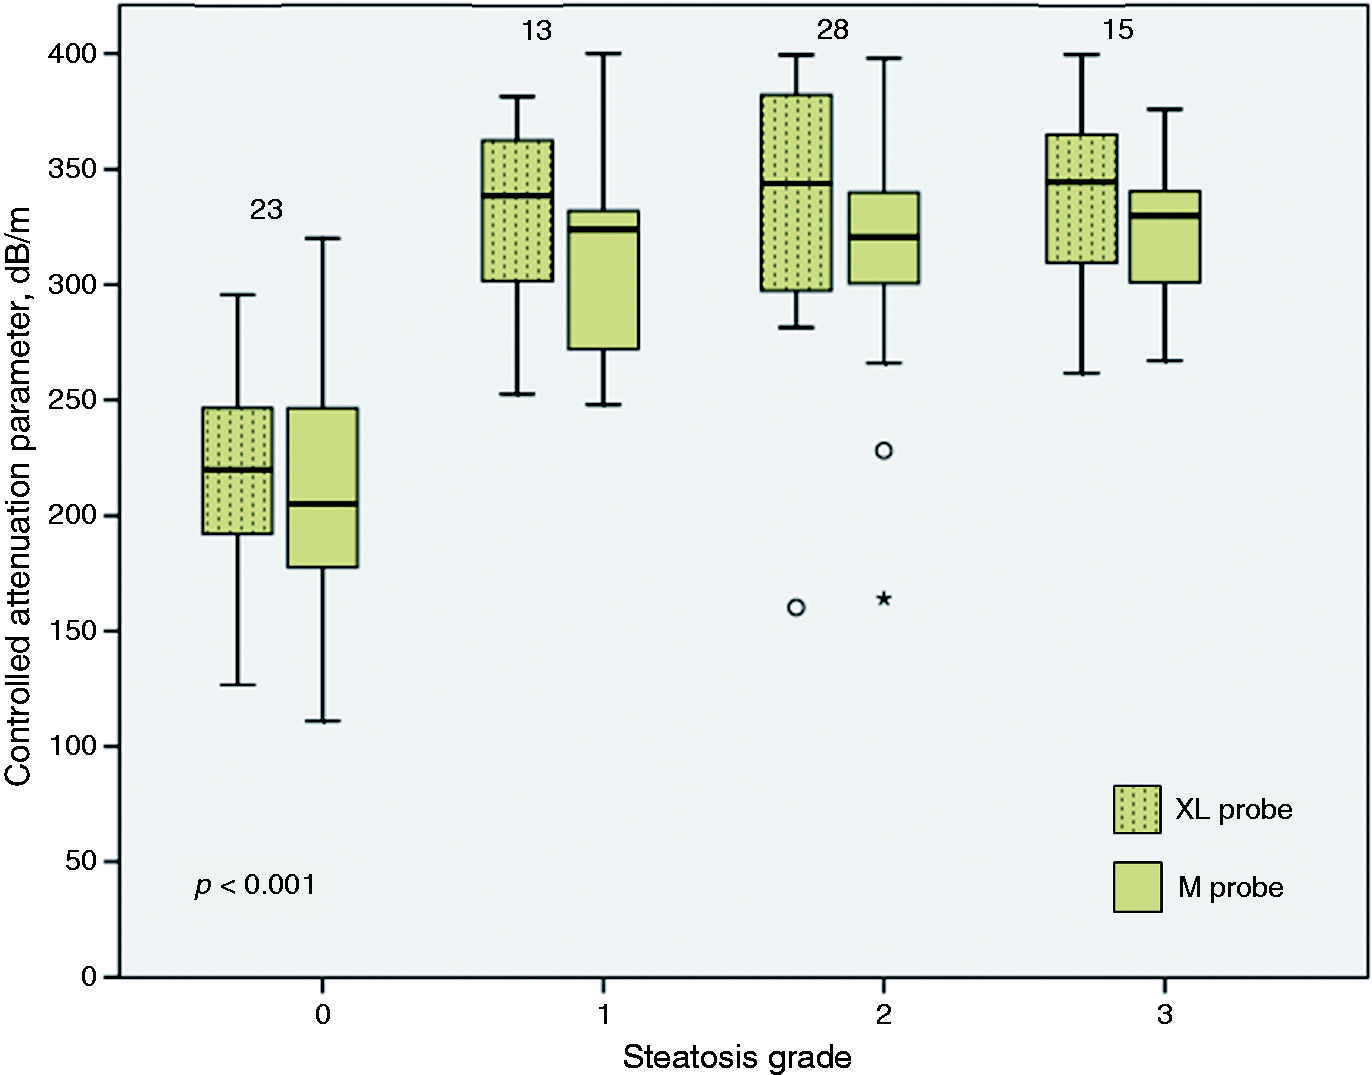
LSM values according to fibrosis stage
The LSM values obtained using the M probe and the XL probe for the different fibrosis stages are illustrated in Figure 2. The median (IQR) of LSM values obtained using the M probe for fibrosis stages F0, F1, F2, F3 and F4 were 5.7 (4.5–6.9) kPa, 8.1 (6.7–11.5) kPa, 11.7 (9.5–13.8) kPa, 21.5 (11.5–35.4) kPa and 21.8 (15.6 – 26.3) kPa, respectively (p < 0.001). The LSM values were significantly different between F0 and F1 (p < 0.001) and F1 and F2 (p < 0.05), but not between F2 and F3 (p = 0.117) and F3 and F4 (p = 0.881). The median (IQR) of LSM values obtained using the XL probe for fibrosis stages F0, F1, F2, F3 and F4 were 4.9 (4.4–6.0) kPa, 7.6 (5.8–8.9) kPa, 9.6 (6.5–10.0) kPa, 12.5 (9.4–22.3) kPa and 17.0 (12.5–23.4) kPa, respectively (p < 0.001). The LSM values were significantly different between F0 and F1 (p < 0.001), but not between F1 and F2 (p = 0.379), F2 and F3 (p = 0.075) and F3 and F4 (p = 0.368). Overall, the XL probe provided significantly lower LSM values compared with the M probe (p < 0.001). LSM values were significantly lower when obtained using the XL probe compared with the M probe for fibrosis stages F0 (p < 0.05), F1 (p < 0.05), F2 (p < 0.05) and F3 (p < 0.05).
Liver stiffness measurement according to fibrosis stage using the M probe and the XL probe.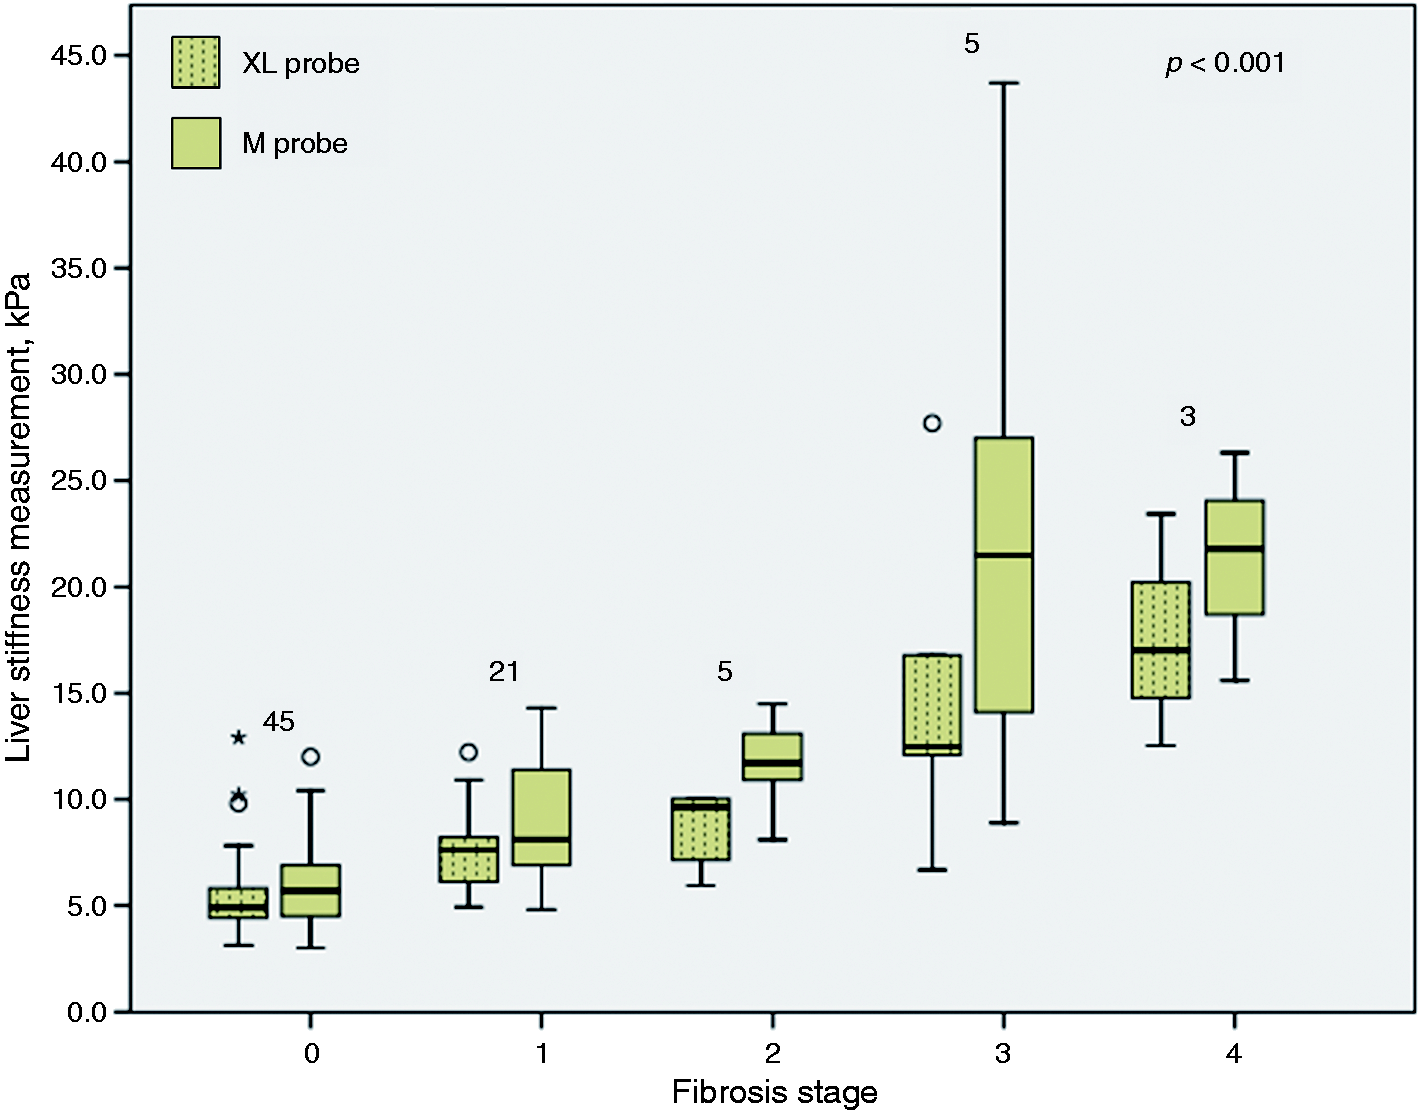
Diagnostic accuracy of CAP for the estimation of steatosis grade
The AUROC, optimal cut-off for CAP, sensitivity, specificity, positive-predictive value, and negative-predictive value for estimation of steatosis grades 1, 2 and 3
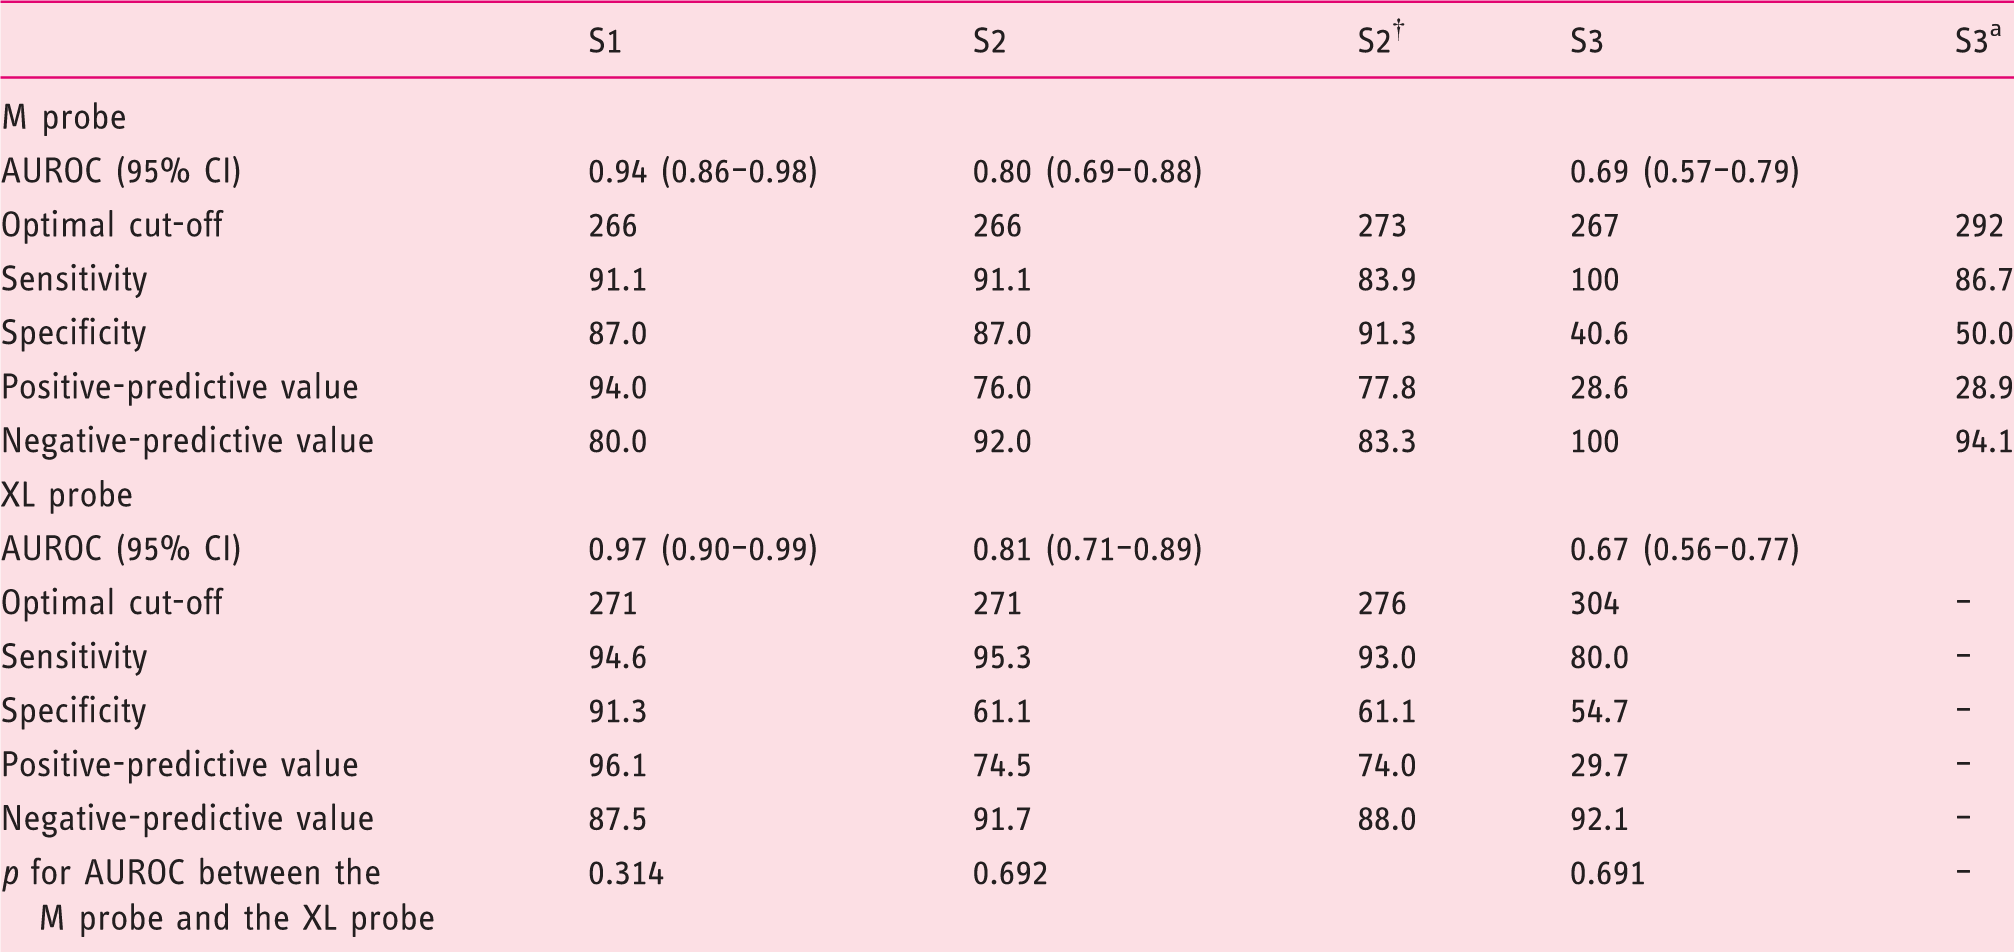
AUROC: area under receiver operating characteristic curve; 95% CI: 95% confidence interval; CAP: controlled attenuation parameter; S: steatosis grade.
Optimal cut-off is the value for CAP that provided the greatest sum of sensitivity and specificity for estimation of steatosis equal to or greater than the respective grades.
Alternative optimal cut-off is the next CAP value above the optimal cut-off that provided the greatest sum of sensitivity and specificity for estimation of steatosis equal to or greater than the respective grades.
Diagnostic accuracy of LSM for the estimation of fibrosis stage
The AUROC, optimal cut-off for LSM, sensitivity, specificity, positive predictive value, and negative predictive value for estimation of fibrosis stages 1, 2, 3 and 4
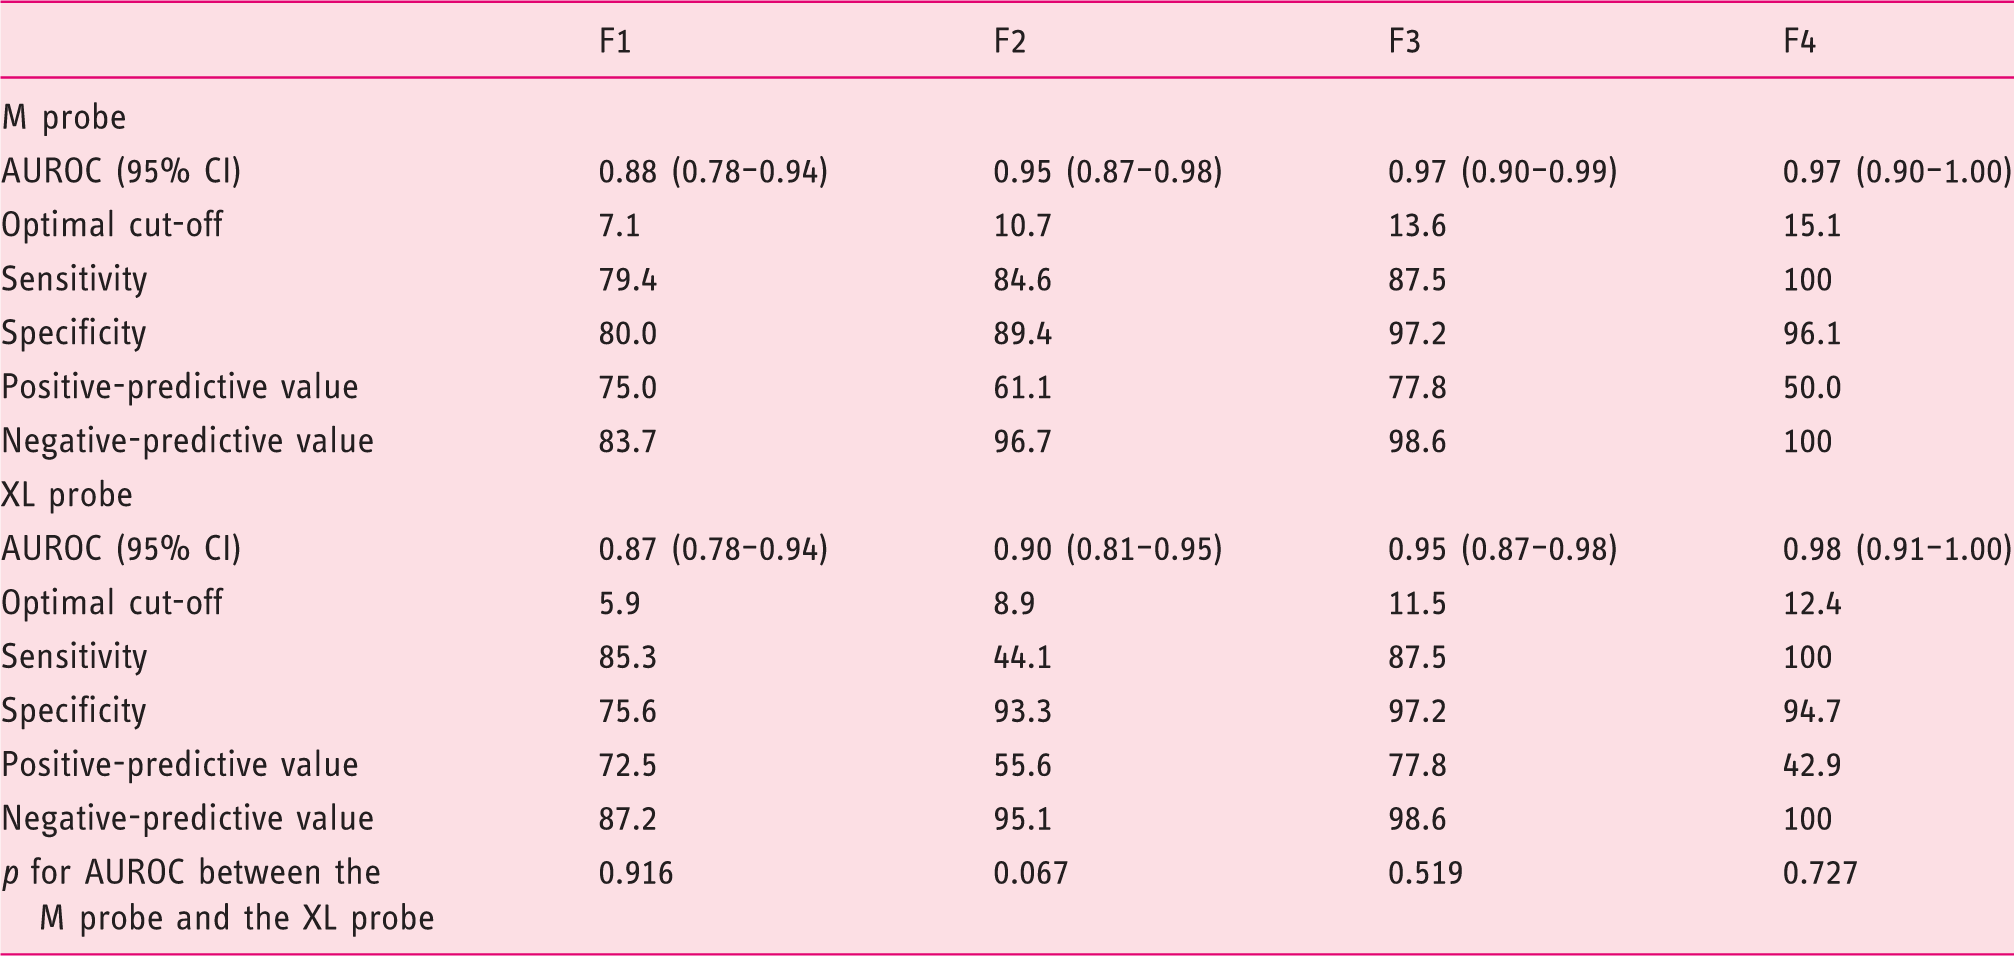
AUROC: area under receiver operating characteristic curve; 95% CI: 95% confidence interval; LSM: liver stiffness measurement; F: fibrosis stage.
Optimal cut-off is the value for LSM that provided the greatest sum of sensitivity and specificity for estimation of steatosis equal to or greater than the respective grades.
Discussion
Summary of studies on the accuracy of CAP using the M probe for the estimation of hepatic steatosis using histology as the reference standard

NAFLD: non-alcoholic fatty liver disease; SCD: skin capsular distance; BMI: body mass index; AUROC: area under receiver operating characteristic curve.
In our study on 57 NAFLD patients and 22 non-NAFLD controls, the XL probe was found to be just as accurate as the M probe for the detection of significant hepatic steatosis. The XL probe seemed to give a higher CAP value compared with the M probe. This is the first clinical study to evaluate CAP obtained using the XL probe for the estimation of hepatic steatosis using histology as the reference standard. In this study, we also found that LSM obtained using the XL probe had similar diagnostic accuracy for the estimation of fibrosis stage when compared with the M probe. Moreover, the XL probe tended to give lower LSM values when compared with the M probe. These findings are consistent with those reported previously.9,33
The FibroScan® has established itself as an important tool in the management of patients with chronic liver disease including NAFLD. It is noninvasive, simple to perform, operator independent, provides an immediate result, and is suitable for repeated assessments. LSM obtained using the FibroScan® provides an accurate estimation of the fibrosis stage in NAFLD patients, as shown in this study and many earlier studies. 34 The use of LSM for NAFLD patients with indeterminate and high NAFLD fibrosis score reduces the number of patients who would otherwise require a liver biopsy to assess for the presence or absence of advanced fibrosis. 35 At the same time, CAP can be reliably used to estimate the grade of hepatic steatosis for non-obese patients. However, different cut-offs have been reported and this may be resolved with an individual patient data meta-analysis. Whether CAP and LSM are able to predict the long-term outcome of NAFLD patients deserves further study.
Despite our best effort, this study had several limitations. Firstly, we included NAFLD patients who had a liver biopsy within six months for transient elastography in the study, and demographic, anthropometric, and relevant clinical and laboratory data that were obtained on the day of the liver biopsy procedure were used. Having the transient elastography and all the other data on the same day as the liver biopsy procedure would have been ideal but this was not possible in our study because of logistic reasons. Nevertheless, the histology, particularly steatosis and fibrosis, was unlikely to have changed substantially over the six-month period. Moreover, the LSM values for each of the fibrosis stages obtained using the M probe and the XL probe, and the CAP values for each of the steatosis grades obtained using the M probe, are consistent with those previously reported, suggesting that the histology was representative at the time that transient elastography was performed. Secondly, we did not perform a liver biopsy for controls because of ethical reasons. This may result in an overestimation of cases with steatosis grade S0. However, as CAP was able to delineate clearly between steatosis grades S0 and S1, it is unlikely that the control participants had any significant hepatic steatosis. Lastly, as in any study that uses liver histology as the reference standard, our study may be limited by sampling and observer variability.
In conclusion, findings from our study showed that CAP obtained using the XL probe has similar accuracy for the estimation of hepatic steatosis in NAFLD patients and may give a higher CAP value compared with the M probe. It also confirms the findings from previous studies that LSM obtained using the XL probe has a similar accuracy for the estimation of fibrosis stage and may give a lower LSM value compared with the M probe.
Footnotes
Funding
This work was supported by the University of Malaya Research Grant (project no.: RG536-13HTM).
Conflict of interest
None declared.
Acknowledgment
The authors would like to thank Associate Professor Dr Sanjay Rampal for his advice on sample size calculation, and Madam Talvant Kaur and Ms Wan Noor Hidayu for their assistance in the research project.