
Abstract
Introduction
Conclusive data on the accuracy and clinical applicability of non-invasive screening tests for oesophageal varices (OV) in patients with compensated cirrhosis remain lacking. We conducted this study to identify currently available tests, estimate their diagnostic performance and then exemplify how these could be utilized in clinical practice.
Materials and methods
A systematic literature search was performed to identify all primary studies that reported accuracy using oesophagogastroduodenoscopy (OGD) as the gold standard. Sources searched included Ovid MEDLINE, Ovid EMBASE and The Cochrane Library databases.
Results
Twenty-one studies with a total of 2471 patients were identified. Several tests were evaluated in more than three studies. Platelet count/spleen diameter ratio (PSR) had the highest summary area under the curve for detection of any size OV of 0.85 (95% confidence interval 0.78–0.92). At a cut-off of 909 (n = 4 studies) and prevalence rates of 10, 20, 30, 40 and 50% for OV, PSR screening correctly avoided the need for OGD in 70, 62, 55, 47 and 39% of patients, respectively.
Conclusions
PSR appears to be the most accurate and validated non-invasive screening test for OV in patients with compensated cirrhosis. At a cut-off of 909, PSR could be clinically useful to avoid OGDs in a significant proportion of patients.
Key summary
The majority of patients with compensated cirrhosis undergoing invasive screening with oesophagogastroduodenoscopy (OGD) do not have oesophageal varices (OV). Several non-invasive tests have been evaluated in this setting with variable results and cut-off values. The value of these tests in clinical practice remains unclear. Currently available non-invasive tests for OV specific to patients with compensated cirrhosis are identified and compared. Platelet count/spleen diameter ratio (PSR) appears to be the most accurate and validated test for OV in this cohort. At a cut-off of 909, PSR could be clinically utilized to avoid OGDs in a significant proportion of patients.
Introduction
Current guidelines recommend screening all patients diagnosed with liver cirrhosis for oesophageal varices (OV) using oesophagogastroduodenoscopy (OGD). 1 Present estimates suggest that only 30–40% of patients with compensated cirrhosis have OV at the index OGD. 2 Moreover, the prevalence of medium/large OV in those patients is low at approximately 10%. 3 Therefore, a large proportion of compensated cirrhosis patients currently undergo serial negative OGDs at a significant cost and additional discomfort 4 with potentially marginal clinical benefit. 5 In fact, empirical therapy with non-selective beta blockers was more cost-effective than OGD screening when both strategies were compared to no screening. 5 Thus, the stratification of patients with OV and judicious selction of patients for therapy is an important and common clincial problem.
A large number of studies have evaluated the accuracy of non-invasive serum and imaging biomarkers in predicting the presence of OV. However, both individual studies and meta-analyses have inherent limitations as they are performed on heterogeneous populations with both compensated and decompensated cirrhosis; hence, they are subject to a high risk of spectrum bias and are challenging to translate into clinical practice.6–8 Compensated cirrhosis represents a significantly different clinical entity, with lower prevalence of OV as well as lower risk of variceal bleeding and death compared to decompensated cirrhosis. 9
The availability of simple, non-invasive tests of liver fibrosis and advances in radiological imaging will inevitably result in the earlier diagnosis of cirrhosis. 10 This will enrich the number of patients with compensated cirrhosis and having data specific to this population will be imperative in guiding bespoke management strategies. The aims of this study were to: a) identify, using a systematic review, non-invasive diagnostic tests that detect OV in compensated cirrhosis; b) compare overall diagnostic performance, using meta-analysis, of different diagnostic tests in compensated cirrhosis; and c) create a clinical applicability model to highlight the number of OGDs that could be saved using non-invasive tests at a specified threshold and varying prevalence of OV.
Materials and methods
This study was conducted according to guidance provided by the Cochrane Collaboration handbook for systematic reviews, 11 and followed a pre-specified protocol.
Search strategy
We searched Ovid MEDLINE, Ovid EMBASE and The Cochrane Library databases for studies published from database inception to 1 March 2017 for relevant articles evaluating all diagnostic tests for the prediction of OV in patients with compensated cirrhosis. No restrictions were applied to the search algorithm (Supplementary Table 1).
Study selection and outcome measures
Studies were included if:
They were performed on adult patients aged 18 years or older. Subjects had proven liver cirrhosis of any aetiology, defined by typical clinical and radiological criteria with or without histological criteria.
12
Patients had compensated cirrhosis as defined by Child–Pugh A grade, or absence of ascites, encephalopathy and previous variceal haemorrhage. OGD was used as the reference standard. Sufficient data was provided to allow the generation of a 2 × 2 diagnostic table.
The primary outcome measure was the diagnostic performance of index tests for the detection of any size OV. This was chosen because identification of any OV in patients with compensated cirrhosis results in a change in clinical management, either by reduced interval of surveillance OGD or initiation of primary prophylaxis measures to prevent an index variceal bleed.
Study quality was assessed independently by two investigators (SSS and DH) using the updated version of the quality assessment of diagnostic accuracy studies (QUADAS-2) tool. 13
Statistical analysis
Meta-analyses were performed using the DerSimonian–Laird random effects model 14 to calculate (with 95% confidence intervals (Cis)): pooled sensitivity, specificity, positive likelihood ratio (LR+), negative likelihood ratio (LR−), diagnostic odds ratio DOR and summary area under the curve (AUC). Summary receiver operating characteristic curves were used to compare the overall accuracy of different tests. 15
We aimed to estimate the proportion of OGDs saved by implementing a pre-screening strategy with a non-invasive marker compared to the current practice of universal screening. This clinical applicability was evaluated using the likelihood ratios to calculate post-test probability based on Bayes’ theorem. 16 This concept is depicted visually with a Fagan’s Bayesian nomogram. 16 Estimates of the pre-test probability of OV were derived from the pooled prevalence across all studies as well as other prevalence rates reported in the literature. The clinical applicability was measured only for tests that are validated in more than one study using the same threshold as identified by our systematic review. Analysis was performed using Meta-DiSc (version 1.4, Ramón y Cajal Hospital, Madrid, Spain) and Stata (version 12.1, College Station, Texas, USA) software packages.
Heterogeneity, subgroup analyses and publication bias
Heterogeneity was examined both by visual inspection of the forest plots, and by statistical assessment using the chi-square and inconsistency (I2) tests. The I2 describes the percentage of total variation across studies that is due to heterogeneity rather than chance. Values of I2 of 25, 50 and 75% may be considered to represent low, moderate and high inconsistency. 17 Exploratory subgroup analyses were conducted to investigate sources of heterogeneity. Evidence of publication bias or small study effects was assessed using both visual inspection of the funnel plot and Deek’s asymmetry test 18 whenever there were approximately 10 or more studies included in the meta-analysis. 19 A p-value of < 0.10 was suggestive of significant asymmetry and therefore the possible presence of publication bias.
Results
The search strategy identified 5527 citations that were all screened by reading the title and abstract. We identified 185 potentially eligible articles that were all read in full. Twenty-one studies with a total of 2471 patients with compensated cirrhosis were included in the systematic review.20–40 Fifteen studies (1695 patients)20–33,39 evaluated similar markers and were also included in the meta-analysis (Figure 1). Details are summarized in Tables 1 and 2, respectively. Results of the QUADAS-2 quality assessment are shown in supplementary Table 2.
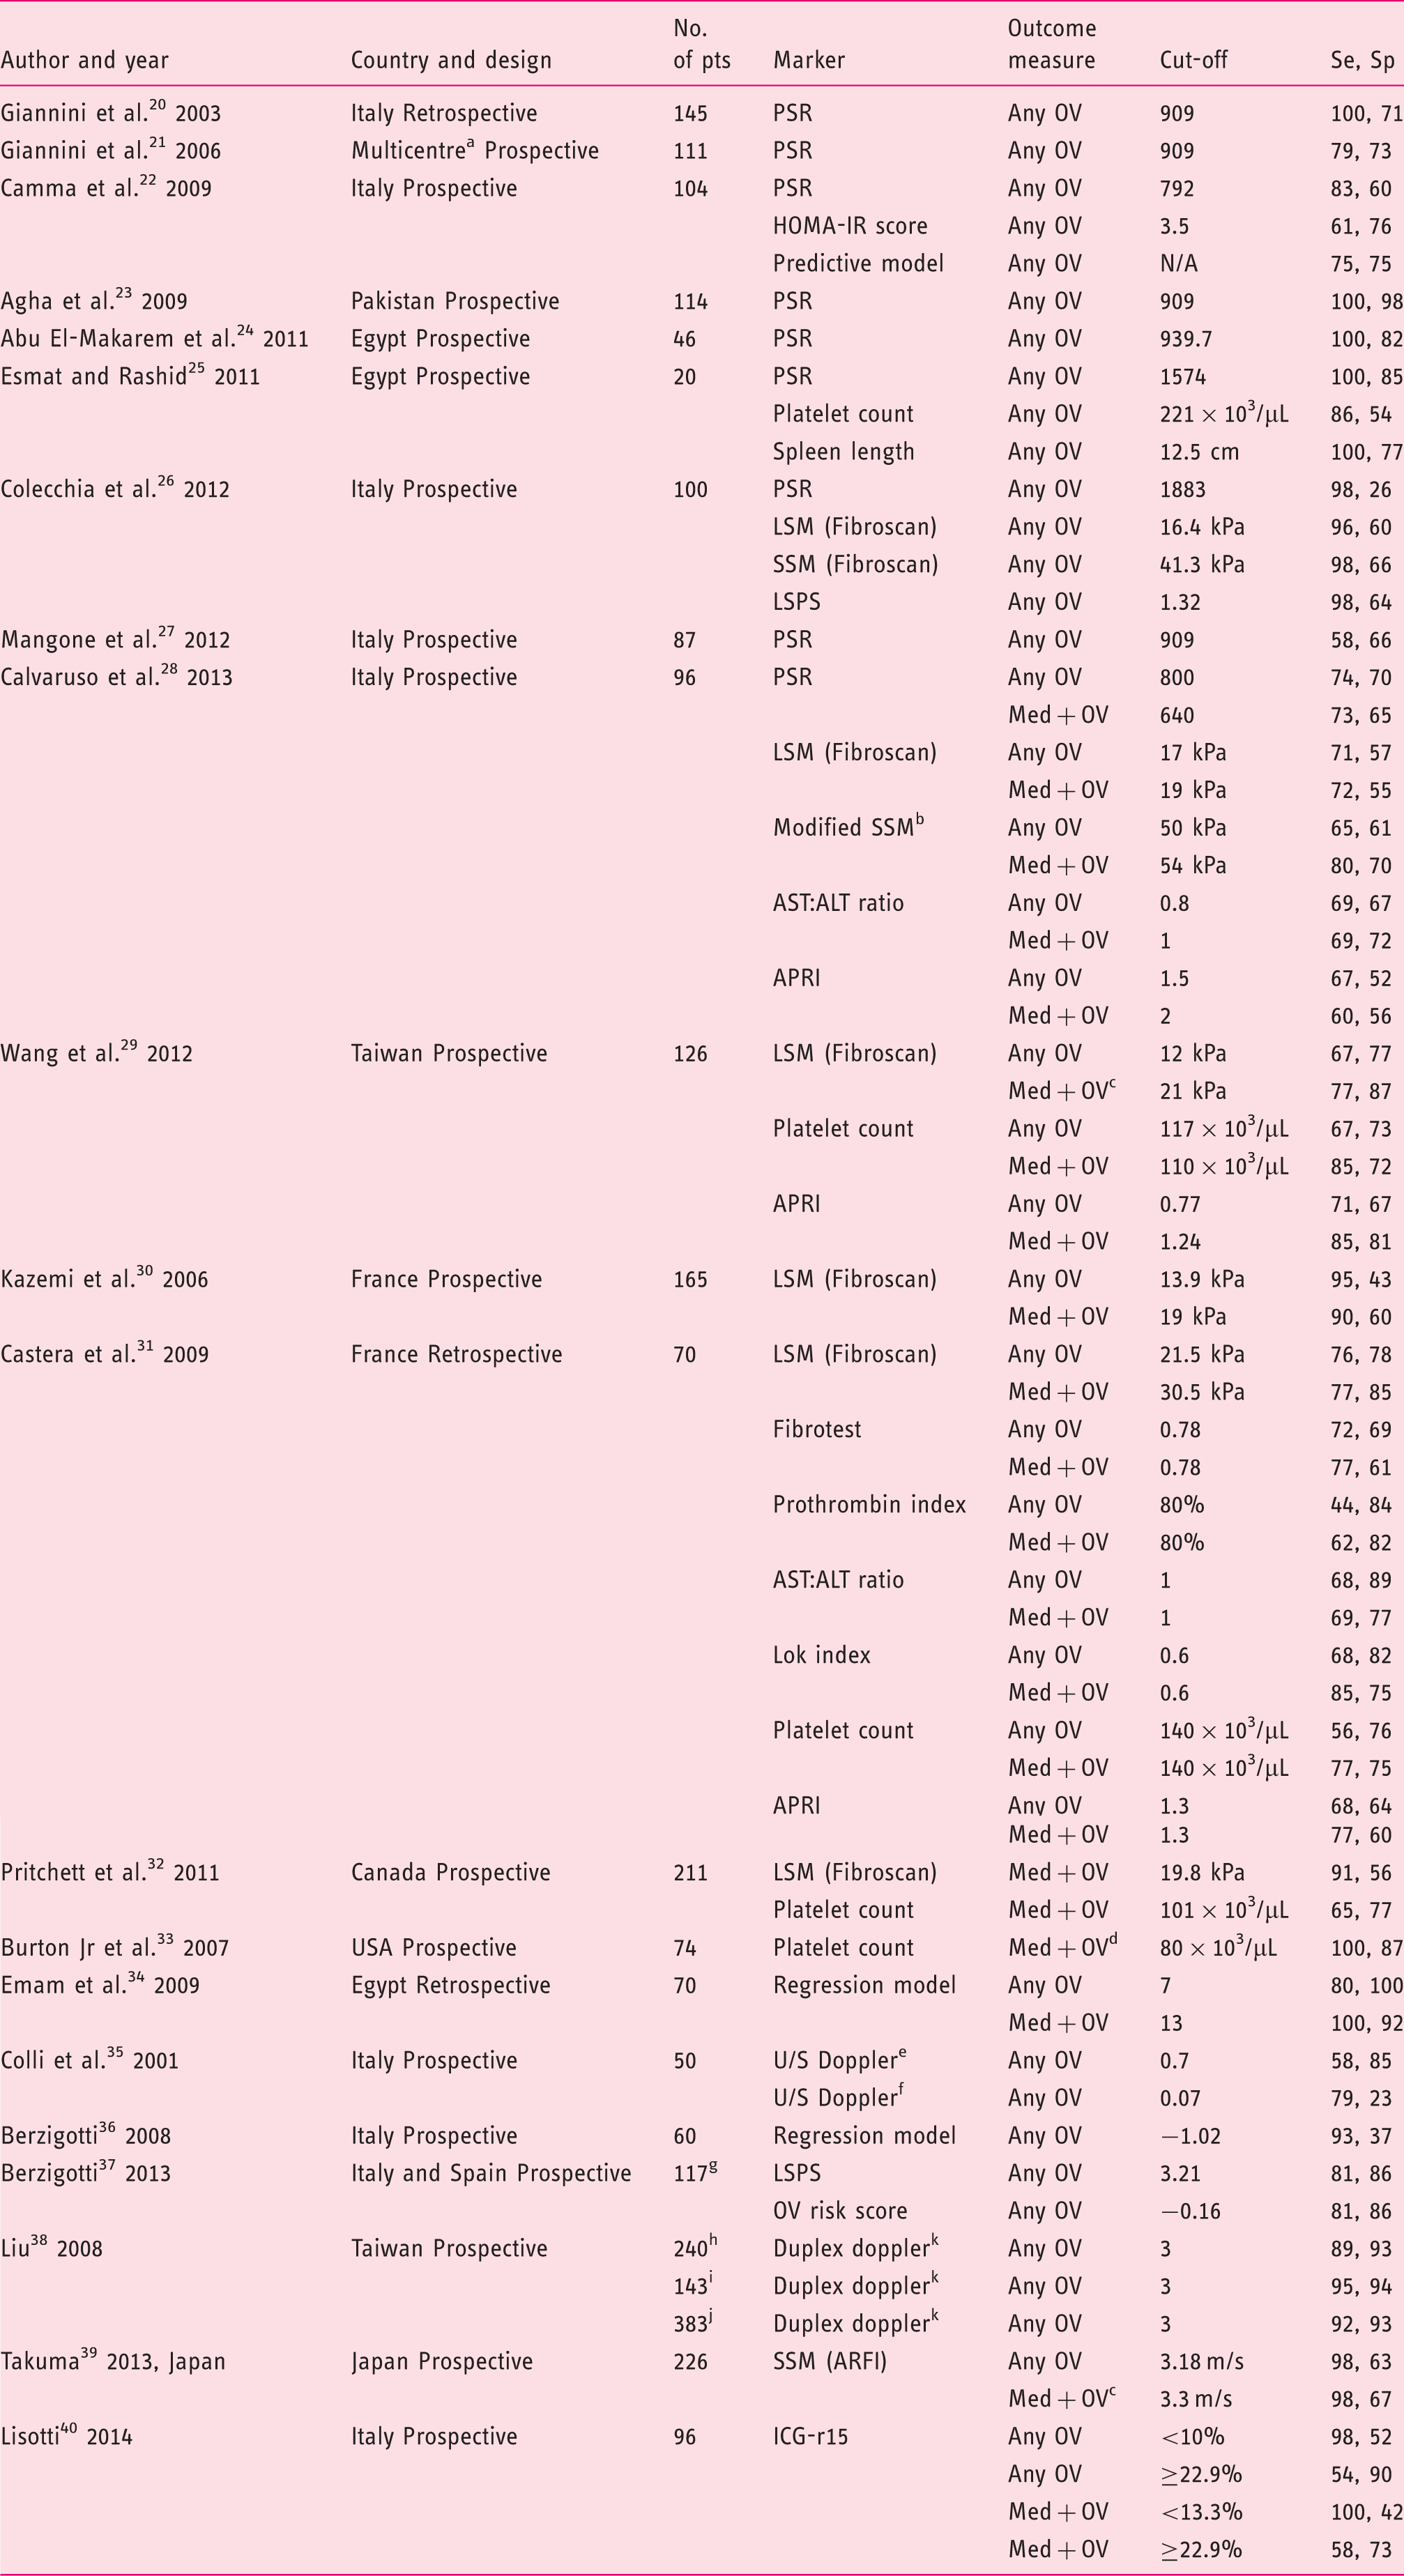
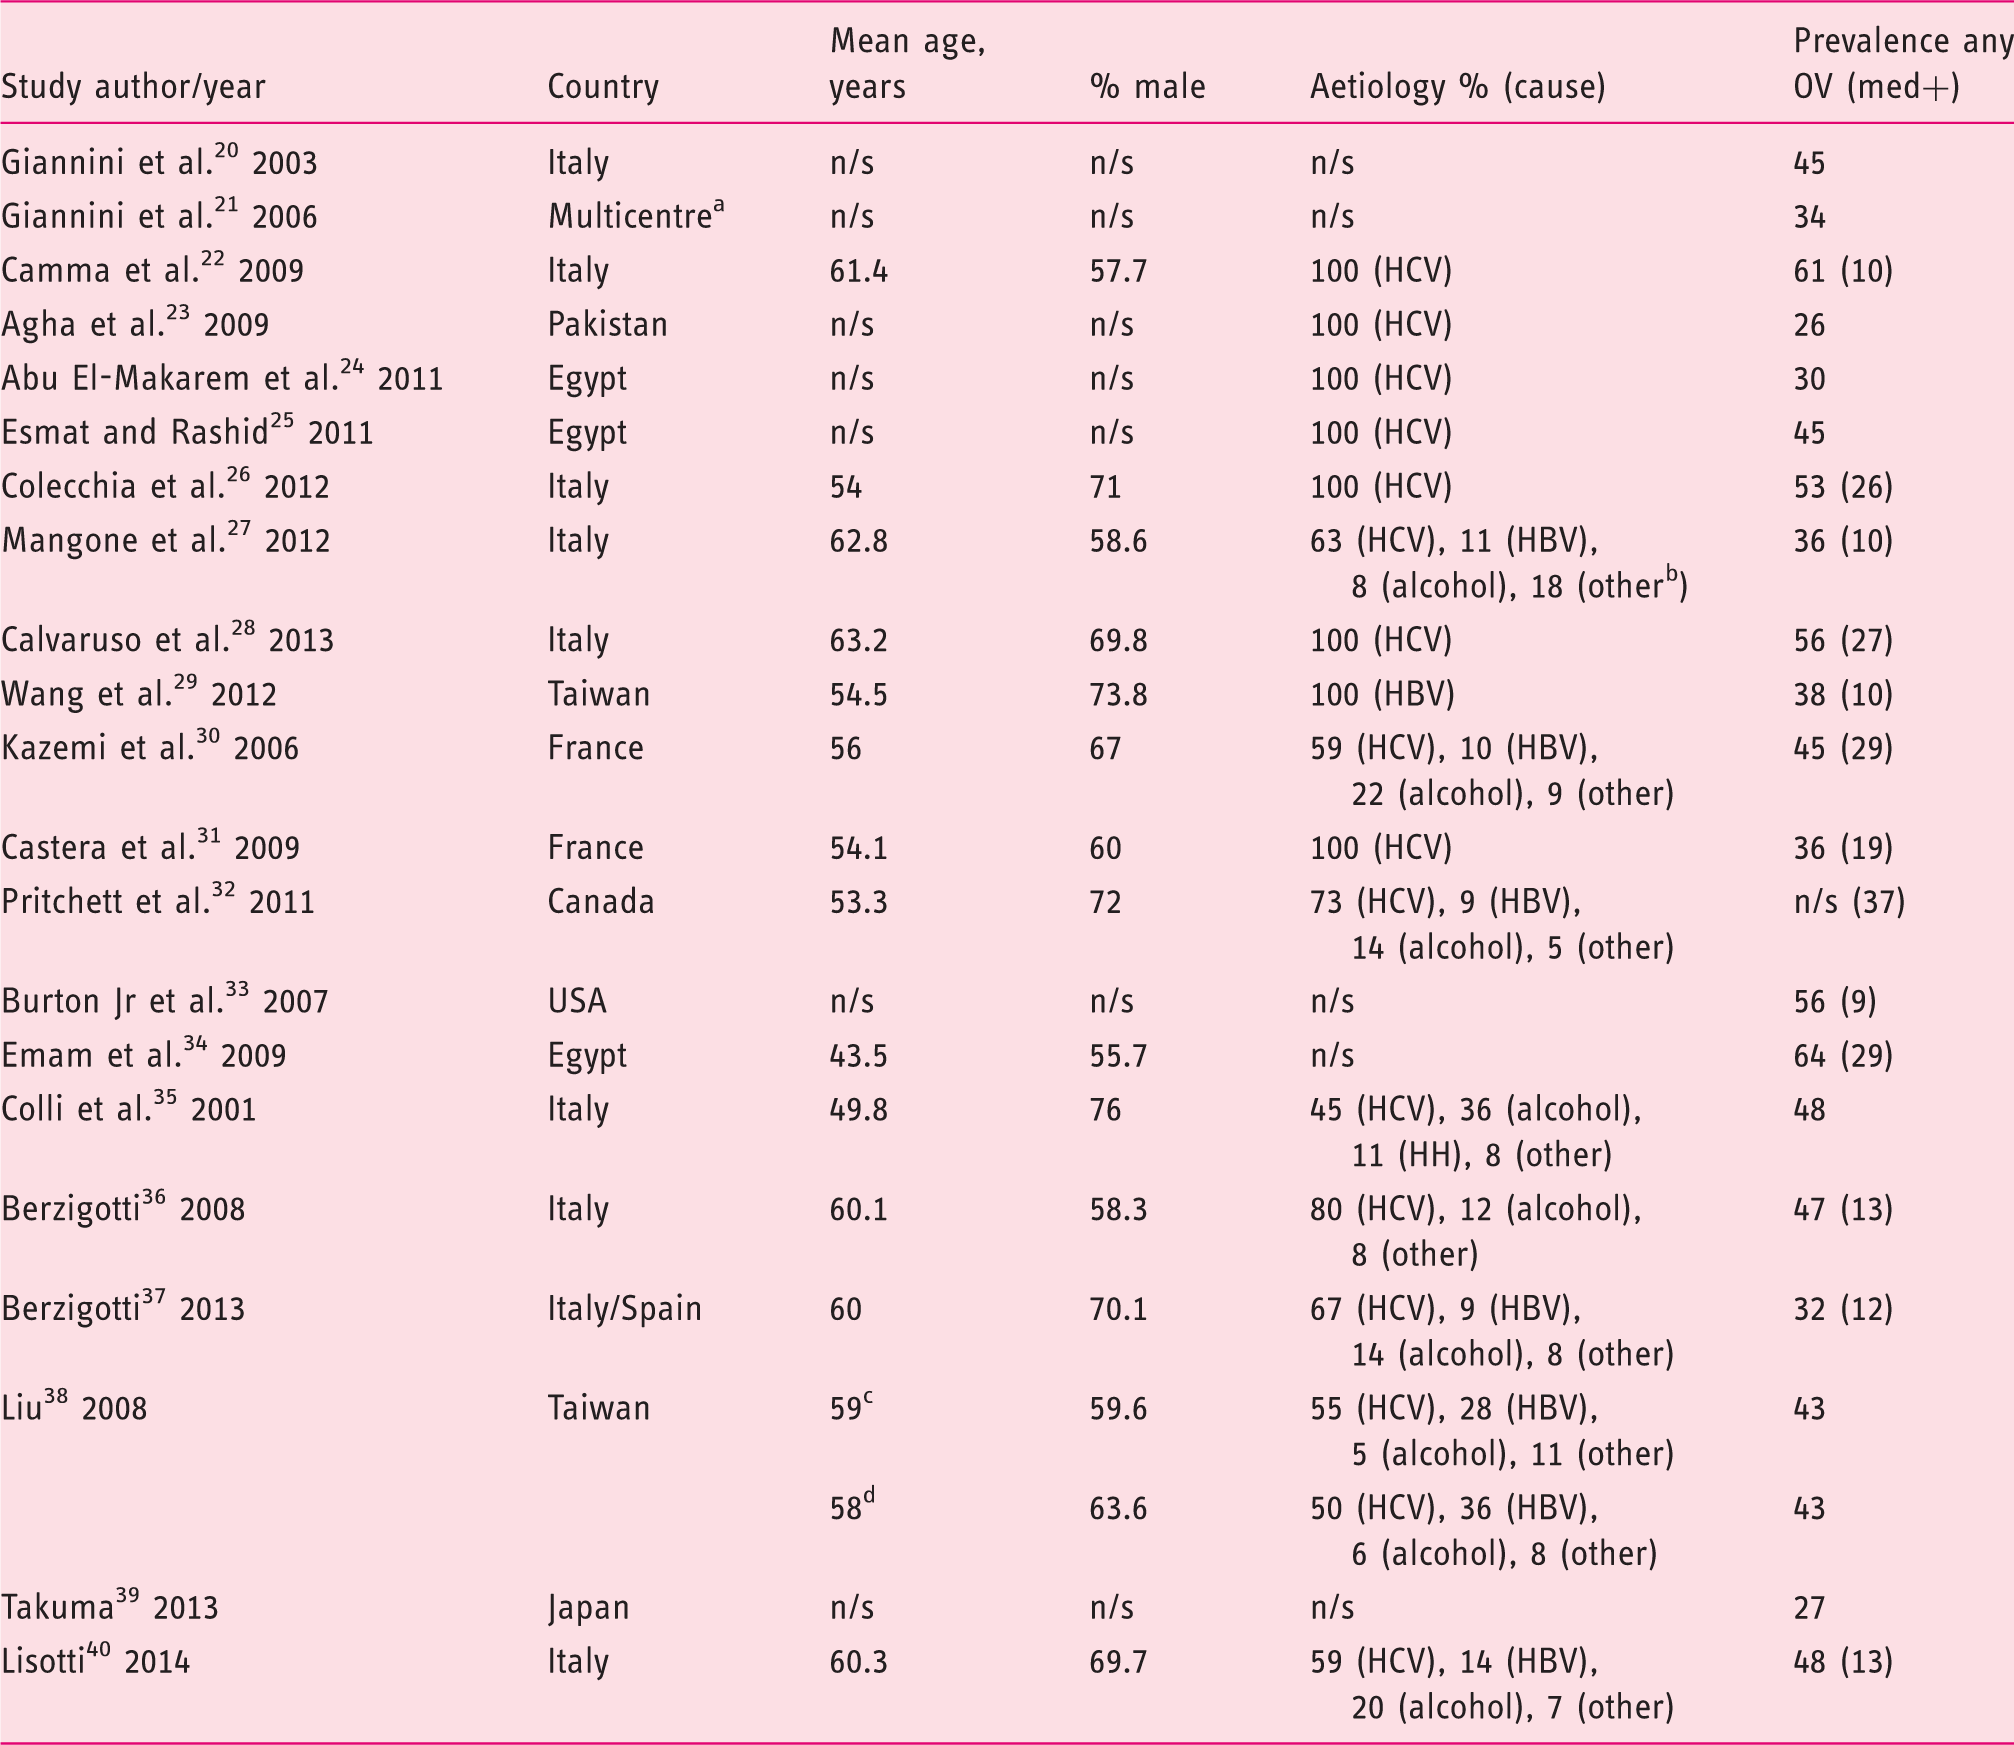
Flow diagram of the search strategy and selection of studies eligible for data analysis. OGD: oesophagogastroduodenoscopy. Characteristics of included studies (n = 21). Homeostasis model assessment-insulin resistance = fasting insulin (µU/mL) × fasting glucose (mmol/L)/22.5); AST to platelet ratio index = (AST/upper limit of normal)/platelets × 100; Fibrotest = 4.467 × log [α2-macroglobulin (g/L)] − 1.357 × log [haptoglobin (g/L)] + 1.017 × log [γ-glutamyl transpeptidase (IU/L)] + 0.0281 × (age (in years)) + 1.737 × log [bilirubin (µmol/L)] − 1.184 × [apolipoprotein A1 (g/L)] + 0.301 × sex (female = 0, male = 1) − 5.540; Prothrombin index = (Prothrombin time control plasma/prothrombin time patient plasma) × 100. Lok index: log odds = − 5.56 − 0.0089 × platelets (103/mm3) + 1.26 × (AST/ALT) + 5.27 × INR. OV risk score = − 4.364 + 0.538 × spleen diameter − 0.049 × platelet count − 0.044 × LS + 0.001 × (LS × platelet count). ALT: alanine aminotransferase; APRI: AST to platelet ratio index; ARFI: acoustic radiation force impulse; AST: aspartate aminotransferase; HOMA-IR: homeostasis model assessment-Insulin resistance; ICG-r15: indocyanine green 15-minute retention; LS: liver stiffness; LSM: liver stiffness measurement; LSPS ratio: liver stiffness measurement × spleen diameter/platelet count; Med+: medium/large as defined by classification system used in each study; No. of pts: number of patients included in the 2 × 2 table; OV: oesophageal varices; PSR: platelet count/spleen diameter ratio; Se, sensitivity (%); Sp: specificity (%); SSM: spleen stiffness measurement; U/S: ultrasound international normalised ratio. Italy, Austria and USA. Fibroscan using a modified software version with a range between 1.5 and 150 kPa. Included grade I with high-risk stigmata for bleeding or any grade II or III OV. Medium or grade II varices were classified as small in this study. Renal resistive index. Portal congestive index. Training cohort, data for validation cohort not extractable. Training cohort. Validation cohort. All cohort. Spleno-portal index. Baseline characteristics of patients included in the systematic review and meta-analysis. HBV: hepatitis B virus; HCV: hepatitis C virus; med+: medium/large; n/s: not stated; OV: oesophageal varices. Italy, Austria and USA. Other includes non-alcoholic fatty liver disease, mixed viral and alcohol, cryptogenic and hereditary haemochromatosis. Training cohort. Validation cohort.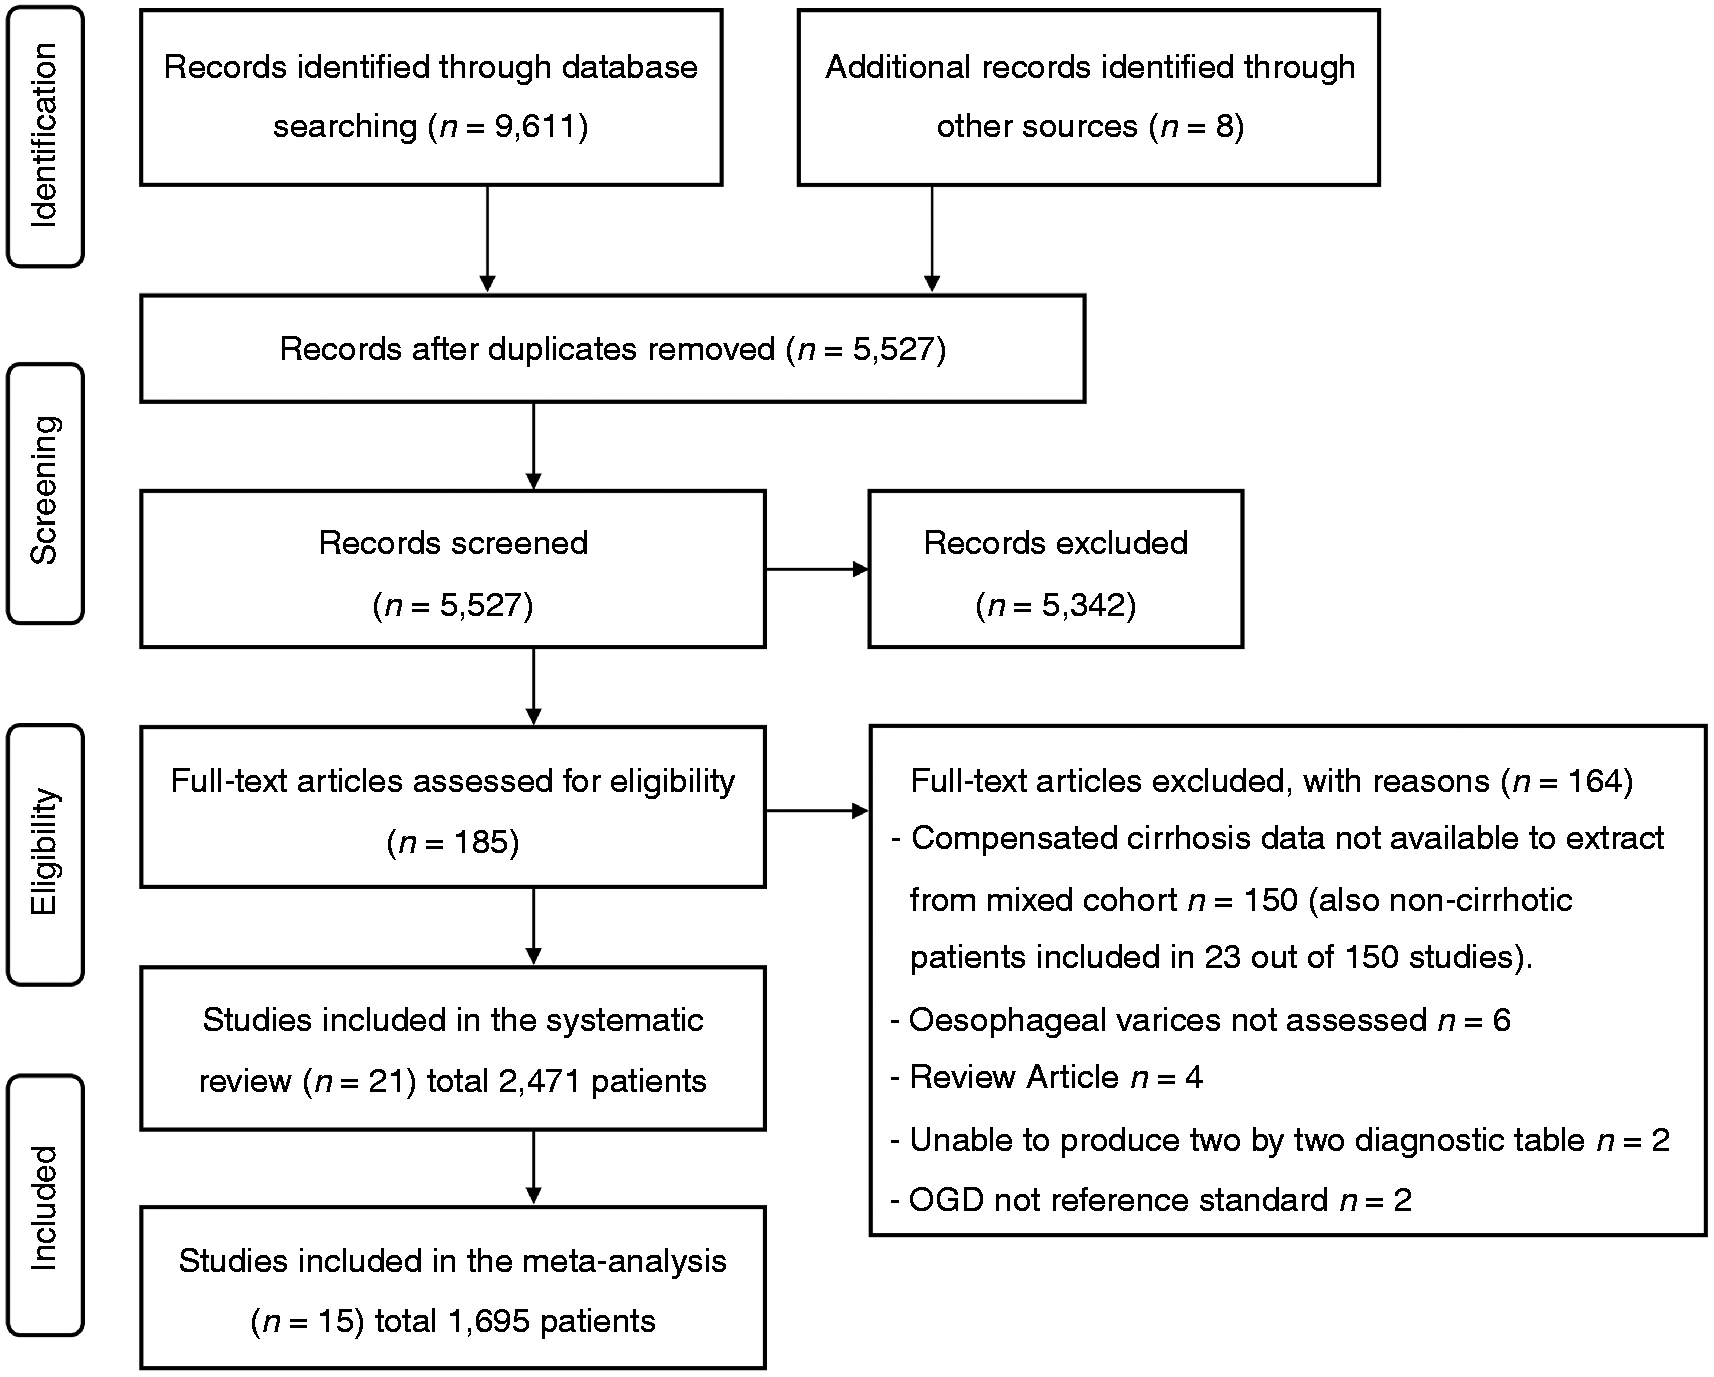
Diagnostic tests identified
Platelet count/spleen diameter ratio
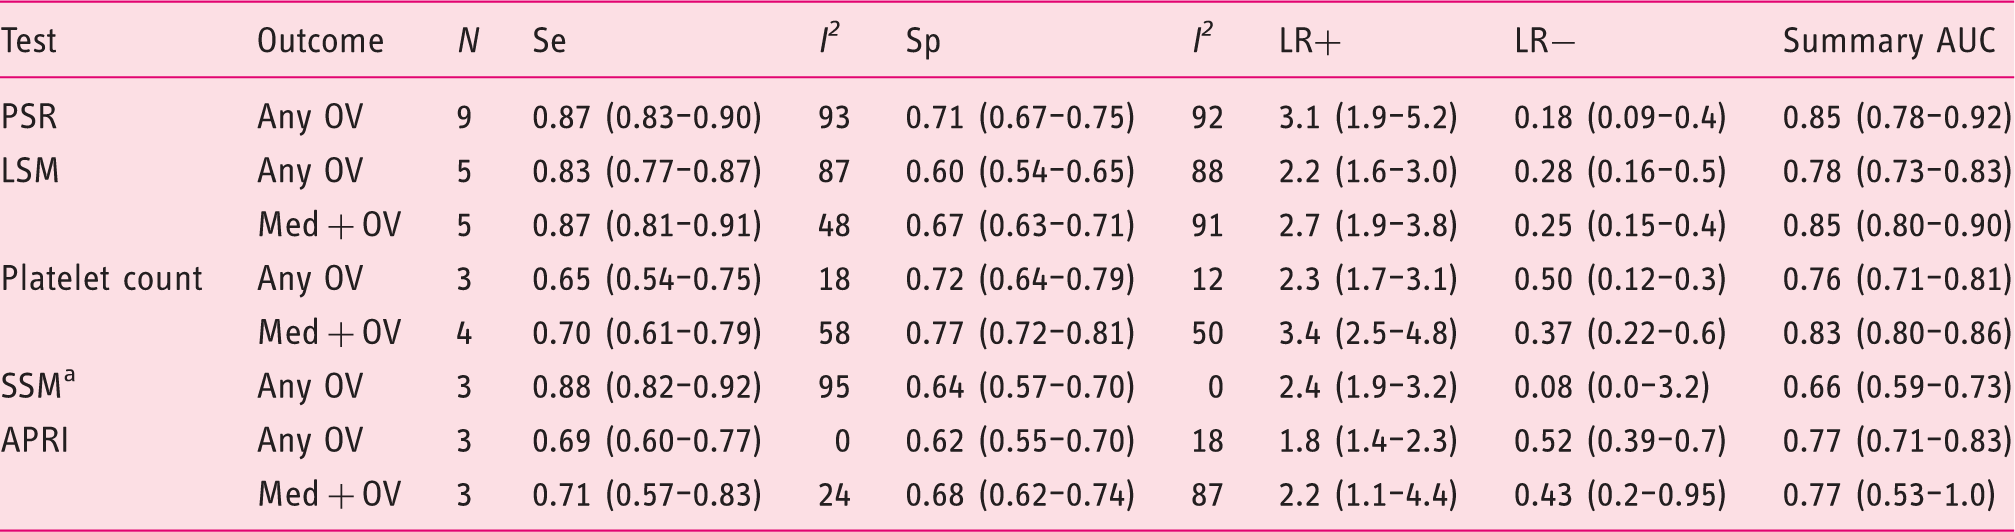
Nine studies (n = 823 patients)20–28 evaluated platelet count/spleen diameter ration (PSR) for the diagnosis of any size OV in patients with compensated cirrhosis. The pooled sensitivity and specificity were 0.87 (95% CI 0.83–0.90) and 0.71 (95% CI 0.67–0.75), respectively (Figure 2 and Table 3). The summary AUC was 0.85 (95% CI 0.78–0.92) (supplementary Figure 1). Only one study evaluated the accuracy of PSR for the detection of medium/large OV.
28
There was evidence of significant heterogeneity between studies, and subgroup analyses (supplementary Table 3) identified study location as the only significant source of heterogeneity (DOR: western = 8.8 (95% CI 3.8–20.0) versus non-western = 255.9 (95% CI 33.4–1962.4); p = 0.0130). No evidence of significant publication bias was detected (p = 0.88).
Forest plots of studies evaluating the sensitivity (top) and specificity (bottom) of platelet count/spleen diameter ratio for the diagnosis of any size oesophageal varices in patients with compensated cirrhosis. * indicates studies using 909 cut-off. CI: confidence interval; df: degrees of freedom. Random effects meta-analysis results of studies reporting the diagnostic accuracy of currently available markers for the detection of oesophageal varices in patients with compensated cirrhosis. Data presented as values (95% confidence interval). I2 presented as percentage. N, number of studies. AUC: area under the curve; APRI: aspartate aminotransferase (AST) to platelet ratio index; LR+: positive likelihood ratio; LR−: negative likelihood ratio; LSM: liver stiffness measurement; med+: medium/large; OV: oesophageal varices; PSR: platelet count/spleen diameter ratio; Se: sensitivity; Sp: specificity; SSM: spleen stiffness measurement. One of the three studies used acoustic radiation force impulse technique for SSM.39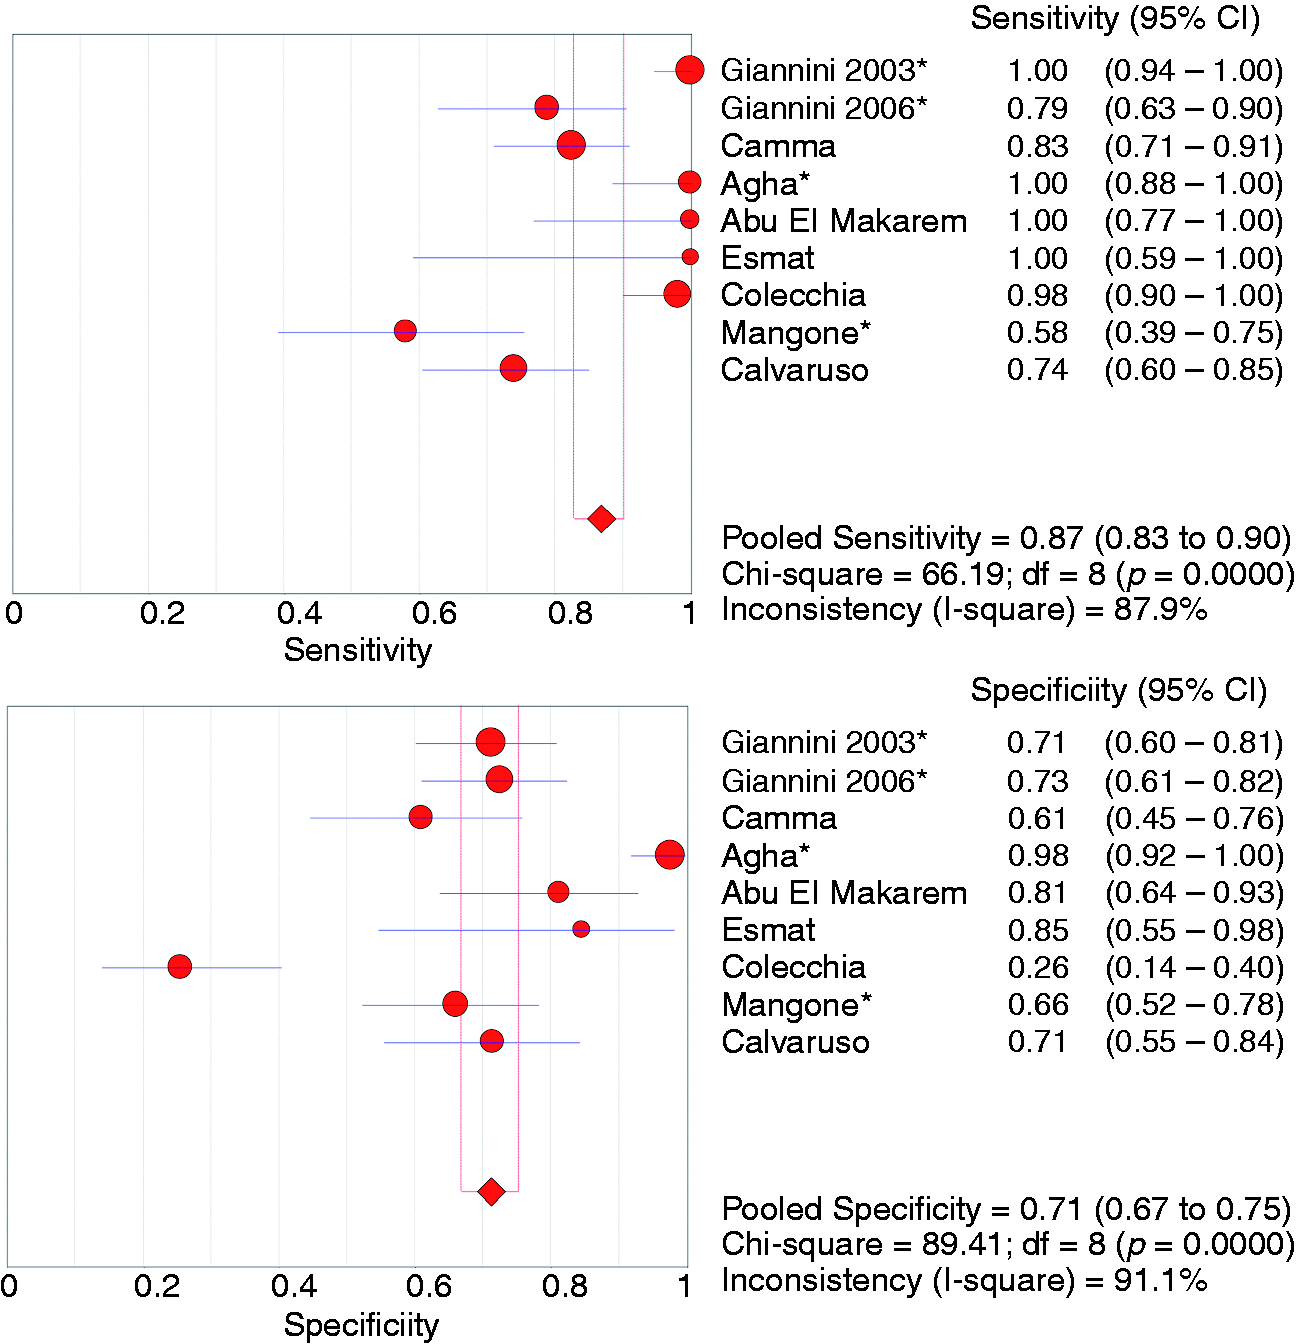
Liver stiffness measurement
Five studies (n = 553 patients) evaluated the accuracy of liver stiffness measurement (LSM) by transient elastography (Fibroscan®, Echosens, Paris, France) for the diagnosis of any size OV.26,28–31 Variable cut-offs were used (16.4, 17, 12, 13.9 and 21.5 kPa) (Table 1). The pooled sensitivity and specificity were 0.83 (95% CI 0.77–0.87) and 0.60 (95% CI 0.54–0.65), respectively (Figure 3). The summary AUC was 0.78 (95% CI 0.73–0.83) (supplementary Figure 2). Five studies (n = 664 patients) reported the accuracy of LSM for the diagnosis of medium/large OV (Table 3).28–32
Forest plots of studies evaluating the sensitivity (top) and specificity (bottom) of liver stiffness measurement by transient elastography for the diagnosis of any size oesophageal varices in patients with compensated cirrhosis. CI: confidence interval; df: degrees of freedom.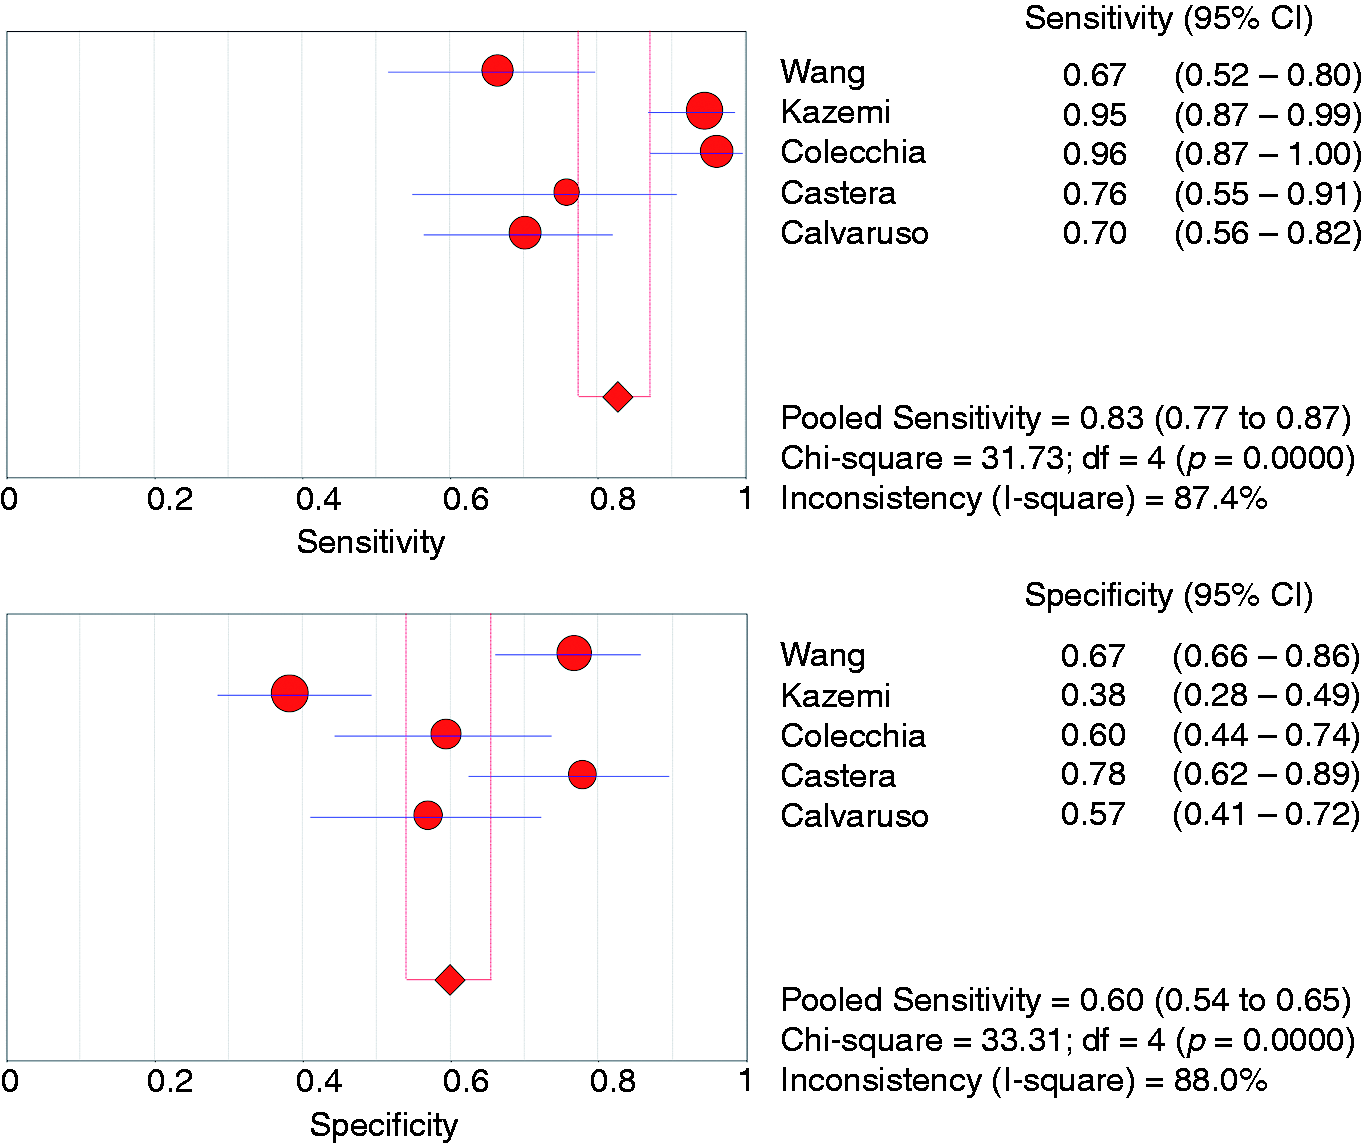
Platelet count
Three studies (n = 216 patients) evaluated the accuracy of platelets count for the diagnosis of any size OV.25,29,31 Cut-offs analysed were 117, 140 and 221 ×103/µL (Table 1). The pooled sensitivity, specificity and summary AUC were 0.65 (95% CI 0.54–0.75), 0.72 (95% CI 0.64–0.79) and 0.76 (95% CI 0.71–0.81), respectively. Four studies (n = 481 patients) evaluated the accuracy of platelets count for the diagnosis of medium/large OV (Table 3).29,31–33
Spleen stiffness measurement
Three studies assessed the accuracy of spleen stiffness measurement (SSM) for the detection of any OV (n = 422 patients).26,28,39 The pooled sensitivity, specificity and summary AUC were 0.88 (95% CI 0.82–0.92), 0.64 (95% CI 0.57–0.70) and 0.66 (95% CI 0.59–0.73), respectively (Table 3). In the study by Takuma et al.,39 the acoustic radiation force impulse technique was used for SSM, while the other two studies used the Fibroscan.26,28 Two of the three studies above also reported data on accuracy for medium/large OV (Table 1).28,39
Aspartate aminotransferase to platelet ratio index
The aspartate aminotransferase to platelet ration index (APRI) test was evaluated in three studies with regards to the detection of any OV as well as medium/large OV (n = 292 patients).28,29,31 The pooled sensitivity, specificity and summary AUC for the diagnosis of any OV were 0.69 (95% CI 0.60–0.77), 0.62 (95% CI 0.55–0.70) and 0.77 (95% CI 0.71–0.83), respectively (threshold effect, –<0.001). Data for medium/large OV are shown in Table 3 (threshold effect, p < 0.001).
Other tests
Several other non-invasive tests have been evaluated with variable results (Table 1).
Clinical applicability model
PSR was the only non-invasive marker that had multiple validation studies at a consistent threshold (four studies used the 909 cut-off)20,21,23,27 (supplementary Table 3), hence included in the model. At the 909 cut-off, the pooled sensitivity, specificity, LR+ and LR− for the diagnosis of any size OV were 0.87 (95% CI 0.81–0.92), 0.78 (95% CI 0.73–0.83), 4.0 (95% CI 1.9–7.8) and 0.16 (95% CI 0.02–0.71), respectively (supplementary Table 3). These values were applied to five different hypothetical cohorts with prevalence rates for any size OV at 10, 20, 30, 40 and 50%. The proportions of correctly saved endoscopies (true negative) were 70, 62, 55, 47 and 39%, respectively, while the proportions of incorrectly saved endoscopies (false negative) in those five cohorts were 1, 2.5, 4, 5 and 6%, respectively (Figure 4). Results of all Fagan’s plots are shown in supplementary Figure 3.
Bar chart representation of the proportion of endoscopies saved in a cohort of patients with compensated cirrhosis undergoing pre-screening test with platelet count/spleen diameter ratio at a cut-off of 909.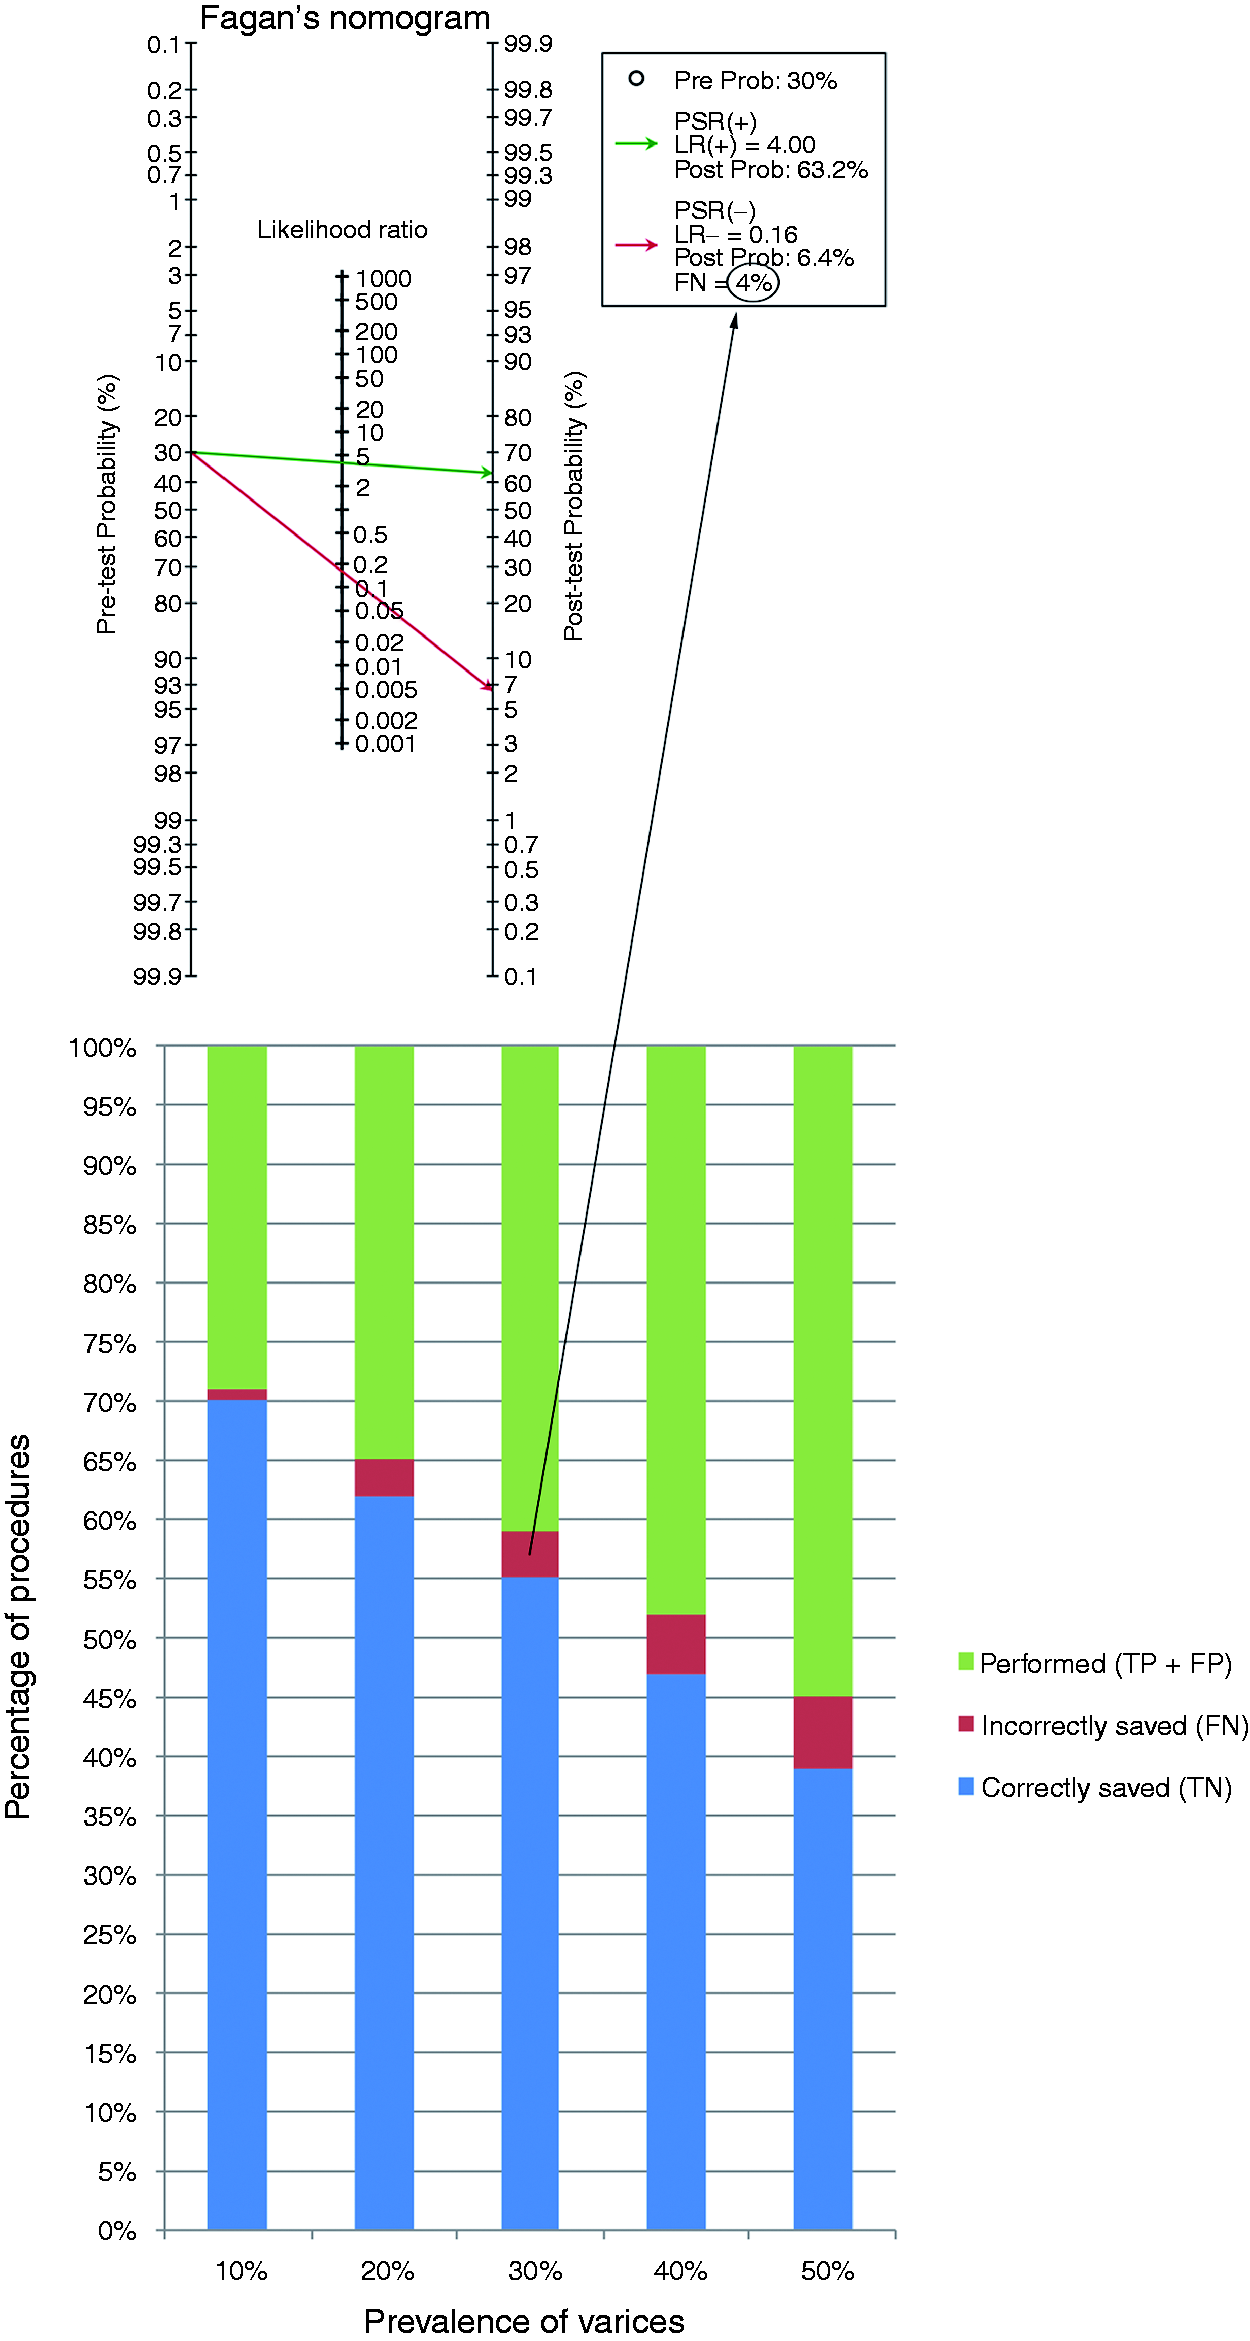
Discussion
Principal findings
This is the first comprehensive systematic review (including 2471 patients) and meta-analysis (including 1695 patients) of all non-invasive diagnostic tests for the detection of OV in patients with compensated cirrhosis using the same methodology. The vast majority of studies were published within the last decade, which highlights the recent and ongoing search for alternative pathways to improve the effectiveness of screening in this low-risk group with cirrhosis. Focusing on tests included in the meta-analysis, PSR was the most frequently evaluated with nine studies in total,20–28 followed by LSM (five studies),26,28–31 platelet count (five studies),25,29,31–33 SSM (three studies)26,28,39 and APRI (three studies).28,29,31 For the diagnosis of any size OV across all cut-offs, PSR had the highest summary AUC compared to other tests (0.85; 95% CI 0.78–0.92), while the accuracy of LSM was higher than platelet count and APRI for the detection of medium/large OV (summary AUC 0.85; 95% CI 0.80–0.90) (Table 3).
Pooled data on the performance of the aforementioned tests represent a global summary of test accuracy based on current literature. However, these values have limited inference and cannot be adopted into clinical practice due to the variation in cut-offs used for each test. We tested PSR at the single 909 threshold, validated by multiple studies, within a clinical applicability model. We demonstrated that a significant proportion of OGDs could be saved ranging from 39–70% dependent on the prevalence of OV with a respective range of 50–10%. This provides encouraging evidence that existing non-invasive markers could be adopted into clinical practice. Our data suggest that the benefits of PSR become less evident in the context of high prevalence of OV (50% or higher), which is more likely to occur in decompensated cirrhosis. 3
Study strengths and limitations
This systematic review and meta-analysis had several strengths. We only evaluated patients with compensated cirrhosis as defined by the Baveno IV criteria.41 It is now recognized that the development of diagnostic tests and prognostic models should be specific to each clinical status (compensated versus decompensated), because treatment aims and outcomes are different in those two groups of patients.41 Some studies reported data on patients with compensated cirrhosis as a subgroup within the main article. In order not to miss such studies, our search strategy was designed to be inclusive of all patients with cirrhosis regardless of their compensation status; therefore, we reviewed a large number (n = 185) of manuscripts in full to identify the eligible 21 studies that were included in this review. Moreover, we evaluated all currently available tests in the literature and obtained pooled data for some of the tests using the same methodology, hence, this enables direct comparisons between the tests’ global accuracy to be made rather than relying on indirect comparisons from individual meta-analyses that use different methodologies and inclusion/exclusion criteria. Finally, we presented a tangible outcome measure using a clinical applicability model to estimate the potential reduction in unnecessary screening endoscopies by adopting a non-invasive marker into the OV testing algorithm.
There are also several limitations that need to be considered when interpreting the results. As with most diagnostic accuracy meta-analyses, 11 we observed high heterogeneity across studies evaluating PSR, LSM and SSM. In case of PSR, this could be explained based on the location where the study was performed, but in case of other markers, subgroup analyses were not performed due to the small number of studies available. There may be several possible explanations for heterogeneity including study-, patient- or test-related factors (supplementary Table 2). Variation in diagnostic thresholds used for the same test could be an important source of heterogeneity. We accounted for this in our analysis and found no evidence of a significant threshold effect in cases of PSR, LSM and SSM studies (p-value > 0.05 for all analyses), but not in cases of platelet count and APRI studies (p < 0.001). This may raise doubts regarding the validity of pooling data from studies evaluating the latter two tests, hence these results should be interpreted with caution. Operator bias and inter-/intra-observer agreement on the diagnosis of OV are also important factors to consider, hence our primary outcome was presence of any OV (present versus absent) rather than medium/large OV, in order to minimize bias introduced by variability in classification systems used across different studies to define the size of OV.
Implications for clinical practice and areas for future research
Findings from this study have several important implications for clinical practice. We identified the currently available non-invasive markers for the detection of OV and obtained global estimates of their accuracy. Pooled data from this systematic review should be used in health economic modelling studies to evaluate the cost-effectiveness of different markers in screening for OV.
PSR was found to be the most accurate marker and its potential is enhanced by the fact that its components are readily available in clinical practice as part of standard care (i.e. platelet count and ultrasound). A criticism of PSR is the subjectivity in measurement of spleen bipolar diameter, but studies have shown the latter to be a reliable parameter with excellent reproducibility as measured by both kappa statistic and intra-class correlation coefficient.42,43
LSM by transient elastography was the second most accurate diagnostic test in this study and has validated diagnostic accuracy for the detection of cirrhosis across mixed aetiologies.44 Therefore, the advantage is that one test could be used to diagnose cirrhosis and also stratify for OV; however, the precise thresholds for diagnosing OV are yet to be defined.8,44 As highlighted by this systematic review, the range of thresholds ranged from 13.9–21.5 kPa. Transient elastography requires trained operators and has a small but significant failure rate in 3–5% of patients.45,46 Stiffness-based methods have a various proportion of non-valid results, and therefore the actual outcome of the studies that use these methods should incorporate non-valid measurements among the failures of the test.
We demonstrate that adopting PSR at the 909 cut-off into clinical practice can result in a significant (≥55%) saving of unnecessary OGDs in populations with ≤ 30% prevalence for OV. This will reduce the cost of screening and focus efforts on the remaining patients who require an OGD (PSR-test positive) by, for instance, allocating them to more specialist lists operated by endoscopists with expertise in diagnosis and management. The major clinical consequence of misdiagnosis is to fail to detect OV that could bleed in the future. The false negative percentage in compensated cirrhosis was in the range of 1–6% (Figure 4), and it is important to note that not all of these would require prophylaxis with either band ligation or pharmacological therapy in the context of early compensated cirrhosis (i.e. primary prophylaxis is currently recommended for medium/large OV in this cohort). 1 In contrast, the percentage of false negative tests will rise in decompensated cirrhosis (as illustrated by the relationship between the incorrectly saved OGDs and prevalence of OV in Figure 4), and the consequences of missing OV will be more significant as mortality and morbidity are higher in this cohort. 9 This gives further credence to the concept of stratifying compensated versus decompensated cirrhosis before applying a diagnostic test for OV.
Conclusions
Several non-invasive markers have been evaluated to screen for OV in patients with compensated cirrhosis. PSR appears to be the most accurate in detecting any size OV compared to other tests. It is also the most frequently studied test with promising clinical applicability. Based on current estimates, initial screening with PSR at a cut-off of 909 can result in correctly saving unnecessary endoscopies in a significant proportion of patients. This benefit is highest and the risk of missing OV is lowest with lower prevalence rates for the target condition in the tested population. Prospective validation studies, including randomized controlled trials, are needed to confirm these findings and assess the impact of these diagnostic interventions on robust end-points such as the number of variceal bleeds or deaths prevented by using one testing strategy compared to another.
Supplemental Material
Supplemental material for Non-invasive tests for the detection of oesophageal varices in compensated cirrhosis: systematic review and meta-analysis
Supplemental material for Non-invasive tests for the detection of oesophageal varices in compensated cirrhosis: systematic review and meta-analysis by Sarmed S. Sami, David Harman, Krish Ragunath, Dankmar Böhning, Julie Parkes and Indra Neil Guha in United European Gastroenterology Journal
Footnotes
Acknowledgements
None.
Declaration of conflicting interests
The authors declared no potential conflicts of interest with respect to the research, authorship and/or publication of this article.
Funding
S. S. Sami is funded by an Olympus-Core National Endoscopy Research Fellowship grant, Core charity, United Kingdom. No other source of funding was required for this study.
Ethics approval
Ethical approval was not required for this study
Informed consent
Informed consent was not required for this study.
References
Supplementary Material
Please find the following supplemental material available below.
For Open Access articles published under a Creative Commons License, all supplemental material carries the same license as the article it is associated with.
For non-Open Access articles published, all supplemental material carries a non-exclusive license, and permission requests for re-use of supplemental material or any part of supplemental material shall be sent directly to the copyright owner as specified in the copyright notice associated with the article.