
Abstract
Objective
We sought to evaluate the association between constipation severity, productivity losses and healthcare utilization in a national sample of Italian patients with chronic non-organic constipation (CC)
Methods
We enrolled 878 outpatients with CC. Clinical and demographic data were collected by physicians during clinical examinations. Patients completed a self-administered questionnaire (Patient Assessment of Constipation-Symptoms, PAC-SYM; Work Productivity and Activity Impairment; healthcare utilization, and Symptoms Checklist 90 Revised – Somatization Scale, SCL-90 R).
Results
Mean PAC-SYM score was 1.62 ± 0.69. Mean weekly sick time due to constipation was 2.7 ± 8.6 h and productivity losses due to presenteeism was 19.7% ± 22.3%. Adjusted productivity losses in patients with severe CC (PAC-SYM score 2.3–4.0) compared to patients with mild symptoms (PAC-SYM score 0.0–1.0) was Italian Purchase Power Parity US$ 6160. Constipation severity (PAC-SYM quintiles) was associated with higher healthcare utilization (RRPAC-SYM 4/01.84; p-value for linear trend <0.01). After adjustment for somatization scores, the association of constipation severity with productivity losses and healthcare utilization rates was attenuated yet statistically significant.
Conclusions
We observed a graded increase in productivity losses and healthcare utilization with increasing constipation severity. Further studies should evaluate whether significant savings might be achieved with regimens aimed at reducing the constipation severity.
Keywords
Introduction
Chronic non-organic constipation (CC) is a common medical condition occurring in 9–15% of the population 1 –4 but only a small fraction of patients reach third-level care, often after years of unsatisfactory self-medication attempts and medical consultations as well. 1,5 –7 CC presents with difficult infrequent defecation and sensation of incomplete evacuation which are persistent and sometimes resistant to treatment. Health-related quality of life (HRQoL) is negatively affected in people with CC 8 and the degree of symptom severity is associated with worse HRQoL. 9 There is evidence that CC affects patients’ productivity and healthcare utilization which translates into elevated direct and indirect costs. 10
Cost estimates from previous studies, while providing valuable information on the overall burden of the disease, may lead to unrealistic expectations about savings from therapy since published figures rely on population-based comparisons between constipated and nonconstipated patients. 8,10 Moreover, current management options allow to alleviate symptoms to a certain degree and a complete remission of the disease is not frequently observed. Hence, characterizing the relationship between disease severity and costs of illness would inform an accurate healthcare decision making. Additionally, it is still not clear whether the burden of CC is independent from possible confounders such as comorbidities, socio-demographic, life style and psychological factors.
The aim of the present study was to evaluate the association between constipation severity, productivity losses, and healthcare utilization in patients with CC.
Methods
Study sample and design
The Laxative Inadequate Relief Survey (LIRS) initiative aimed at evaluating the quality of life, treatment satisfaction, activity impairment, and healthcare utilization of patients with CC. Thirty-nine Italian referral centres for gastrointestinal disorders (Appendix A, available online) joined the LIRS group. We enrolled 878 consecutive outpatients from September to December 2011.
Patients referred for constipation-related complains to the centres were screened for eligibility by a gastroenterologist during a regular outpatient clinical examination. We included patients with CC defined according to the Rome III criteria as the occurrence for the previous 3 months with symptom onset at least 6 months prior to diagnosis of at least two of the following symptoms for at least 25% of defecations: lumpy/hard stools, incomplete evacuation, obstruction, manual manoeuvers, strain, and <3 defecations/week. In line with recent studies revealing a continuum between patients with functional constipation and irritable bowel syndrome with constipation, abdominal pain was not a criterion of exclusion from the enrolment in the study.
11
We defined irritable bowel syndrome (IBS)-like pain as the presence of pain for at least 3 days per month in the past 3 months with either one of the following associated features: relief of pain, discomfort with a bowel movement, abdominal pain, discomfort associated with either a change in the number of bowel movements, and consistency of stools. The same gastroenterologist recorded relevant clinical and demographic information in a standard data collection form after patients consented to be included in the study. The clinical data collection form was matched with a self-administered questionnaire completed by each patient. The questionnaire packet included:
Patient Assessment of Constipation-Symptoms (PAC-SYM),
12
a 12-item questionnaire assessing the presence and magnitude of constipation-related symptoms. Ratings occur along a 5-point likert scale (0 = absent; 4 = very severe) Patient Assessment of Constipation-Quality of Life (PAC-QoL),
13
a 28-item quality of life questionnaire assessing constipation-related impairment in social, physical, and psychological dimensions of quality of life RAND SF-12,
14
a 12-item questionnaire assessing patients’ perception of their own mental and physical health Symptom Check List-90 R (SCL-90 R) Somatization Scale,
15
a 12-item scale assessing patient’s propensity to amplify the intensity and significance of bodily sensations Treatment Satisfaction Questionnaire for Medication (TSQM-v2),
16
an 11-item questionnaire assessing patients’ satisfaction for the efficacy, safety, and convenience of use of their medication regimen Work Productivity Activity Impairment Questionnaire for Chronic Constipation (WPAI-CC),
17
consisting of five items: (Q1) hours lost due to constipation-related health problems; (Q2) hours lost due to any other reason; (Q3) hours actually worked; (Q4) degree that constipation-related health problems affected productivity while at work; and (Q5) degree that constipation-related health problems affected daily activities (excluding work). It allows estimating of the following metrics expressed as percentage productivity losses, with higher values indicating a greater proportion of time lost at work (less productivity) or activities: absenteeism: [Q1/(Q1 + Q3)]*100 (equation 1) presenteeism: Q4*10 (equation 2) overall work productivity loss: [Q1/(Q1 + Q3)] + [(1 − Q1/(Q1 + Q3))*(Q4/10)]*100 (equation 3) activity impairment: Q5*10(equation 4) selected items from the Health and Work Survey
18
(as will be detailed) perceived job strain and items tapping socio-demographic and occupational factors.
Definition of comparison groups
The severity of constipation was assessed with the PAC-SYM questionnaire. 12,19 Patients’ ratings occur over a 5-point Likert scale ranging from 0 (absence of symptom) to 4 (very severe). Quintiles of PAC-SYM distribution in the study sample defined five severity groups. We contrasted outcomes across severity groups. Patients classified in the mildest PAC-SYM quintile were considered the reference group for the analysis.
Outcomes
Productivity losses
Only employed respondents were prompted to fill in the WPAI-CC questionnaire. Percentage productivity losses were converted to the corresponding share of the Italian Purchase Power Parity (PPP) per capita Gross Domestic Product (2010 US$ 31,090) 20 which allows cross-national comparisons. PPP represents the real exchange rate (nominal exchange rate adjusted for the price index): i.e. how much money would be needed to purchase the same goods and services in two different countries.
Healthcare utilization
We asked patients to report the number of healthcare encounters occurred in the 12 months prior to interview for the following service categories:
a doctor, hospital, or clinic for a routine physical check up or gynaecological examination (not counting pregnancy-related care) a dentist or optician for a routine check up or examination a doctor, emergency room, or clinic for urgent treatment(e.g. because of new symptoms, an accident, or something else unexpected) a doctor, hospital, clinic, orthodontist, or ophthalmologist for scheduled treatment or surgery a psychiatrist, psychologist, or other mental health professional overnight hospital stays (number of nights).
Covariates
For socio-demographic characteristics, we recorded education, marital status, sex, and age. For the medical factors past and current constipation management regimens, body mass index, and times since symptoms onset; we calculated five comorbidity indexes representing the number of symptom-based somatic diagnoses, biomarker-based somatic diagnoses, gastrointestinal diagnosis, psychiatric disorders, 21 and overall comorbidity index. For life style, we recorded smoke, alcohol, and fluid intake and physical activity (frequency of moderate physical activity in the past week). For psycho-social factors, patients reporting a SCL-90 R Somatization Scale (SCL-90 R SOM) t-score ≥63 were considered somatizers. The cut-off value identifies patients at higher risk of clinically relevant disorders. 15 Sleep quality and work-related strain/tension were both assessed with visual analogue scales.
Analysis
We included employed patients in the analysis of work productivity losses (n = 370); the whole sample was used to evaluate healthcare utilization. We adopted Poisson regression with robust standard errors (Sandwich Estimator) 22 for the association between constipation severity, sick leave, and healthcare utilization rates, ordinary least squares for presenteeism, and gamma regression (log link) for overall productivity loss.
For each outcome, we fitted three consecutive models. We entered the independent variable of interest first (PAC-SYM quintiles). In the second step, we included age, sex, marital status, education, time since first diagnosis, physical activity, smoking habit, water consumption, comorbidities, body mass index, sleep quality, and occupational strain. Even if the PAC-SYM questionnaire includes few items concerning abdominal pain or discomfort, it does not allow identifying patients with an IBS-like pain pattern. Hence, we included a dummy variable indicating the presence of IBS-like abdominal pain. Since there is no clear evidence on whether somatization either confounds or it is part of the causal pathway linking constipation severity to outcomes, we added somatization (SCL-90RSOM ≥63 vs. SCL-90RSOM <63) to the third specification. Finally, we repeated the analysis after excluding patients with medical conditions possibly associated to secondary constipation (diabetes, anal fissures, previous history of abdominal surgery, clinical depression, chronic kidney disease, Alzheimer’s disease or dementia, Parkinson’s disease, multiple sclerosis, paraplegia or hemiparesis, diverticulosis, rectal prolapse; n = 223). p < 0.05 was considered statistically significant. We fitted all models with PROC GENMOD in SAS version 9.2.
Results
Study sample
Sample socio-demographic and clinical characteristics by constipation severity quintiles
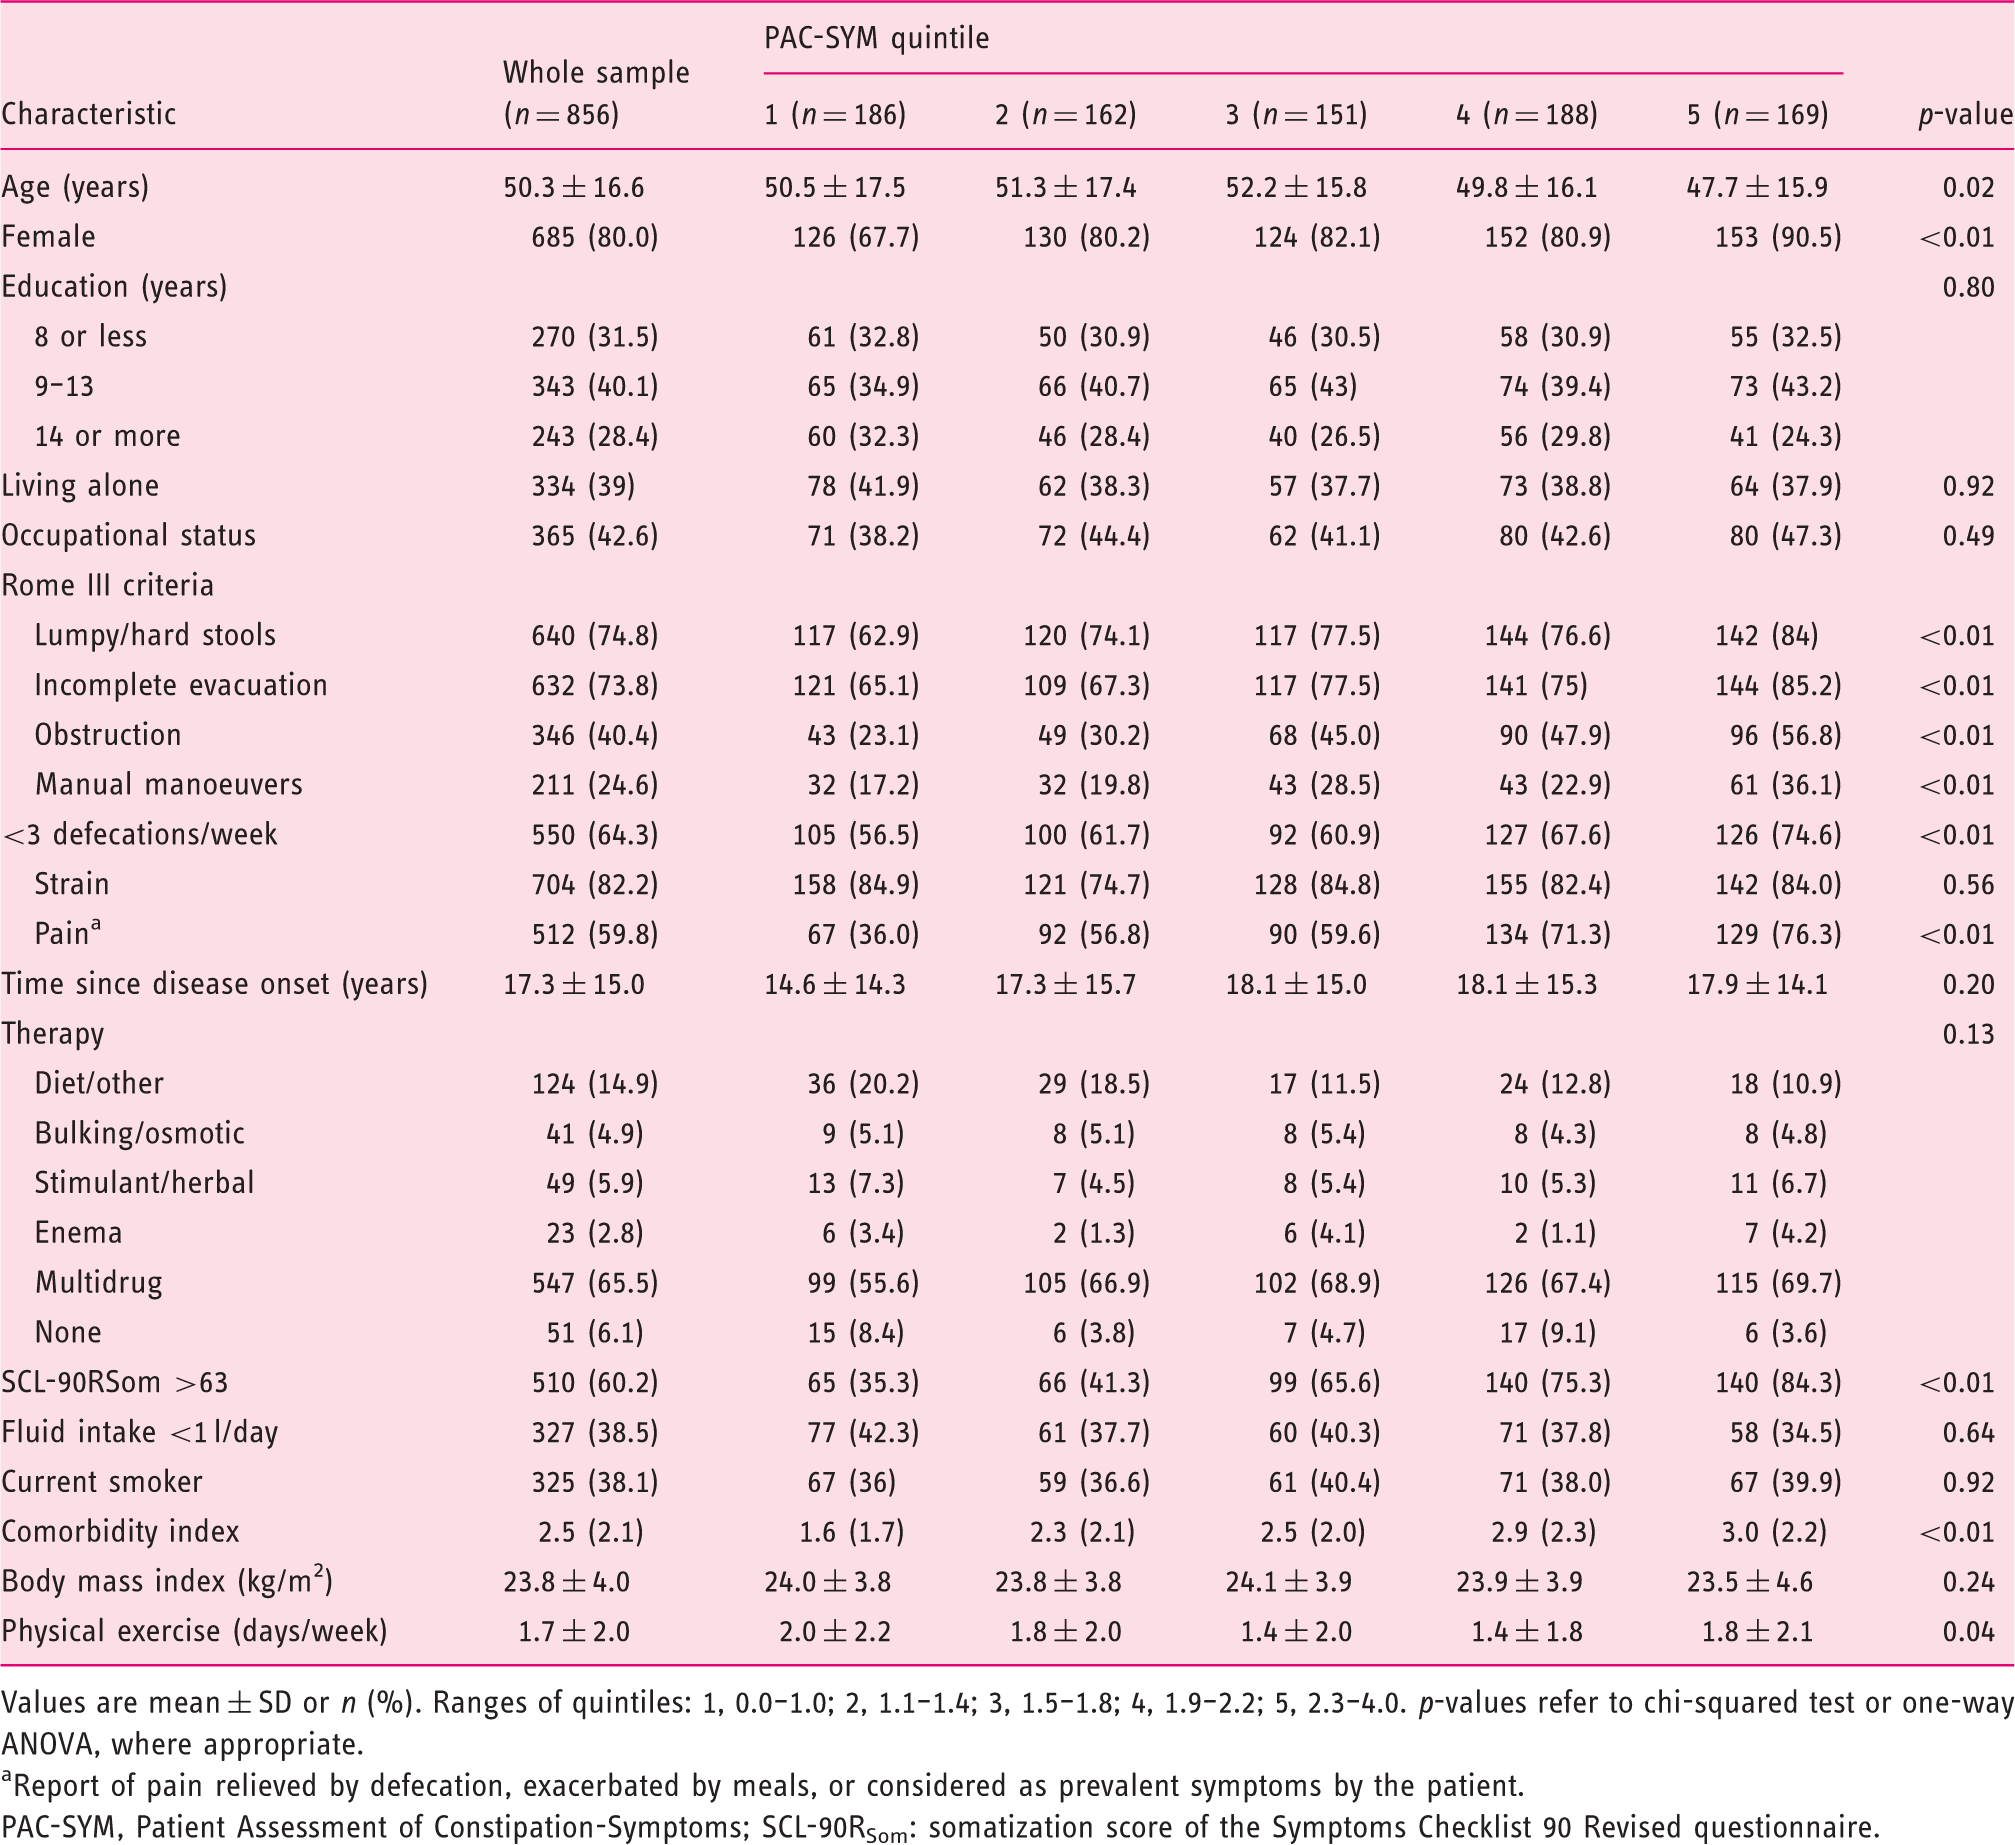
Values are mean ± SD or n (%). Ranges of quintiles: 1, 0.0–1.0; 2, 1.1–1.4; 3, 1.5–1.8; 4, 1.9–2.2; 5, 2.3–4.0. p-values refer to chi-squared test or one-way ANOVA, where appropriate.
Report of pain relieved by defecation, exacerbated by meals, or considered as prevalent symptoms by the patient.
PAC-SYM, Patient Assessment of Constipation-Symptoms; SCL-90RSom: somatization score of the Symptoms Checklist 90 Revised questionnaire.
Work and activity impairment
The employment-to-population ratio was 52%. Employed patients were younger (p = 0.02), attained higher education (p < 0.01), had less comorbid conditions (p < 0.01) and lower body mass index (p < 0.01) and less likely reported the use of multiple therapeutic approaches to manage their constipation (p < 0.01). Hand labourers represented 17% (n = 62) of employed patients and only 8% (n = 27) reported to have physically demanding job tasks. The majority of employed patients reported to carry out a mentally demanding job (50%).
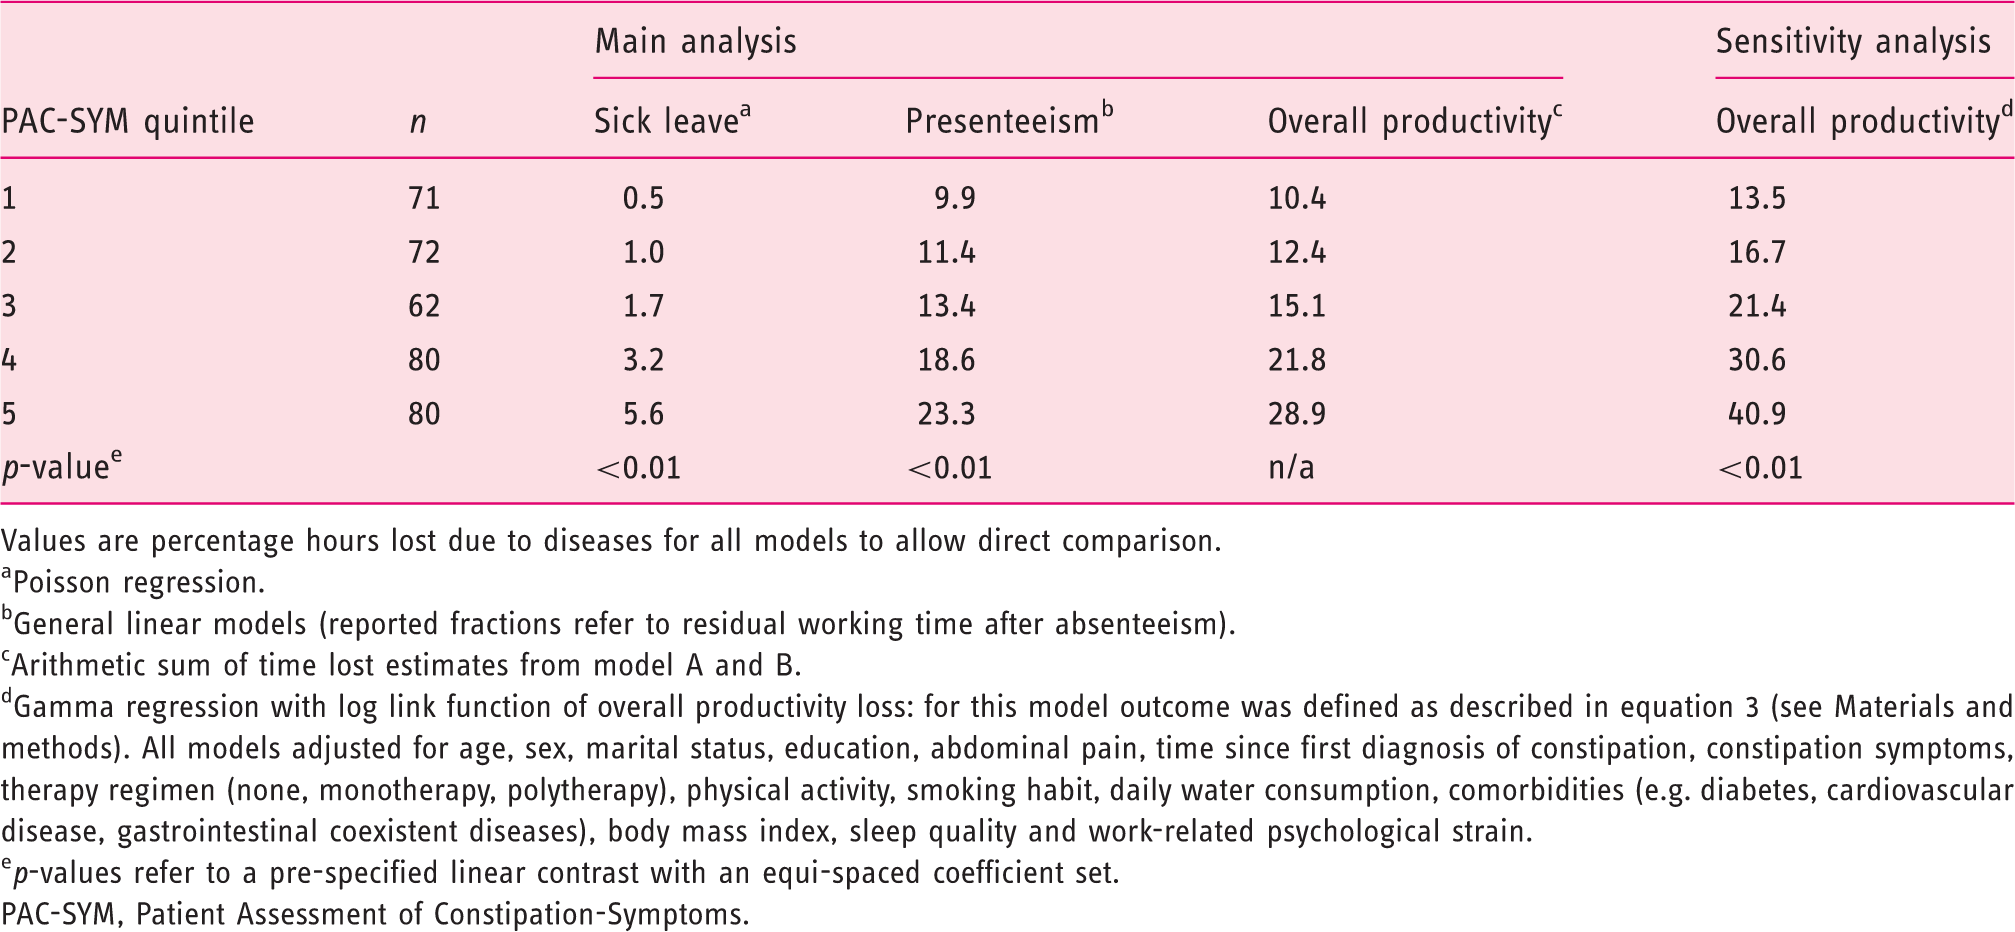
Weekly sick time due to constipation was 2.7 ± 8.6 and work impairment was 24.0 ± 26.6%. The overall productivity loss (absenteeism + presenteeism) amounted to 24.7%. Sick leave rate ranged from 2.2 to 12.7% in patients with mild (lowest PAC-SYM quintile) and severe (higher PAC-SYM quintile) constipation, respectively. Unadjusted productivity losses due to sick leave and presenteeism were both associated with CC severity (PAC-SYM quintiles, Figure 1; p for linear trend <0.01 for both outcomes). This association was robust to adjustment for several possible confounders (Table 2; p for linear trend <0.01 for sick leave and presenteeism). After adjustment, the productivity loss due to sick leaves associated to severe constipation (PAC-SYM quintile 5, score 2.3–4.0) compared to mild constipation (PAC-SYM quintile 1, score: 0.0–1.0) was ΔQ5–Q1 = 5.1% or 12.0 days/year (considering an average of 236 working days yearly and an average working time of 8 h daily) (p for linear trend <0.01). Similarly, percentage work impairment due to presenteeism associated to severe constipation (PAC-SYM quintile 5, score: 2.3–4.0) compared to mild constipation (PAC-SYM quintile 1, score: 0.0–1.0) was ΔQ5–Q1 = 14.7%. Overall adjusted productivity losses in patients with severe CC (PAC-SYM score 2.3–4.0) compared to patients with mild symptoms (PAC-SYM score 0.0–1.0) was ΔQ5–Q1 = PPP US$ 6160 (p for linear trend <0.01 for both outcomes). After adjusting for somatization scores, overall losses associated to CC severity decreased to ΔQ5–Q1 = PPP US$ 5140 but remained statistically significant (p for linear trend <0.01 for both outcomes). In the gamma regression analysis, we observed a graded statistically significant association between PAC-SYM quintiles and overall productivity loss (estimates in Table 2, p for linear trend <0.01). Finally, the association between constipation severity and all occupational outcomes did not appreciably change after excluding patients with medical conditions possibly associated with secondary constipation (data not shown).
Constipation severity and productivity loss: unadjusted estimates of sick leave and presenteeism costs. Sensitivity analysis: model specifications and relationship between constipation severity quintiles and productivity loss Values are percentage hours lost due to diseases for all models to allow direct comparison. Poisson regression. General linear models (reported fractions refer to residual working time after absenteeism). Arithmetic sum of time lost estimates from model A and B. Gamma regression with log link function of overall productivity loss: for this model outcome was defined as described in equation 3 (see Materials and methods). All models adjusted for age, sex, marital status, education, abdominal pain, time since first diagnosis of constipation, constipation symptoms, therapy regimen (none, monotherapy, polytherapy), physical activity, smoking habit, daily water consumption, comorbidities (e.g. diabetes, cardiovascular disease, gastrointestinal coexistent diseases), body mass index, sleep quality and work-related psychological strain.
p-values refer to a pre-specified linear contrast with an equi-spaced coefficient set. PAC-SYM, Patient Assessment of Constipation-Symptoms.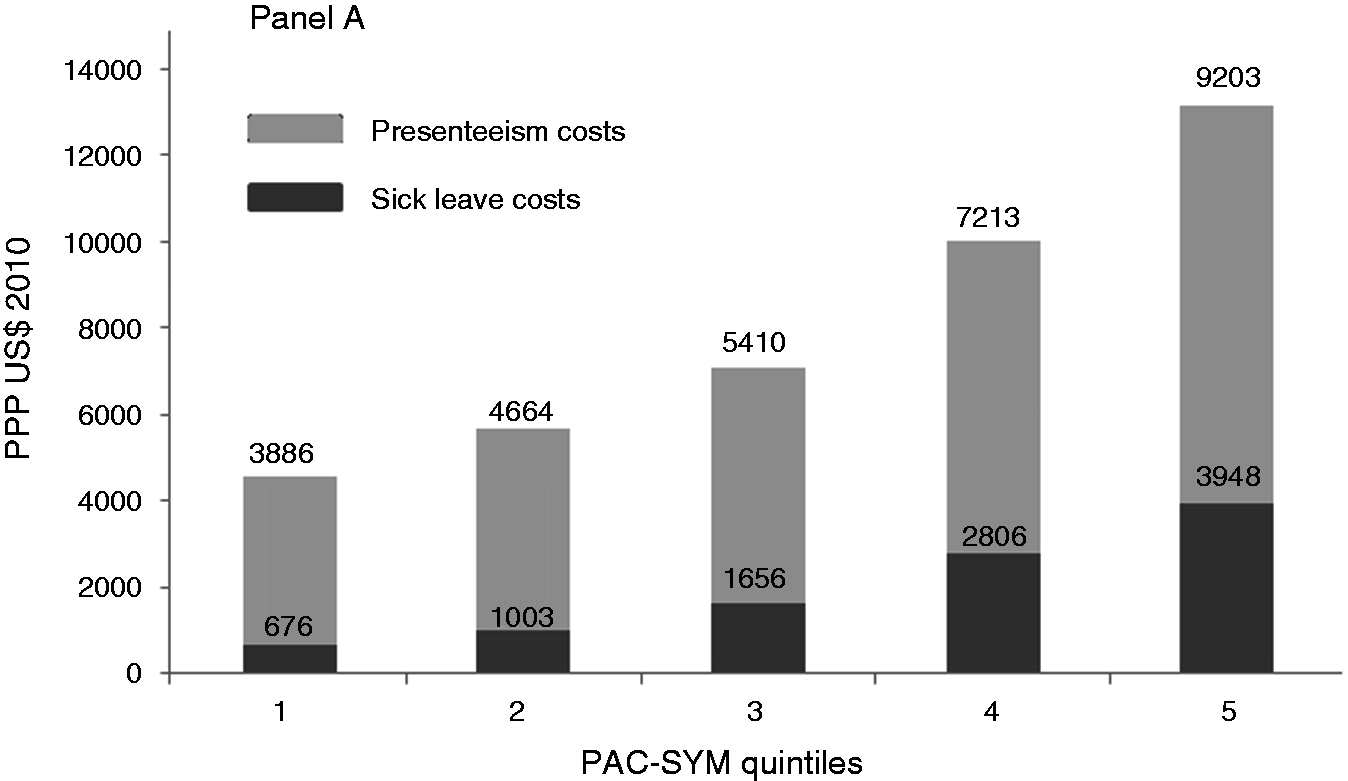
Healthcare utilization
Patients reported 4.90 (95% CI 4.75–5.05) outpatient diagnostic visits, 0.56 (95% CI 0.51–0.62) emergency room or urgent healthcare medical encounters, 0.36 (95% CI 0.33–0.41) elective surgeries or medical therapies, and 0.76 (95% CI 0.70–0.82) psychological consultations on average in the 12 months prior to the interview. Approximately 76% of patients had at least one outpatient diagnostic encounter, 60% received a diagnostic check up from an optician or a dentist, 26% sought urgent health care, 18% underwent elective surgery or medical treatment, and 10% received counselling or psychotherapy services. Overall healthcare utilization rate was 8.38 encounters/year (95% CI 8.18–8.57). About 14% of patients was hospitalized for at least one night in the year preceding the survey (mean 1.27, 95% CI 1.19–1.34).
Constipation severity (PAC-SYM quintiles) was associated with higher overall healthcare utilization (RRPAC-SYM 4/0 = 1.84; p for linear trend <0.01); since this association was mainly driven by outpatient diagnostic services utilization (RRPAC-SYM 4/0 = 1.82; p for linear trend <0.01) and emergency room access and urgent healthcare services (RRPAC-SYM 4/0 = 2.05; p for linear trend 0.02) (Figure 2) we limited further analyses to these two outcomes. The associations had a J-shaped pattern and were robust to adjustment for possible confounders (Table 3). There was no association between hospital nights and constipation severity (data not shown).
Crude healthcare utilization and constipation severity. Relative risk of healthcare utilization by constipation severity quintile Values are risk ratio (95% CI). Healthcare use risk was modelled with Poisson regression with robust standard error estimates. Model 1 is adjusted for age, sex, marital status, education, abdominal pain, time since first diagnosis of constipation, constipation symptoms, therapy regimen (none, monotherapy, polytherapy), physical activity, smoking habit, daily water consumption, comorbidities (e.g. diabetes, cardiovascular disease, gastrointestinal coexistent diseases), body mass index, and sleep quality. Model 2 includes all variables entered in model 1 plus somatization score of the Symptoms Checklist 90 Revised questionnaire. PAC-SYM, Patient Assessment of Constipation-Symptoms.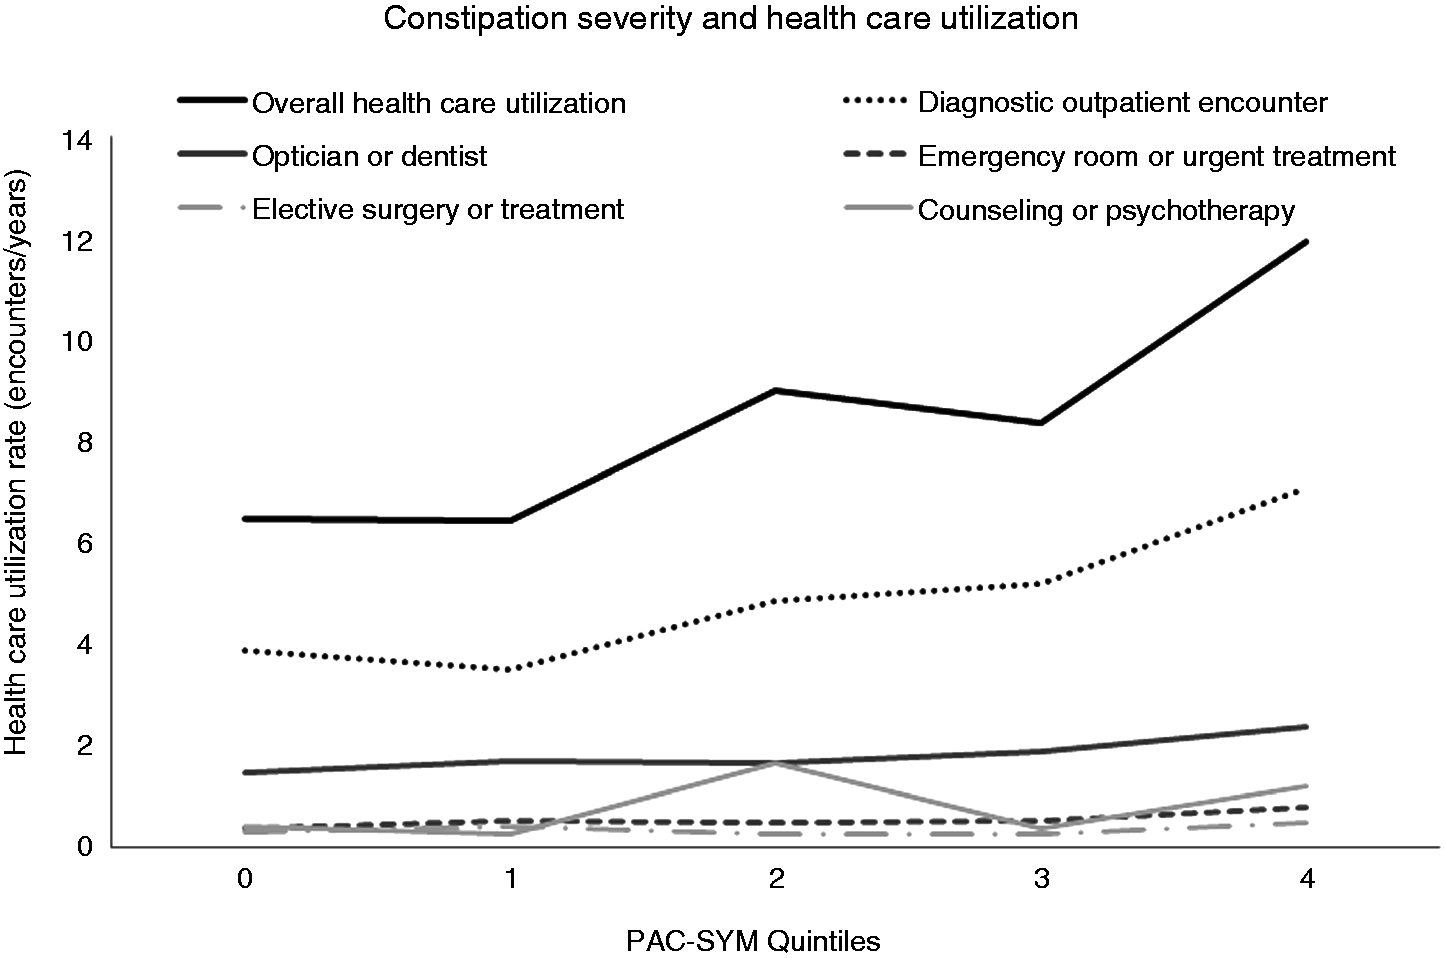
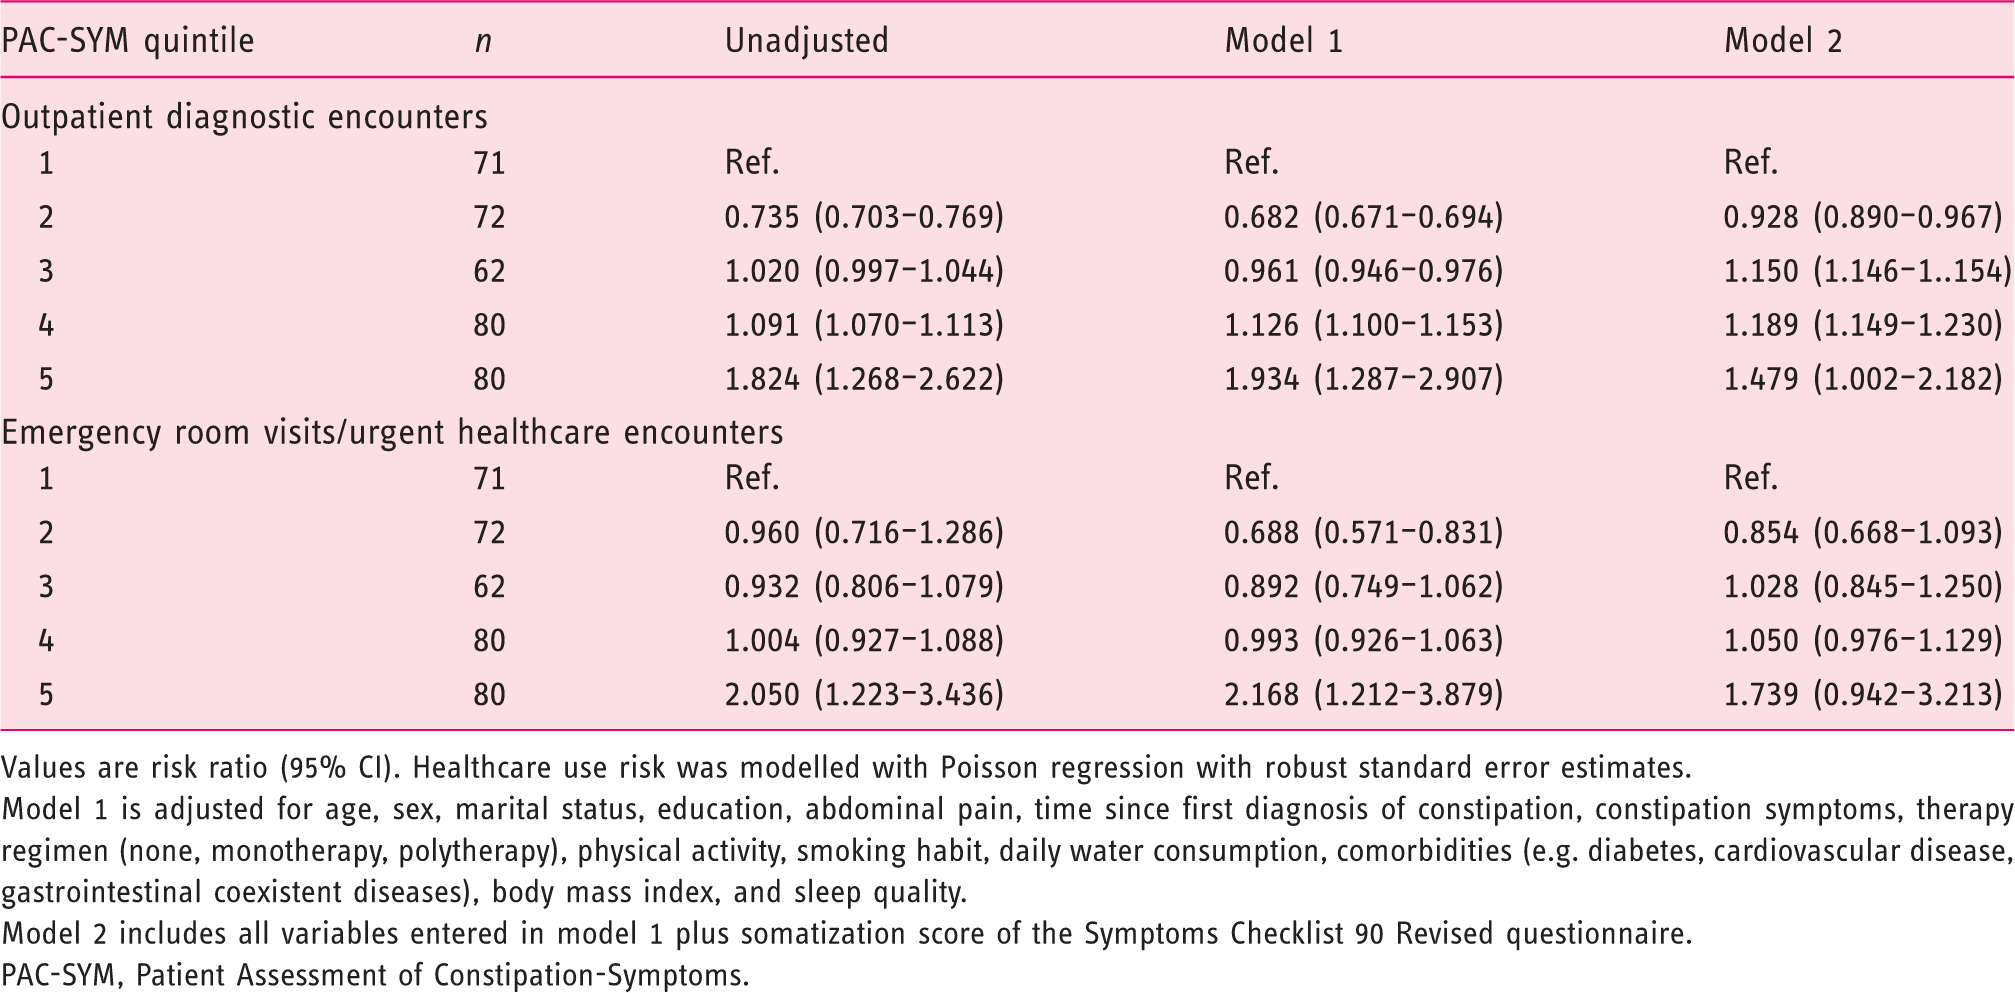
After excluding patients with medical condition possibly associated with secondary constipation, the association between constipation severity and outpatient diagnostic services utilization remained statistically significant (unadjusted RRPAC-SYM 4/0 = 1.87, p for linear trend <0.01; adjusted RRPAC-SYM 4/0 = 1.36, p for linear trend = 0.03). However the association between constipation severity and urgent healthcare services utilization lost statistical significance (unadjusted RRPAC-SYM 4/0 = 1.82, p for linear trend = 0.07; adjusted RRPAC-SYM 4/0 = 1.27, p for linear trend = 0.23)
Discussion
We observed a graded association between productivity loss, healthcare utilization rates, and constipation severity scores. Our sample included a mix of patients with functional constipation and irritable bowel syndrome with constipation since IBS-like pain was not a criterion of exclusion. Hence, we were able to show that this association was independent of IBS-like abdominal pain and robust to adjustment for socio-demographic, medical, life-style, and occupational factors and was only partially attenuated by including a measure of somatization in the statistical model.
Consistent with previous findings
8,10
we found that CC is associated with a heavy toll on patients’ productivity. Patients included in our study were referred to a tertiary-level centre and our findings may not be generalizable to all constipated patients. It should be noted, however, that the average PAC-SYM score in our sample was as low as that reported in the PAC-SYM validation study, a research which recruited patients from the general population by advertisement.
12
Additionally, even patients suffering from very mild constipation (PAC-SYM quintile 1: score <1) reported a sick leave rate higher than that observed by Bank of Italy’s Survey of Household Income and Wealth (SHIW) in a representative sample of the Italian general population (LIRS PAC-SYMlowest quintile 2.2% vs. SHIW 1.9%).
23
Of note, productivity losses reported by patients classified in the highest PAC-SYM quintiles were similar to those reported for severe conditions such as ankylosing spondylitis and major depression, while patients suffering from mild symptoms (lowest PAC-SYM quintiles, Figure 3) reported 16% losses, similar to obesity, diabetes, and gastroesophageal reflux disease.
24
–34
The discrepancies observed across studies may be partially explained by case mix imbalances and country-specific employment protection law peculiarities.
23
Unadjusted percentage productivity losses from sickness absenteeism and presenteeism (Work Productivity and Activity Impairment) in the LIRS study by PAC-SYM quintiles and published reports on several chronic conditions.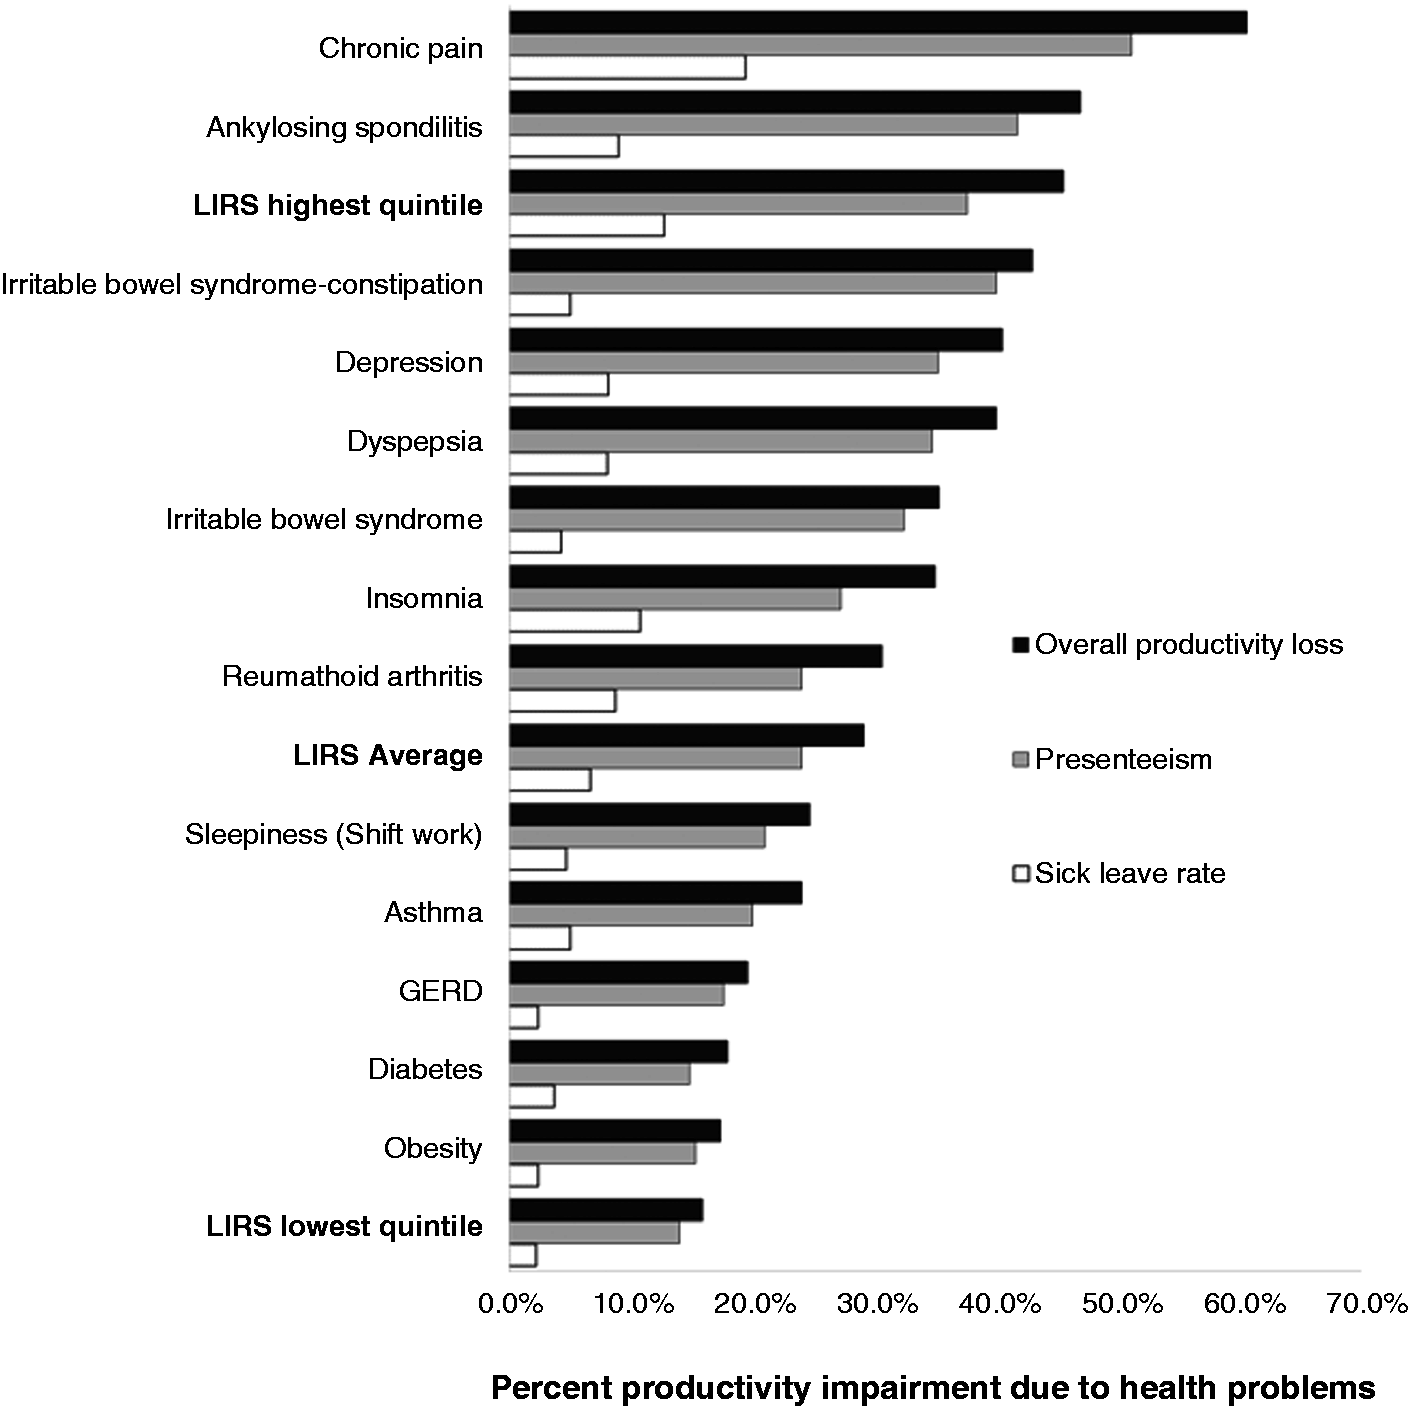
Recent advancements in constipation therapy promise to effectively reduce symptoms burden in patients resistant to laxatives and life-style adjustments. 35 Our results suggest that the potential impact factor of therapy on overall yearly productivity may range from PPP US$ 641 to PPP US$ 2437 per patient for each PAC-SYM quintile decrease in constipation severity, a realistic expectation for symptoms improvement according to randomized controlled trial results, 19,36 even after discounting patients’ somatization propensity. However, none of the currently available therapeutic approaches are disease modifying or curative, and long-term efficacy and tolerability has not been evaluated yet for all available medications. Even though our study cannot prove causality of association, our findings help compare competing hypothetical scenarios to prioritize research investments. Whether these projected cost savings could be achieved is a matter of further research.
Additionally, our study demonstrated that patients with severe constipation have had significantly greater resource use than those with mild symptoms and that this association was independent from IBS-like pain and robust to adjustment for possible cost drivers in health care. Previous studies have shown that patients with constipation seek health care more frequently. 8 As expected, outpatient diagnostic medical encounters drove the association observed but emergency room visits were also significantly increased in patients in the highest PAC-SYM quintiles. The lack of a dose–response relationship between constipation severity and medical encounter rates suggests that healthcare-seeking behaviour may be triggered only when symptoms are felt as exceedingly bothersome. We observed increasingly high comorbidity rates in patients with more severe constipation symptoms, which partially contributed to resource use. This relationship was mostly driven by increasing number of gastrointestinal and symptom-based diagnoses rather than biomarker-based diagnosis with increasing constipation severity. We have also found that both constipation severity and all comorbidity indexes were strongly associated with somatization scores. Consistent with previous findings, 21 our results suggest that comorbidity in patients with CC may be partially a consequence of the propensity to amplify the intensity and significance of bodily sensations, which in turn may be associated with greater healthcare-seeking behaviour. 37 –39 Since these patients are sometimes resistant to treatment and often unsatisfied by medical care, evaluating these aspects in clinical practice may be crucial to help tailor management strategies and set realistic expectations from treatment.
The present study extends current CC literature in several ways. This is the first study evaluating the association between constipation severity and economic outcomes, thus providing more realistic cost-savings expectations compared to existing cost-of-illness studies. Second, our large sample and comprehensive data collection combining clinical data recorded by gastroenterologists and patients’ self-reported information, allowed us to adjust for several potential confounders, including the presence of IBS-like abdominal pain and somatization scores, an important modifier of treatment response in this population.
We acknowledge some limitations. First, cross-sectional studies cannot prove causality since a necessary criterion of causality is the appropriate temporal relationship between the hypothesized predictor and the endpoint of interest. Second, even though a gastroenterologist compiled a standardized form on patients’ clinical characteristics, we lacked information on physiological tests of bowel function, which may have helped classify patients in functional subtypes. Third, we lacked information on subjects’ work incentive structure (e.g. contract type, firm size), which could play a role in labour-supply decisions. In the Italian labour market, employment protection laws are strict for employees in large firms and lenient for self-employed and workers of small firms. However, our data did not show any pattern suggesting an association between constipation severity and self-employment, thus reducing the potential for confounding bias from this source. Additionally we could not rely on extensive diagnostic work up to exclude the coexistence of possible causes of organic constipation at the moment of interview. However, we enrolled patients in tertiary-level care clinics and the mean time since disease onset was 17 years, thus reducing the chance of misdiagnosis. In addition, our sensitivity analyses discounted the likelihood of selection bias by inappropriate inclusion of secondary constipation in study sample. Finally, even though reliance on self-reported healthcare utilization data may introduce classification bias, they have been proven accurate in a recent validation study in IBD patients. 40
In conclusion, we observed a graded increase in work productivity losses with increasing constipation severity and increased healthcare utilization especially among patients in the highest PAC-SYM quintile. These associations were independent from the presence of abdominal pain. Further studies should evaluate whether significant economic savings might be achieved with pharmacological regimens aimed at reducing symptoms severity in patients with CC.
Footnotes
Funding
The study was supported by Shire Pharmaceuticals with a unrestricted grant to DoxaPharma.
Conflict of interest
Basilisco Guido has received lecture fees from Alfa Wassermann, Chiesi Pharmaceuticals, Shire Pharmaceuticals, and Sofar. Gabrio Bassotti has received lecture fees from Shire Pharmaceuticals. Massimo Bellini has received lecture fees from Shire Pharmaceuticals and Valeas Pharmaceuticals. Rosario Cuomo has received lecture fees from Shire Pharmaceuticals. Enrico Corazziari has received lecture fees from Shire Pharmaceuticals. Vincenzo Stanghellini has received lecture fees from Shire Pharmaceuticals. The other authors declare no conflict of interest.
References
Supplementary Material
Please find the following supplemental material available below.
For Open Access articles published under a Creative Commons License, all supplemental material carries the same license as the article it is associated with.
For non-Open Access articles published, all supplemental material carries a non-exclusive license, and permission requests for re-use of supplemental material or any part of supplemental material shall be sent directly to the copyright owner as specified in the copyright notice associated with the article.