
Abstract
Background
Although infliximab treatment is an option for patients with ulcerative colitis (UC), not all patients do respond to therapy, and cellular mechanisms leading to therapy response are incompletely known.
Objective
The objective of this article is to determine early effects of infliximab therapy on T cells in the blood of UC patients and if effects differed in therapy responders and nonresponders.
Methods: Blood samples were obtained before and two weeks post-treatment start from 34 anti-tumor necrosis factor (TNF) therapy-naïve UC patients undergoing infliximab therapy. Response to therapy was evaluated prior to the fourth treatment dose. Expression of T cell surface markers and levels of soluble receptors and cytokines in serum were determined.
Results
At baseline, there were no differences in cellular, biochemical or clinical parameters between therapy responders and nonresponders. Infliximab therapy reduced frequencies of CD25+ T cells and increased frequencies of annexin V+ T cells in patients responding to infliximab, but not in nonresponding patients, two weeks after therapy start. Only therapy responders had decreased serum levels of sCD25 and sTNFRII two weeks after treatment start. In contrast, clinical parameters did not reflect therapy outcome already two weeks after therapy start.
Conclusion
Soluble and membrane-bound T cell receptors may be early indicators of infliximab therapy response in UC, which can be of clinical importance for the decision when to continue or to stop the treatment.
Introduction
Anti-tumor necrosis factor (anti-TNF) antibody therapy is the first example of a biologic therapy used to treat inflammatory conditions, and has changed the therapeutic potential in chronic inflammatory diseases including inflammatory bowel disease (IBD). Infliximab therapy has been reported to induce mucosal healing and maintain remission in patients with ulcerative colitis (UC).1–3 Even though many patients with UC benefit from infliximab treatment, the effect of the therapy is inconsistent. The clinical trials ACT1 and ACT2 demonstrated remission rates of 20% to 30% and response rates of 60% to 70% in UC patients.2,4 However, these trials did not identify biological markers that could predict patients with a positive response. As a consequence, most patients are treated for at least three months with anti-TNF agents, despite the fact that approximately 30% of them are primary nonresponders. In clinical settings, biomarkers that can predict if patients are responders or nonresponders within a few weeks after therapy start are greatly needed.
Despite the clinical success of TNF inhibitors, their mechanisms of action mediating the beneficial effects in IBD patients are not fully understood. 5 It has been suggested that anti-TNF antibodies induce apoptosis of macrophages 6 and T cells7–9 in IBD patients, although these results have been questioned.10,11 Another proposed mechanism for reduction of inflammation is that anti-TNF antibodies increase the frequency of FOXP3+CD25hi T regulatory cells. 12 Also, it has been shown that apoptosis of T regulatory cells of IBD patients may be reversed by anti-TNF treatment. 13 A recent study indicates that TNF inhibitors in fact restrict T cell activation and cycling via Notch-1 signaling in IBD. 14
Few studies have related their findings of mechanistic actions of anti-TNF antibodies to the therapy response of the patients. It is therefore interesting to note that high expression of Th1- and Th17-related cytokines in the mucosa of UC patients has been shown to predict a favorable outcome of infliximab-induction therapy. 15 Infliximab therapy response has also been associated with increased frequencies of FOXP3+ T regulatory cells in blood, 16 and therapy responders, but not nonresponders, have been shown to effectively modulate mucosal Th1, Th2 and Th17 pathways. 17
We hypothesized that T cells of primary responders and nonresponders react differently to anti-TNF therapy. We therefore aimed to decipher the effects of infliximab therapy on circulating T cells and receptors shed by these cells, in previously anti-TNF therapy-naïve UC patients. Patients with UC were prospectively followed from start of infliximab treatment to investigate if any of the mentioned parameters could reflect early primary therapy response already two weeks after therapy start.
Materials and methods
Subjects and collection of material
Patients with UC were recruited and prospectively included in the study at the outpatient clinics at Sahlgrenska University Hospital, Gothenburg, Kärnsjukhuset in Skövde, and Södra Älvsborg Hospital, Borås, Sweden. Blood samples for immunological analysis were taken at baseline (prior to start of treatment) and two weeks after the first day of treatment (prior to infusion of the second treatment dose). Stool samples for fecal calprotectin analysis and serum samples for C-reactive protein (CRP) analysis were collected at baseline and at treatment evaluation three to four months after therapy start. The disease activity was determined by Mayo score. 18 Therapy response was defined as a decrease in Mayo score of ≥3 compared with baseline, prior to the fourth treatment dose approximately three to four months after therapy start. Patients not achieving this decrease in Mayo score were considered as nonresponders. The study was performed after receiving written informed consent from all subjects, and the protocol was approved by the Regional Ethical Review Board at the University of Gothenburg.
Isolation of peripheral blood lymphocytes and flow cytometric staining and analysis
Peripheral blood mononuclear cells (PBMCs) were isolated from heparinized venous blood by density-gradient centrifugation on Ficoll-Paque (GE Healthcare Bio-Sciences AB, Uppsala, Sweden). Freshly isolated cells were stained for flow cytometry analysis of various surface markers using combinations of the following antibodies: anti-CD3-fluorescein isothiocyanate/allophycocyanin (FITC/APC), anti-CD4-FITC/PE/APC, anti-CD8-FITC/PE/APC, anti-CD25-PE, mouse immunoglobulin (Ig)G1κ-PE isotype control, (all from BD Biosciences, San Jose, CA, USA), anti-FOXP3-APC (clone 236A/E7, eBioscience, San Diego, CA, USA) and anti-TNFRII-PE (R&D Systems, Minneapolis, MN, USA). Before staining with APC-conjugated anti-FOXP3 antibodies, the cells were fixed and permeabilized with Fixation/Permeabilization buffer (eBioscience). Intracellular staining and washing was performed in Permeabilization buffer (eBioscience). For analysis of T cell apoptosis, cells were diluted in Annexin V Binding Buffer (BD). Cells were then labeled with Annexin V-APC (BD), 7AAD (BD), anti-CD25-PE and anti-CD4-FITC or anti-CD8-FITC. The frequency of apoptotic cells was defined as Annexin V+ cells among live 7AAD− cells. Flow cytometry analysis was performed using an LSR II flow cytometer (BD Pharmingen), and at least 10,000 lymphocytes per sample were analyzed, as defined by forward and side scatter. T cells were identified based on their expression of CD4 or CD8. The data were analyzed using Flow Jo software (Treestar Inc, Ashland, OR, USA).
Calprotectin, cytokine and soluble receptor assays
Fecal calprotectin was analyzed by a sandwich enzyme-linked immunosorbent assay (ELISA) (Calprotectin ELISA; Bühlmann Laboratories AG, Basel, Switzerland). Serum levels of interleukin (IL)-4, IL-5, IL-8, IL-10 and TNF were measured by Fluorokine Multianalyte Profiling (R&D Systems). ELISA was used to measure serum levels of IL-17A (eBioscience, San Diego, CA), sTNFRII (R&D Systems) and sCD25 (Diaclone SAS, Besancon, France). All assays were used according to the manufacturers’ instructions.
Statistical analysis
All statistical evaluations were performed with the GraphPad Prism 6.0 (GraphPad Software, La Jolla, CA, USA). Wilcoxon signed rank test was used to evaluate differences between two sets of paired samples, and the Mann Whitney U test was performed to evaluate differences between two groups. Receiver operating characteristics (ROC) curves were used to assess specificity and sensitivity of the different activation markers for discriminating responders from nonresponders. An area under the ROC curve (AUROC) of >0.7 is considered fair, >0.8 good and >0.9 as having excellent discriminative ability. In the ROC curve analyses Δ values (difference between baseline and two weeks after therapy start) were used to identify the cut-off value, or positive predictive value, above which there is the best likelihood of being a responder. P values < 0.05 were considered as statistically significant. Data given in the text, tables and figures are demonstrated as median (25th–75th percentiles).
Results
Demographics and clinical parameters in responders and nonresponders
Demographics of patients undergoing anti-TNF therapy
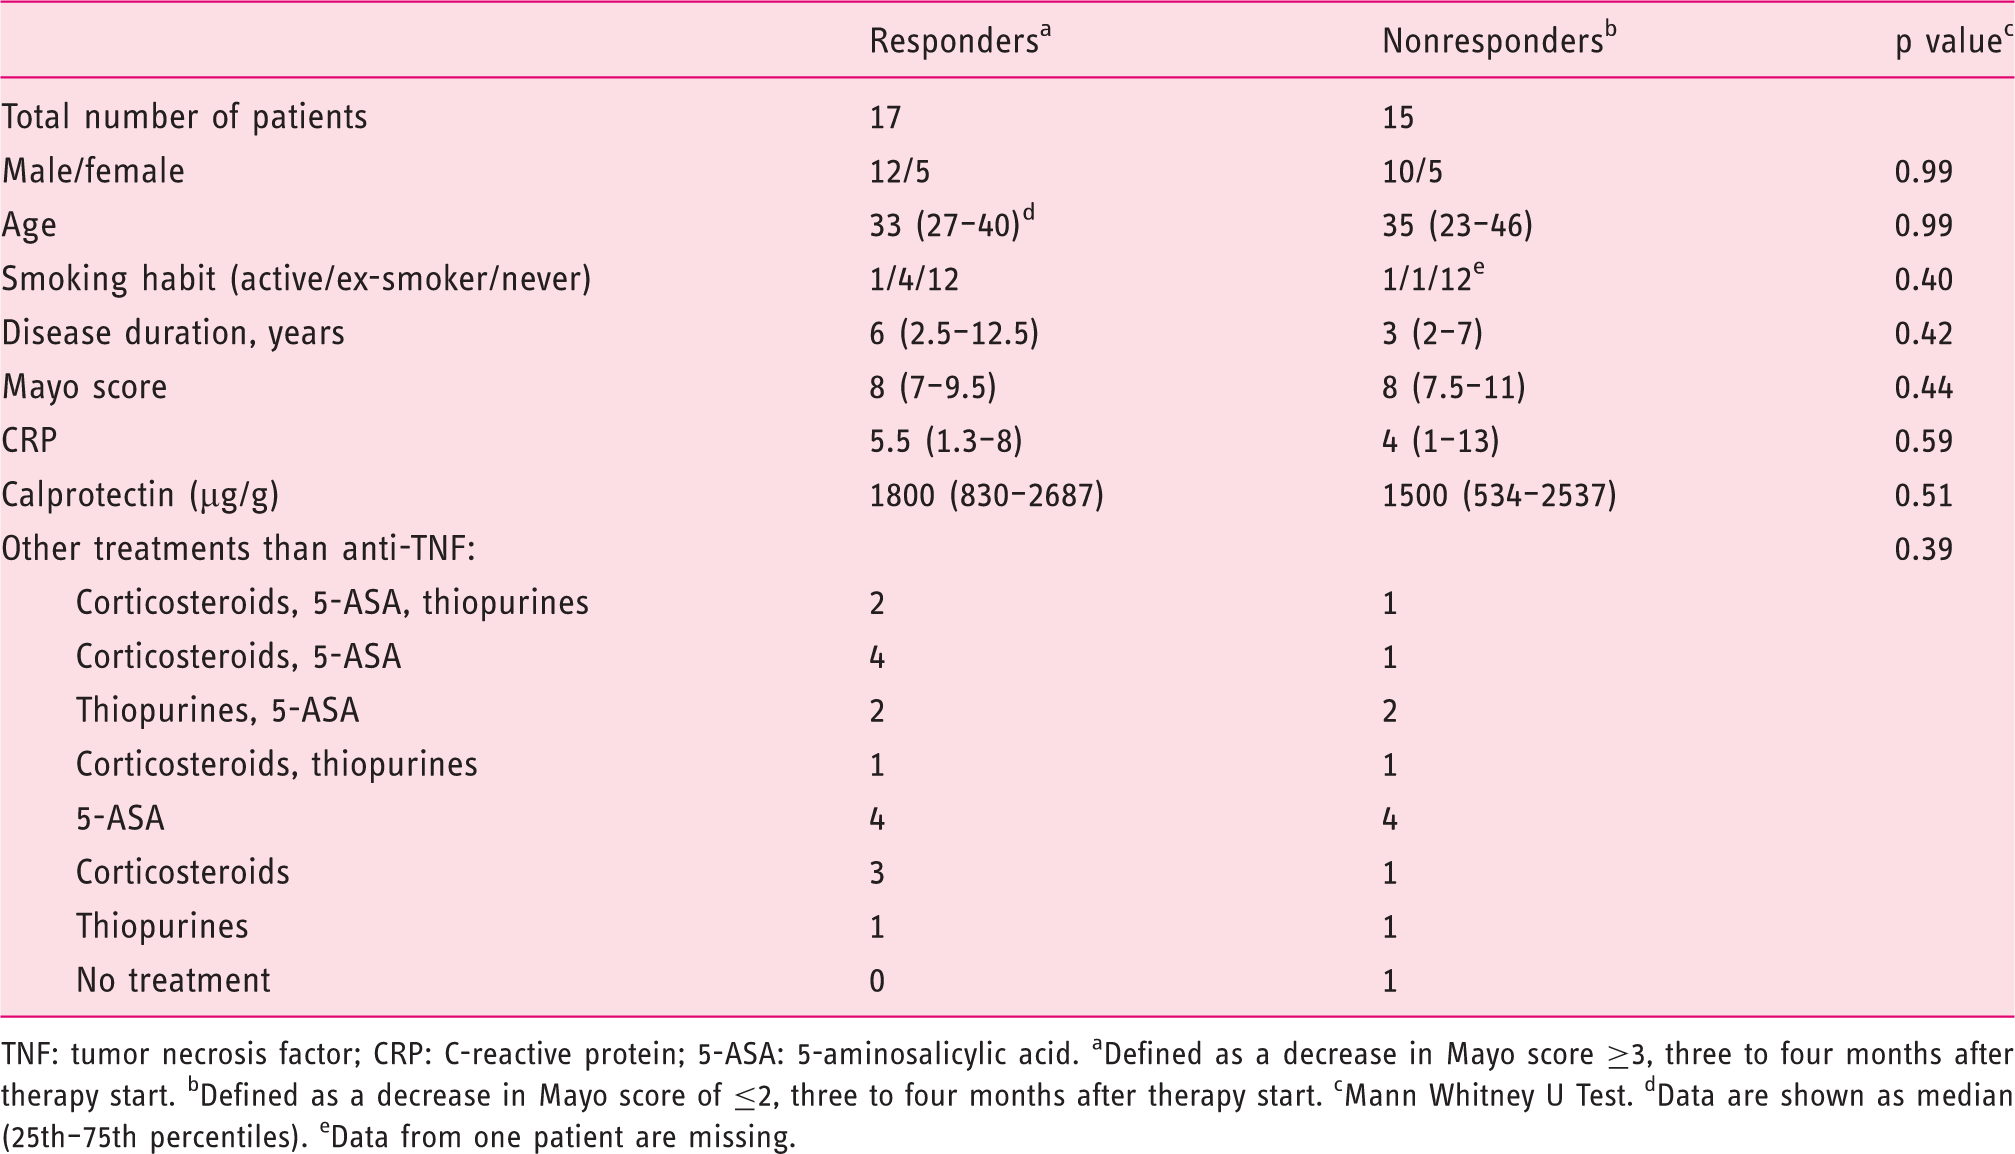
TNF: tumor necrosis factor; CRP: C-reactive protein; 5-ASA: 5-aminosalicylic acid. aDefined as a decrease in Mayo score ≥3, three to four months after therapy start. bDefined as a decrease in Mayo score of ≤2, three to four months after therapy start. cMann Whitney U Test. dData are shown as median (25th–75th percentiles). eData from one patient are missing.
Characteristics of T cells at baseline
Characteristics of T cells and soluble receptors at baseline for patients undergoing anti-TNF therapy
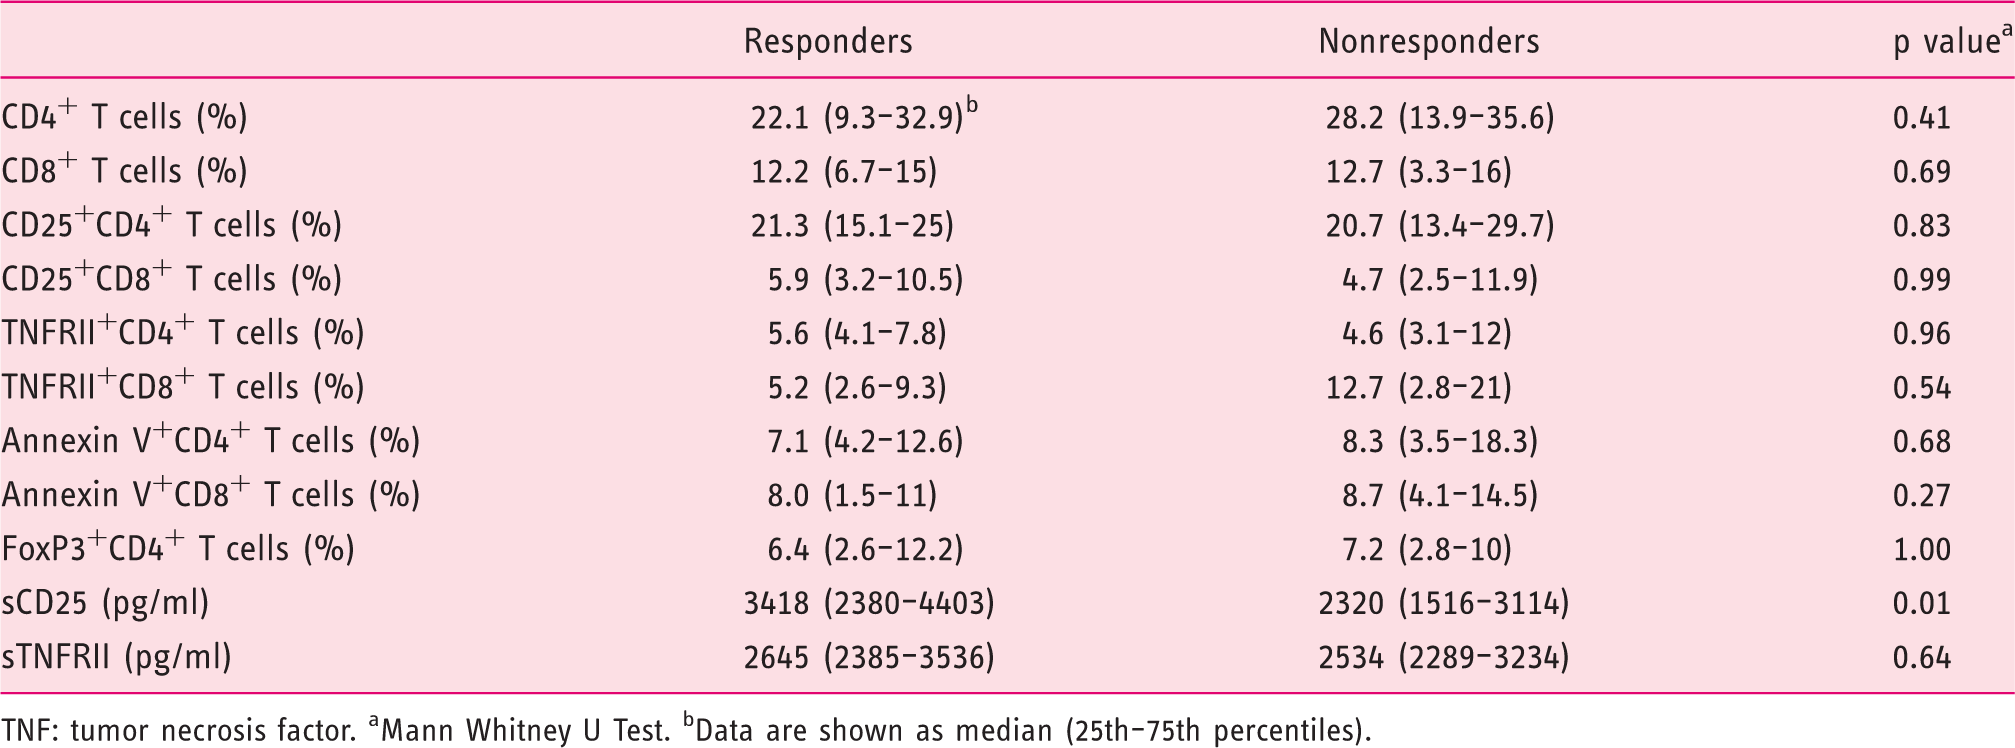
TNF: tumor necrosis factor. aMann Whitney U Test. bData are shown as median (25th–75th percentiles).
Clinical parameters two weeks after therapy start do not reflect therapy response
Two weeks after therapy start disease activity was assessed by CRP and a partial Mayo score including stool frequency, rectal bleeding and the physician’s global assessment. CRP levels did not differ between baseline and two weeks after therapy start in responders (5 (1.3–7.8) vs 1 (1–3) mg/l; p = 0.07) or nonresponders (3 (1–6.5) vs 2 (1–4.5) mg/l; p = 0.16). In contrast, decreased partial Mayo score was recorded both in responders (6 (6–7) vs 3 (1.3–4); p = 0.0001) and nonresponders (6 (4–8) vs 4 (2–6); p = 0.02) when comparing the two visits.
Decreased frequency of CD25+ T cells two weeks after therapy start reflects infliximab therapy response
Activated T cells were identified by the expression of CD25 among CD4+ and CD8+ T cells (Figure 1(a)). Infliximab therapy reduced the frequencies of CD25+CD4+ T cells and CD25+CD8+ T cells two weeks after therapy start as compared to baseline in therapy responders (Figures 1(b) and (c)). In contrast, patients not responding to infliximab therapy had increased frequencies of CD25+CD4+ and CD25+CD8+ T cells two weeks post-therapy start (Figure 1(b) and (c)). The altered frequencies of activated CD25+ T cells two weeks after therapy start were not due to altered frequencies of circulating T cells since the levels of CD4+ T cells and CD8+ T cells at baseline and after two weeks of therapy were comparable in therapy responders and nonresponders (Table 3). The reduction in the frequencies of CD25+CD4+T cells and CD25+CD8+ T cells at two weeks after baseline demonstrated excellent ability to discriminate between responders and nonresponders, as demonstrated by the area under the ROC curve (Figure 1(d)). The best cut-off value for the change in the frequency of CD25+CD4+T cells, at baseline compared to two weeks after therapy start, to differentiate between therapy responders and nonresponders was a decrease of ≥0.65% with a sensitivity of 84.6 % (95% confidence interval (CI) 54.6–98.1) and a specificity of 87.5% (95% CI 61.7–98.5). The best cut-off value for the change in the frequency CD25+CD8+ T cells, at baseline compared to two weeks after therapy start, to differentiate the two groups was a decrease of ≥0.14% with a sensitivity of 69.2% (95% CI 38.6–90.9) and a specificity of 93.8% (95% CI 69.8–99.8). Also, the combined analysis of the reduction of CD25 expression on CD4+T cells and CD8+ T cells at two weeks after baseline demonstrated little overlap between responders and nonresponders (Figure 1(e)). However, neither responding nor nonresponding patients displayed altered levels of FOXP3+CD4+ T cells, TNFRII+CD4+ T cells or TNFRII+CD8+ T cells two weeks after therapy start as compared to baseline (Tables 2 and 3).
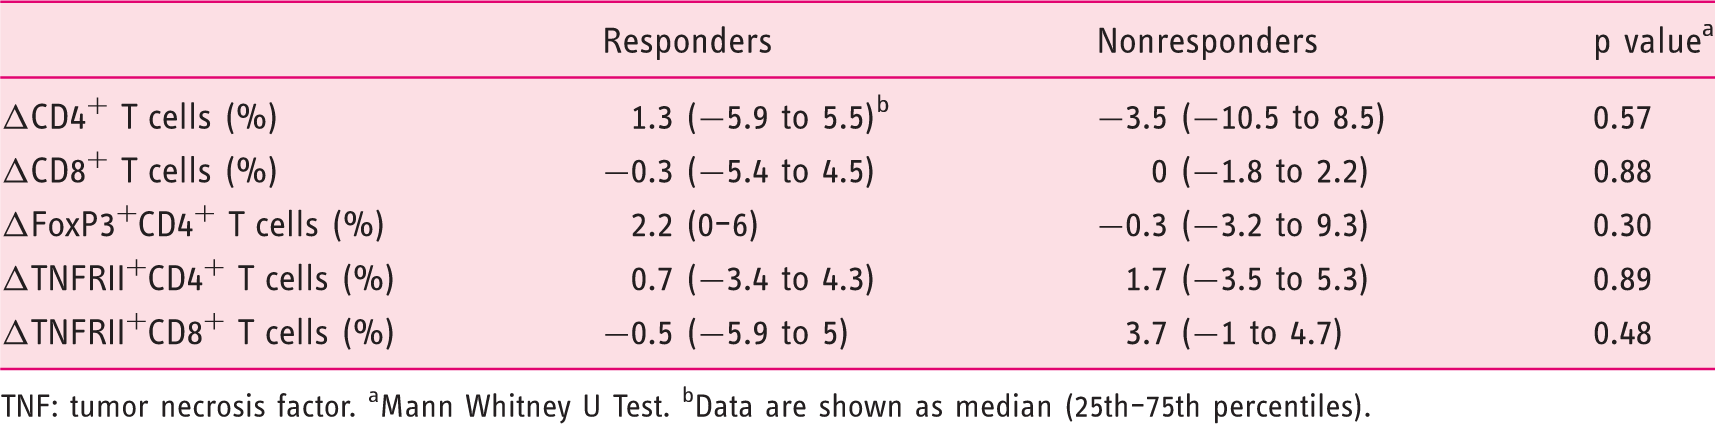
Frequencies of activated blood T cells in UC patients undergoing anti-TNF therapy. Altered frequency of different T cell populations (Δ = baseline–two weeks after therapy start) for patients undergoing anti-TNF therapy TNF: tumor necrosis factor. aMann Whitney U Test. bData are shown as median (25th–75th percentiles).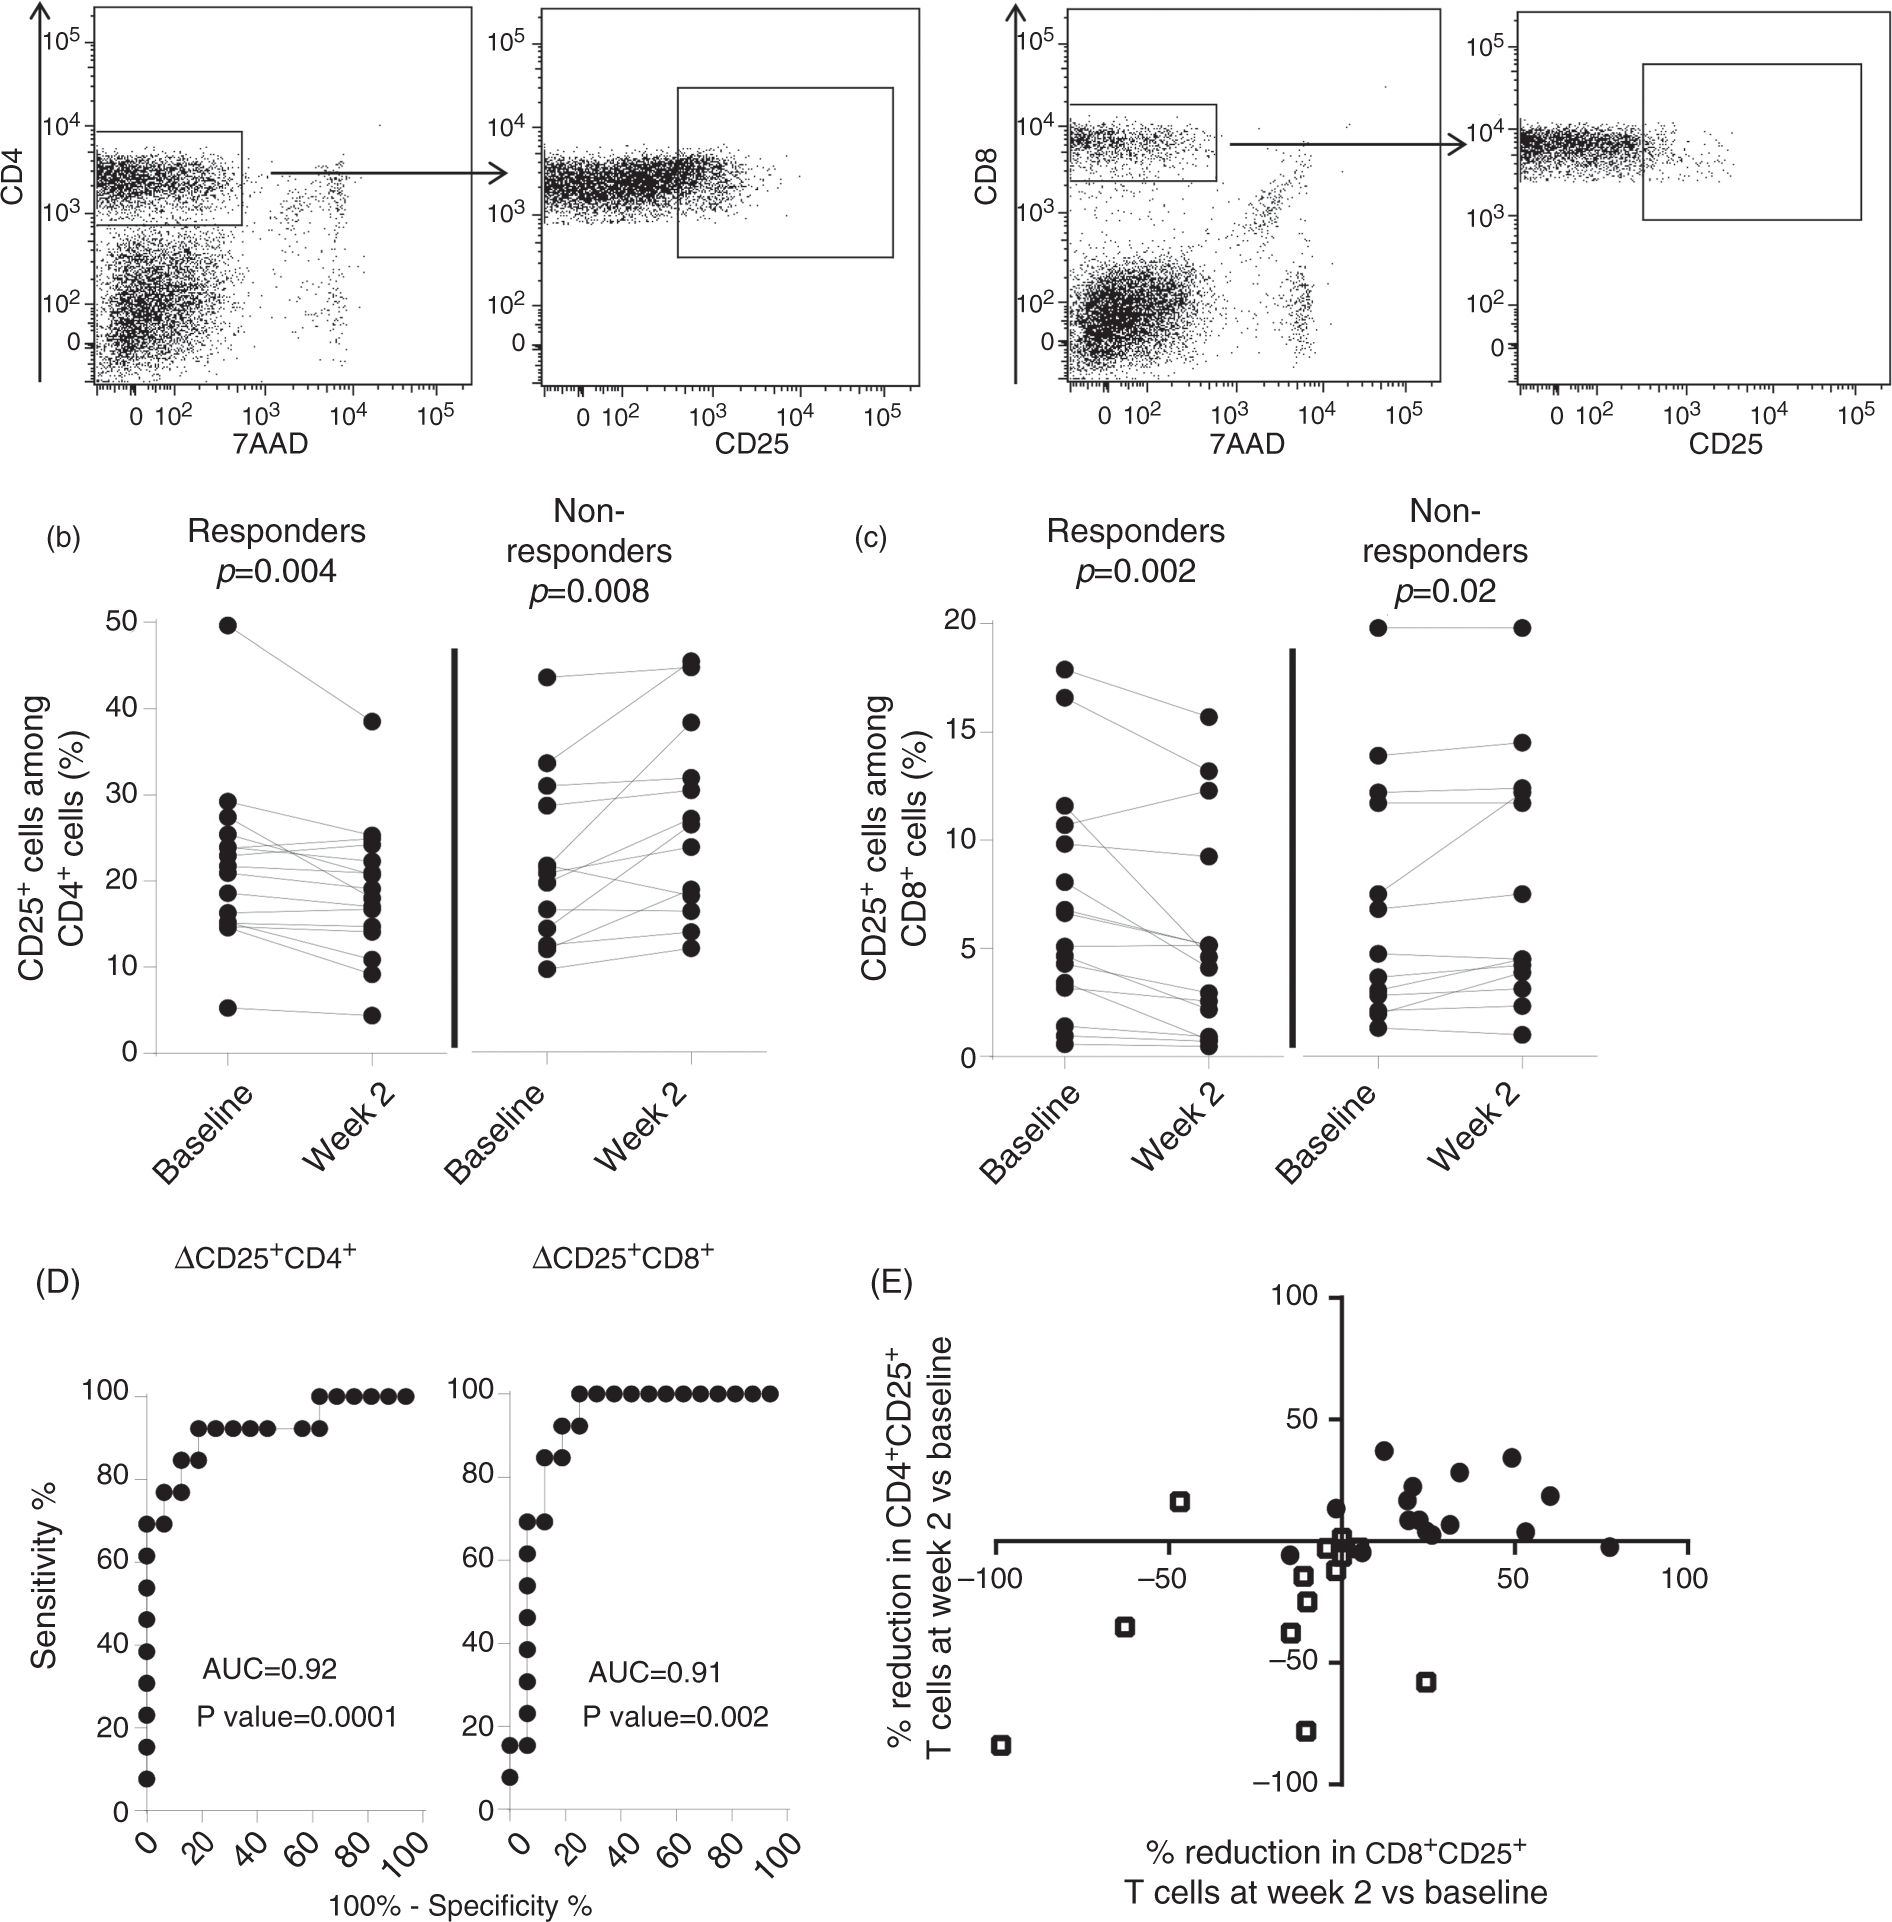
Infliximab therapy induces apoptosis among T cells in therapy responders
Apoptosis among CD4+ and CD8+ T cells was measured by surface staining of annexin V (Figure 2(a)). Infliximab therapy increased the frequencies of annexin V+CD4+ T cells and annexin V+CD8+ T cells two weeks after therapy start in therapy responders (Figure 2(b) and (c)). In contrast, the frequencies of annexin V+CD4+ T cells and annexin V+CD8+ T cells did not differ between baseline and after two weeks of treatment in nonresponders (Figure 2(b) and (c)). To further define the apoptotic cells, the CD4+ T cells among therapy responders were grouped into CD25+ and CD25− fractions (gated as in Figure 1(a)) and the frequency of annexin V+ T cells was determined. Results showed that induction of apoptosis is initiated both in CD25+CD4+ and CD25−CD4+ T cell populations in therapy responders (Figure 2(d)).
Frequencies of apoptotic T cells in UC patients undergoing anti-TNF therapy.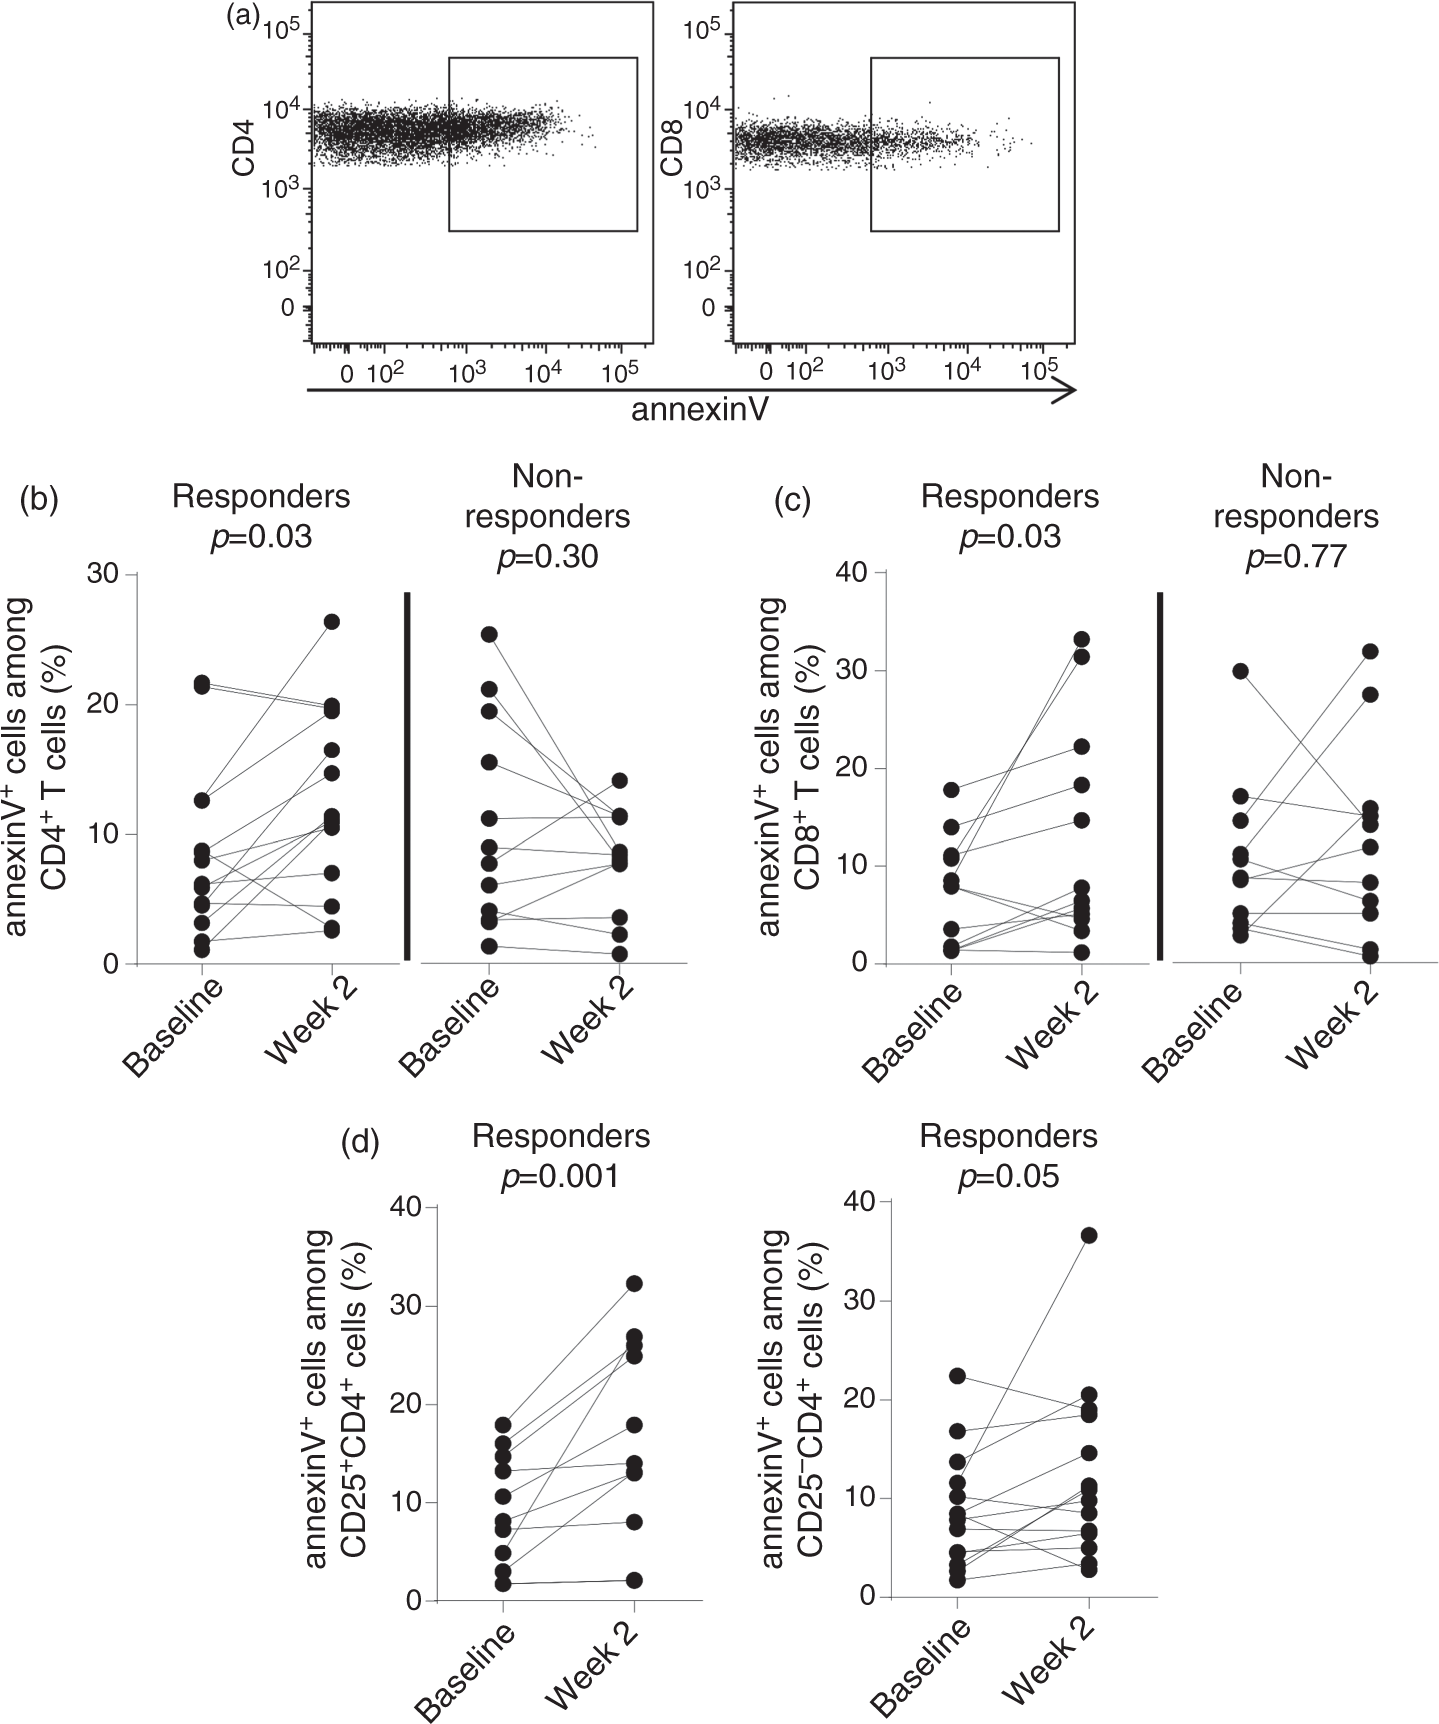
Effects of infliximab therapy on cytokine levels in serum
Serum cytokine levels at baseline and two weeks post-therapy start for patients undergoing anti-TNF therapy (ng/ml)
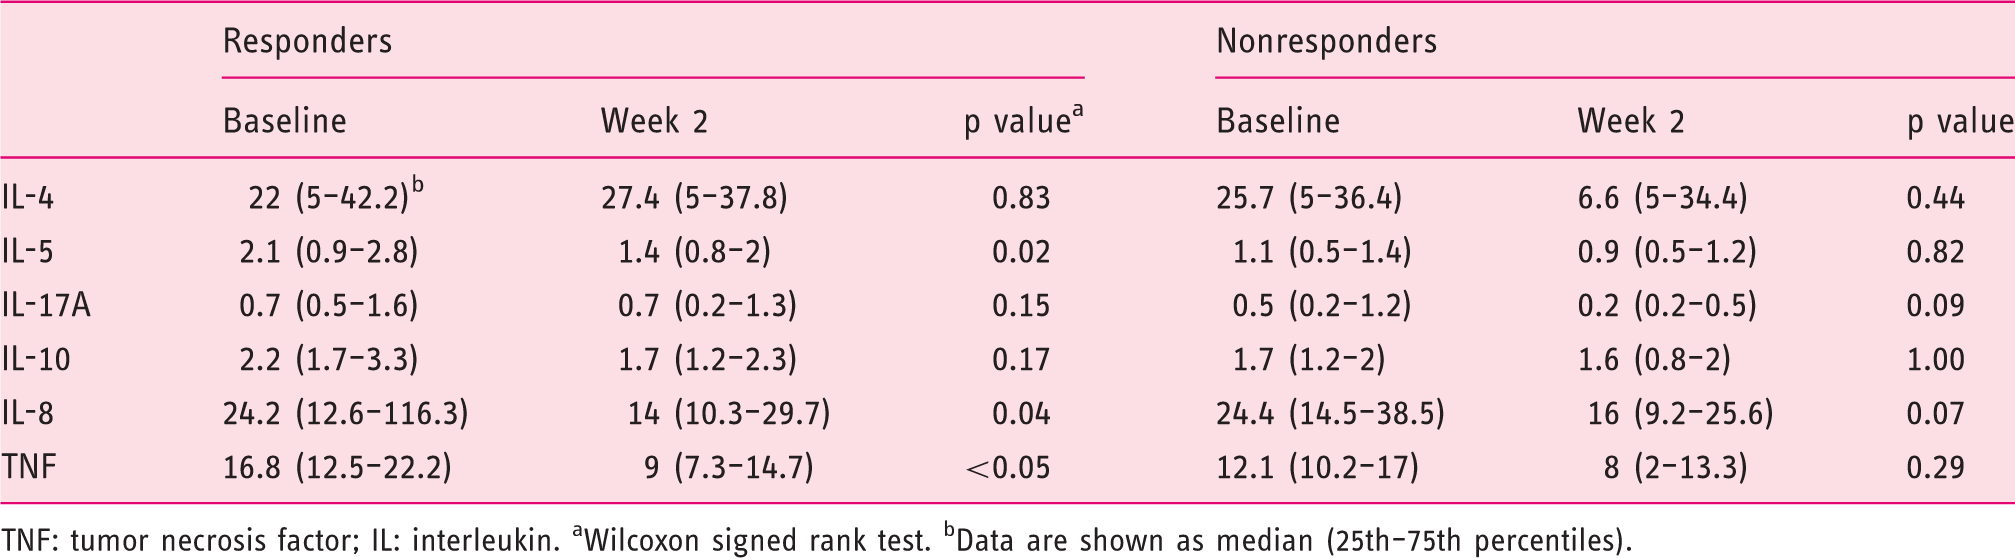
TNF: tumor necrosis factor; IL: interleukin. aWilcoxon signed rank test. bData are shown as median (25th–75th percentiles).
Decreased serum levels of sCD25 and sTNFRII two weeks post-therapy start reflects therapy response
Since activated T cells shed receptors, serum levels of soluble CD25 (sCD25) and TNFRII (sTNFRII) were measured at baseline and two weeks after therapy start. At baseline, serum levels of sTNFRII were similar in both patient groups while sCD25 levels were higher in the group of therapy responders (Table 2). Two weeks after therapy start the levels of sCD25 and sTNFRII were decreased as compared to baseline in therapy responders (Figure 3(a) and (b)). In contrast, patients not responding to infliximab therapy had comparable levels of sCD25 and sTNFRII at baseline and two weeks after therapy start (Figure 3(a) and (b)). The reduction of both sCD25 and sTNFRII in serum two weeks after therapy start had good discriminative validities to positively identify responders and nonresponders, with an area under the ROC curve (AUC) of 0.78 and 0.81, respectively (Figure 3(a) and (b)). The best cut-off value for the reduction of sCD25, at baseline compared to two weeks after therapy start, to differentiate between therapy responders and nonresponders was a decrease of ≥98 pg/ml, with a sensitivity of 66.7% (95% CI 34.9–90.1) and a specificity of 77.8% (95% CI 52.4–93.6). The best cut-off value for the reduction of sTNFRII, at baseline compared to two weeks after therapy start, to differentiate the two groups was a decrease of ≥255 pg/ml, with a sensitivity of 75% (95% CI 42.8–94.5), and a specificity of 72.2% (95% CI 46.5–90.3).
Serum levels of soluble receptors in UC patients undergoing anti-TNF therapy.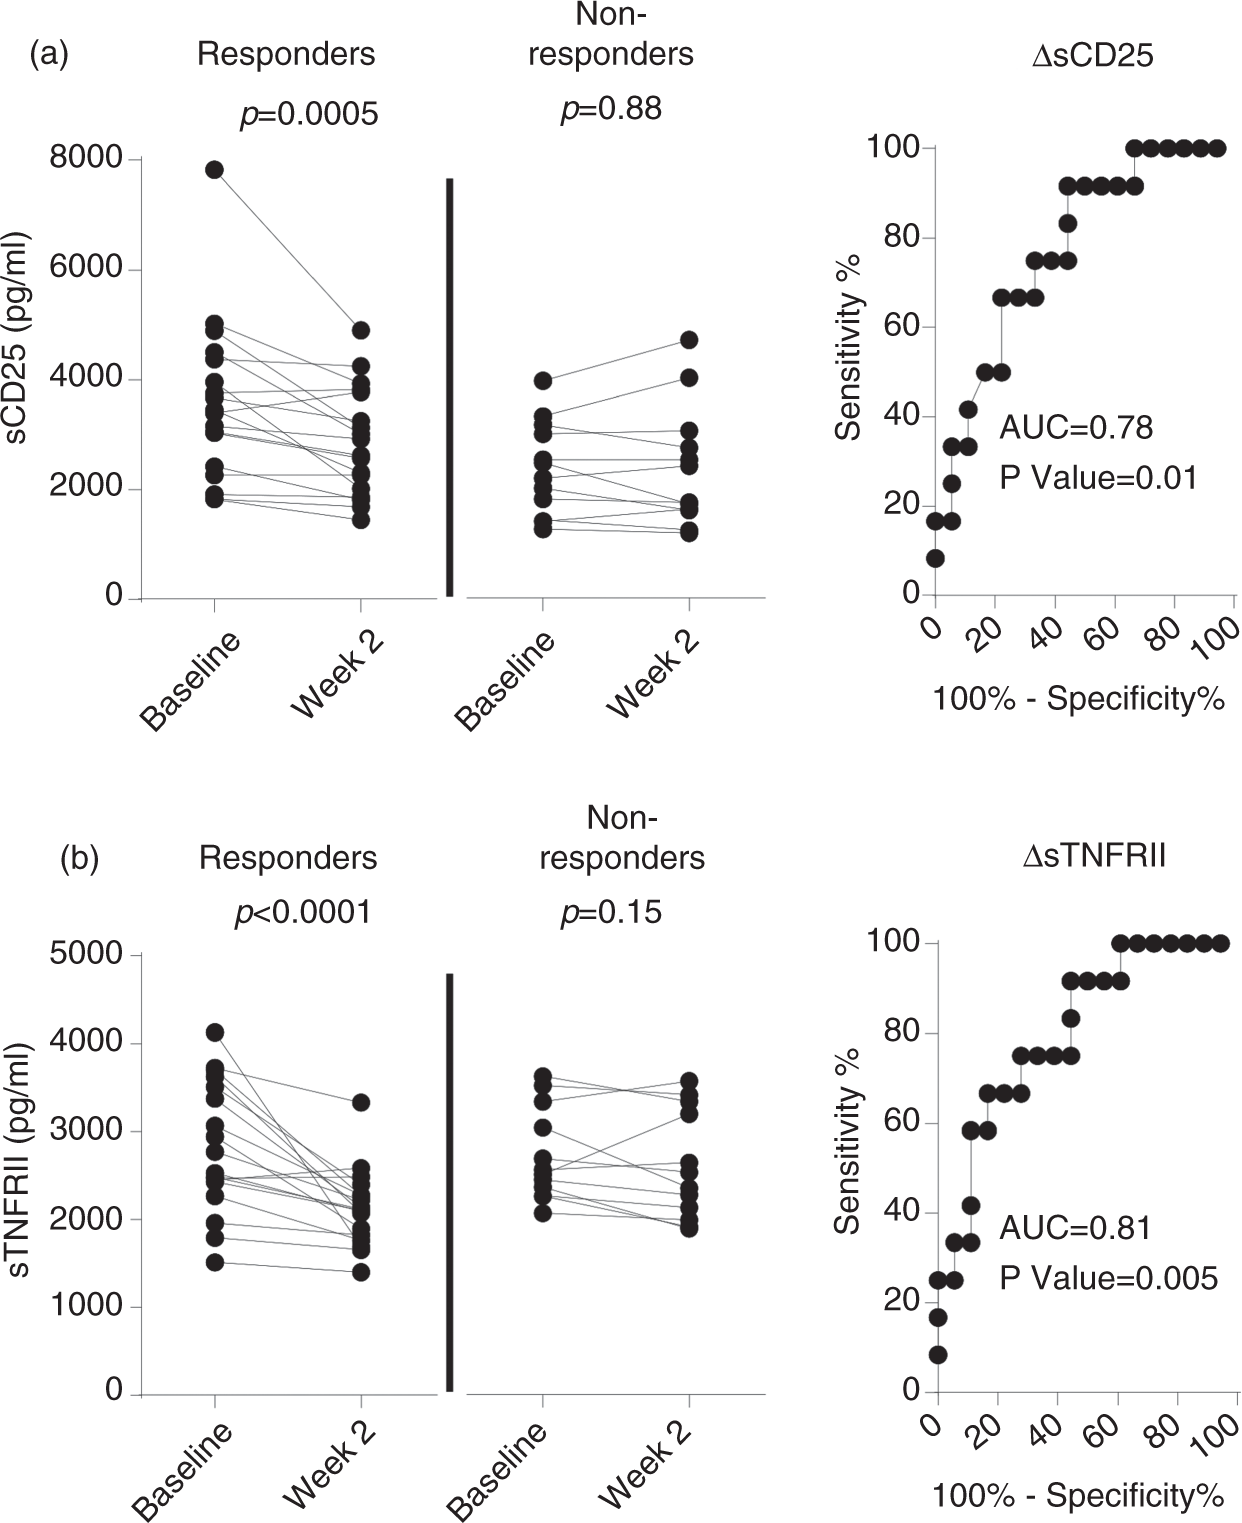
Discussion
This prospective study demonstrates that an early reduction of the frequencies of activated T cells reflects response to therapy in patients with moderately to severely active UC. Also, the reduction of activated immune cells in therapy responders was accompanied by decreased serum levels of the soluble receptors sCD25 and sTNFRII, shed by activated T cells, already two week after treatment start. In contrast, age, gender, disease severity or duration, CRP, or partial Mayo score did not reflect the outcome of infliximab treatment.
We have demonstrated that reduced frequencies of circulating CD25+CD4+ T cells and CD25+CD8+ T cells two weeks after therapy start reflect infliximab therapy response after three to four months in previously anti-TNF therapy-naïve UC patients. In contrast, the frequencies of CD25+CD4+ T cells and CD25+CD8+ T cells increased in nonresponding patients. This was best demonstrated by the combined analysis of the reduction of CD25 expression of CD4+ T cells and CD8+T cells, where only a minor overlap between responders and nonresponders was seen. However, it should be noted that the overall effect size is small for the differences detected and whether the reduction of CD25 expressing T cells may be used to discriminate between the responder and nonresponder group in clinical practice needs to be confirmed in an additional patient cohort.
T cells upregulate their surface expression of CD25 (IL-2Rα) after recognition and activation by their specific antigen. Also, human FOXP3+ T regulatory cells often, but not always, do express CD25. Thus, therapy responders, but not nonresponders, have reduced frequencies of circulating CD25+ T cells, hence activated T cells and potential effector T cells, already two weeks after therapy start. Our group, as well as Pimentel-Muiños et al., have previously demonstrated that in vitro conditions with low levels of TNF resulted in reduced T cell activation, and thereby reduced frequencies of CD25-expressing T cells.19,20 In the current study patients responding to infliximab therapy, but not nonresponders, demonstrated reduced TNF serum levels two weeks after therapy start together with reduced frequencies of activated CD25+ T cells. In accordance with our data, Li et al. showed that IBD patients responding to infliximab treatment had lower levels of mucosal mRNA levels of CD25 after the treatment period. 16 This reduction was not recorded in nonresponding IBD patients. Thus, T cell regulation of CD25 expression seems to be an important feature for positive clinical effects of anti-TNF therapy.
We have also demonstrated a reduction of serum levels of sCD25 and sTNFRII two weeks after therapy start in therapy responders. Activated T cells are known to shed soluble forms of CD25 and TNFRII that can be detected in serum both in health and disease.21,22 Increased serum levels of both sCD25 and sTNFRII have been demonstrated in UC patients with active disease and these soluble receptors have therefore been proposed as biomarkers for disease activity.23–25 Our data confirm these results and further suggest both sCD25 and sTNFRII as potential early biomarkers for infliximab therapy response. In contrast, two weeks after therapy start the routine clinical parameters CRP and partial Mayo score did not differentiate between responders and nonresponders. Thus, CRP or partial Mayo score two weeks post-treatment start did not predict therapy response.
A previously proposed mechanism of anti-TNF antibodies is the induction of apoptosis in T cells, and there are reports of apoptosis of mucosal T cells in anti-TNF therapy-responding IBD patients.7–9,26 Also, in our study increased frequencies of apoptotic CD4+ T cells two weeks after infliximab therapy start reflected therapy response, whereas apoptosis of T cells was not induced in the majority of patients nonresponsive to therapy. The induction of apoptosis did not seem to be associated with T cell activation as induction of apoptosis of both CD25+ and CD25− cells was recorded among therapy responders. Thus, our data do support apoptosis of peripheral blood T cells as a mechanism for infliximab therapy response, irrespective of activation status. In addition, we demonstrated that this effect was not induced in T cells in nonresponding patients.
Our group has previously demonstrated that increased disease activity in UC patients is associated with reduced frequencies of circulating FOXP3+ T regulatory cells, along with an enrichment of mucosal FOXP3+ T regulatory cells. 27 In our current study we found no association between therapy response and frequencies of circulating CD4+FOXP3+ T cells. However, we cannot entirely rule out the role for CD4+FOXP3+ T regulatory cells in our setting, since our identification of T regulatory cells was imperfect, and additional surface markers such as CD25 and CD127 would have improved the identification of this cell population. Several groups have reported an increased ratio of circulating FOXP3+ T regulatory cells among CD4+ T cells associated with infliximab therapy, both in IBD and rheumatoid arthritis.16,28 These data are, however, questioned by several other studies reporting no evidence for increased levels of circulating FOXP3+ T regulatory cells in anti-TNF therapy responders.29–31 It may be argued that an altered frequency of FOXP3+ T regulatory cells may be a later event after infliximab therapy, and if so, not an early biomarker for therapy response. This assumption is supported by the report of maximal increase of FOXP3+ T regulatory cells 22 weeks after therapy start. 16
In summary, we have for the first time demonstrated that decreased frequencies of activated CD25+ T cells, together with reduced serum levels of sCD25 and sTNFRII two weeks after therapy start, reflect primary therapy response in anti-TNF-naïve UC patients. We therefore conclude that the phenotype of T cells and, most important, serum levels of sCD25 and sTNFRII may be used as early biomarkers of therapy response, which can be of great clinical importance for the decision when to continue or to stop the treatment.
Footnotes
Author contributions
LÖ, MKM and HS contributed to the conception and design of the study. MKM, RD and SI performed experiments. HS, AB, AL, KAU and MS recruited and enrolled patients in the study. All authors contributed to the analysis and interpretation of data. LÖ and MKM wrote the manuscript and HS, SI, RD, AB, AL, KAU and MS critically reviewed the manuscript and approved the final draft.
Funding
This study was supported by The Swedish Medical Research Council (MS grants 13409, 21691, 21692; LÖ grant 22273), The Health and Medical Care Committee of the Regional Executive Board, Region Västra Götaland, Mag-Tarm Fonden, The Swedish Society of Medicine, MIVAC, and the Foundations of Nanna Svartz, Magnus Bergvall, Sahlgrenska University Hospital, Wilhelm and Martina Lundgren, and Marianne and Marcus Wallenberg.
Conflict of interest
The authors declare that here is no conflict of interest.