
Abstract
Background and objectives
The rising demand for computed tomography (CT) has put pressure on radiology departments to optimize workflows and turnaround times (TATs). TATs in CT encompass the entire process from order to report finalization. Optimizing the TAT is essential to improving patient satisfaction and workflow. This study aimed to evaluate the TAT of CT scans and the influencing factors at Palestinian hospitals.
Methods
A cross-sectional retrospective study on 8,220 CT scan orders from three Palestinian hospitals was conducted. Data from CT scans, completed from 01/07/2023 to 31/12/2023, were collected from the medical records stored in the Enterprise Resource Planning (ERP) system. The collected data included times of CT scan order, acceptance, and final report, order status, encounter type, the ordering day and time, and whether CT scans were with or without contrast media. Then, the order-to-accept TAT, the accept-to-result TAT, and the order-to-result TAT were calculated in minutes. Nonparametric statistical analyses were employed to identify associations between TATs and encounter type, scan day, working shift, and contrast media utilization.
Results
The median TATs from order to acceptance, from order to result, and from acceptance to result were 78, 837, and 462 minutes, respectively. TATs varied significantly depending on working shifts, the day of the week, encounter type, and the use of contrast media. The order-to-accept TAT was higher for inpatient CT scans, CT scans ordered on C shifts, and those with contrast media. The accept-to-result TAT was higher for outpatient CT scans, CT scans ordered on B shift compared to A shift, CT scans ordered on weekends, and those with contrast media. The order-to-result TAT was higher for outpatient compared to emergency CT scans, CT scans ordered on C shift, CT scans ordered on weekends, and CT scans with contrast media.
Conclusion
CT scan TATs constitute essential indicators of operational efficiency in radiology departments. Several factors significantly influence these metrics, including the order day, the working shift, the request source, and the administration of contrast agents. To improve CT scan throughputs, targeted strategies must be implemented to optimize workforce allocation, streamline intra-departmental workflows, and mitigate patient-related delays. Such evidence-informed interventions hold promise for advancing both diagnostic efficiency and the overall quality of radiological services.
1. Introduction
High-quality clinical care relies fundamentally on accurate diagnosis, which in turn depends on the effective application of diagnostic techniques in medical imaging and laboratory testing. 1 The suboptimal laboratory services in hospitals are associated with a detrimental cascading effect on the entire healthcare delivery system. 2
Computed tomography (CT) is a cornerstone in diagnostic medicine, producing high-quality three-dimensional images, which greatly impact differential diagnosis and the customization of treatment plans. 3 CT is widely used in clinical areas, such as acute care, stroke management, trauma evaluation, oncology, and other diagnostic applications. 4 CT scans are widely ordered in emergency, inpatient, and outpatient settings for cancer screening, staging, and follow-up, as well as for guided biopsies and surgical procedures. 5 Additionally, the CT scan can be performed with or without contrast media, depending on clinical indications. While contrast enhances diagnostic clarity, it poses a risk of nephrotoxicity, especially in patients with renal impairment, and this necessitates pre-scan renal function assessment and post-scan hydration. 6 The widespread use of CT in medical practice necessitates protocols that balance diagnostic accuracy with workflow efficiency. 7
Turnaround time (TAT) is a significant metric in healthcare, denoting the duration required for the completion of a process or task, from initiation to outcome.
8
For CT scans, the term covers the entire workflow, from the patient’s arrival to the final radiology report. This includes the initial image request, patient preparation, image acquisition, interpretation, and reporting. TAT in CT scans has a direct impact on patient care and satisfaction, making it a pivotal consideration in healthcare settings.
9
The TAT in a CT scan is classified into order to accept TAT, accept to result TAT, and order to result TAT. The activity model for the CT scan imaging process is shown in Figure 1. The activity model for the CT scan imaging process illustrates the various stages, starting with the entry of the CT request into the Hospital Information System (HIS) and culminating in the generation of the final report.
CT turnaround time is shaped by technical, human, and administrative factors. Technical delays stem from equipment issues, contrast use, and data processing. Human-related factors include staffing levels and interpretation time. Administratively, unclear priorities between urgent and non-urgent cases can hinder workflow efficiency. 10 TAT significantly impacts patient satisfaction and the efficient and timely delivery of medical imaging services. 11 With the rising demand for CT scans, radiology departments are under increasing pressure to optimize their workflow and to reduce the TAT. 12 Inefficient processes and the lack of coordination between healthcare professionals can lead to treatment delays. These delays may stem from barriers in communication and information flow between different departments and personnel, limited availability of resources, inadequate staffing levels, high patient load, a lack of streamlined workflows, standardized protocols, and technical issues with CT scan equipment or systems. 13 Misalignment can cause delays, dissatisfaction, and staff burnout, while coordinated systems improve patient experience, resource use, and overall outcomes. 14
By identifying and addressing the key factors affecting TAT, radiology departments can improve their operational efficiency. 15 The healthcare institutions in Canada and the United Kingdom frequently utilize national performance benchmarks and public reporting frameworks to monitor and enhance TAT. These systems establish clear targets for the timely delivery of imaging and laboratory results.12,16 Even though diagnostic imaging TAT is well-studied globally,17,18 the value of medical imaging in low- and middle-income countries (LMICs) is still limited, 19 and such studies on the CT scan TAT remain scarce within the Palestinian healthcare system. Moreover, a previous study revealed that better infrastructure, resources, and technological advancement in developed countries explain the lower TAT in pathology departments compared to developing countries, which in turn helped to achieve better health care outcomes in developed countries compared to developing countries. 20 Palestinian hospitals face distinct operational challenges and resource limitations, and there is lack of studies exemining CT scan TAT or its influencing factors within Palestinian hospitals. This study addresses that gap by evaluating CT TAT and its determinants, offering practical insights to help healthcare institutions manage rising diagnostic demand while ensuring timely and accurate care, ultimately enhancing service quality and patient outcomes.
2. Methods
2.1. Study design and sampling method
A cross-sectional retrospective study was conducted on all CT scan examinations performed between July 1 and December 31, 2023, at three Palestinian hospitals: Ibn Sina Specialized Hospital (ISH), Specialized Arab Hospital (SAH), and Istishari Arab Hospital (IAH). These hospitals were selected because they are adopting a similar electronic recording system protocol; the medical records are stored in the Enterprise Resource Planning (ERP) system. These records are connected to the HIS, which is used in selected hospitals and accessed through the quality departments at the above-mentioned hospitals. It is worth noting that the electronic recording system is not available at all hospitals in Palestine. Thus, hospitals were selected based on whether they have the electronic recording system protocol or not. This selection criterion ensured the consistency and accuracy of the data collected for this study. All three hospitals are equipped with 128-slice Philips CT scanners, manufactured in 2015, 2021, and 2022, respectively. A convenience non-probability sampling method was applied. A total of 8,220 CT scans were included: 2,479 from ISH, 3,420 from IAH, and 2,321 from SAH. Records from other departments and CT scans outside the study period were excluded.
2.2. Ethical consideration
All aspects of the study protocol were authorized by the Institutional Review Board (IRB) at the Arab American University of Palestine (AAUP), Jenin, Palestine (Ref: R-2024/A/48/N). The institutional research committee’s ethical guidelines were followed in all the study procedures. The study was also approved by the hospitals’ respective ethics committees. Thus, hospitals’ records were accessed to obtain the required data, and written informed consent for each CT scan was exempted by the IRB as it was not applicable for retrospective data. All data were used anonymously, data confidentiality was maintained throughout the study, and the data were used only to achieve the aims of the study.
2.3. Data collection
Following the official approval, data from the medical records stored in the Enterprise Resource Planning (ERP) system were collected. The collected data includes the following parameters: time of CT scan order, time of CT scan acceptance, time of the CT scan final report, order status, encounter type, the ordering day and time, and whether CT scans were with or without contrast media. Then, the order-to-accept TAT, the accept-to-result TAT, and the order-to-result TAT were calculated in minutes. The encounter type refers to the department ordering the CT scans and was divided into inpatient, outpatient, and emergency. The ordering day was divided into weekdays and weekends; the ordering time was divided into A shift (from 8:00 am to 3:00 pm), B shift (from 3:00 pm to 10:00 pm), and C shift (from 10:00 pm to 8:00 am).
2.4. Statistical analysis
Data were analyzed using Statistical Package for the Social Sciences version 21 (SPSS 21) by IBM Corp., Armonk, N.Y., USA. Descriptive statistics were used to report the TAT mean, standard deviation, median, and quartiles. The sample was tested for normality using the Kolmogorov-Smirnov test, and it was non-normally distributed. Thus, non-parametric tests were used to determine the association of the TATs of the CT scans with the working day, working shift, the CT scan encounter type, and the use of contrast media. The Kruskal-Wallis test was used to determine the association between the TATs and the trimeric variables. The Mann-Whitney U test was used to determine the association between TATs and the dimeric variables. Variables that were significant in the Kruskal-Wallis test were introduced into Dunn’s post hoc test. A p-value of less than 0.05 was considered statistically significant.
3. Results
3.1. Descriptive statistics of the order-to-accept TAT, accept-to-result TAT, and order-to-result TAT of CT scans
Descriptive statistics of the order-to-accept TAT, accept-to-result TAT, and order-to-result TAT of CT scans.

SD = Standard Deviation; IQR = Interquartile Range; Q1 = First Quartile; Q3 = Third Quartile; Min = Minutes.
3.2. Variation in the order-to-accept TAT based on the predictors
The order-to-accept TAT was significantly associated with the working shift and the encounter type in the total sample and individual hospitals (p-value < 0.001). Among 8220 CT scans, a significantly shorter order-to-accept TAT was found in the B shift, followed by the A shift, with the longest in the C shift. Regarding the encounter type in the total sample, a significantly lower order-to-accept TAT was found for outpatient CT scans, while emergency and inpatient scans showed progressively longer times.
Regarding the CT scans from ISH, a significantly longer order-to-accept TAT was in the C shift compared with the A and B shifts; however, there was no significant difference between the A and B shifts. Similar to the pattern observed for the total sample, the order-to-accept TAT for CT scans from ISH was significantly shorter for outpatient CT scans, followed by emergency and inpatient progressively. For the CT scans from IAH, the order-to-accept TAT was significantly lower in the B shift, followed by the A and C shifts progressively, and it was significantly lower for outpatient CT scans compared with emergency and inpatient CT scans. There was no significant difference between the emergency and inpatient CT scans. For CT scans from SAH, the order-to-accept TAT was significantly lower in the B shift, followed by the A and C shifts progressively. Moreover, a significantly lower order-to-accept TAT was found for outpatient CT scans, while it was sequentially longer for emergency and inpatient scans.
Variations in the order-to-accept TAT based on the predictors.

aPredictors for which the p-value is calculated using the Mann-Whitney U test.
bPredictors for which the p-value is calculated using the Kruskal-Wallis test.
Superscripts (a,b, and c) correspond to the results of Dunn’s post hoc test.
Min: minutes.
3.3. Variation in the accept-to-result TAT based on the predictors
The accept-to-result TAT is significantly associated with the CT scan encounter type in the total sample as well as in the ISH and IAH (p-value < 0.001). The accept-to-result TAT of outpatient CT scans was significantly higher than that encountered as inpatient or emergency in the total sample, and in the ISH and the IAH. On the other hand, the accept-to-result TAT of CT scans from SAH showed no significant variation based on the encounter type.
In addition, the accept-to-result TAT of CT scans was significantly influenced by the working shift in the total sample, the IAH, and the SAH, but not in the ISH. For the total sample, the accept-to-result TAT of CT scans from B shift was significantly higher than that from A shift. The accept-to-result TAT of CT scans varied inconsistently by shift across hospitals. It was significantly higher in the C shift compared to the A shift at the SAH. At IAH, B shift showed higher TAT than A and C shifts, with no significant difference between A and C shifts. However, no significant shift-based variation was observed in ISH.
Variation in the accept-to-result TAT based on the predictors.

aPredictors for which the p-value is calculated using the Mann-Whitney U test.
bPredictors for which the p-value is calculated using the Kruskal-Wallis test.
Superscripts (a, b, and c) correspond to the results of Dunn’s post hoc test.
Min: minutes.
3.4. Variation in the order-to-result TAT based on the predictors
The order-to-result TAT in minutes is significantly associated with the working shift and the encounter type in the total sample and individual hospitals (p-value < 0.05). For the 8220 CT scans, a significantly higher order-to-result TAT was found for the CT scans from the C shift compared with that from the A and B shifts; however, no significant difference was observed between the A and B shifts. Regarding the encounter type for the total sample, a significantly lower order-to-result TAT was found for emergency CT scans compared with outpatient CT scans.
Regarding the CT scans from ISH, the order-to-result TAT was significantly lower in the B shift, and higher sequentially in the A and C shifts. Similar to the pattern observed for the total sample, a significantly lower order-to-result TAT was found for emergency CT scans compared with outpatient CT scans. For the CT scans from IAH, the order-to-result TAT was significantly lower in the A shift and significantly higher in the B and C shifts sequentially. The order-to-result TAT was significantly lower for inpatient CT scans compared with outpatient CT scans. For CT scans from SAH, a significantly higher order-to-result TAT was found in the CT scans from the C shift compared with that from the A and B shifts. However, no significant difference was observed between CT scans from the A and B shifts. Moreover, no significant difference in the order-to-result TAT was found in the CT scan based on the encounter types.
Variation in the order-to-result TAT based on the predictors.
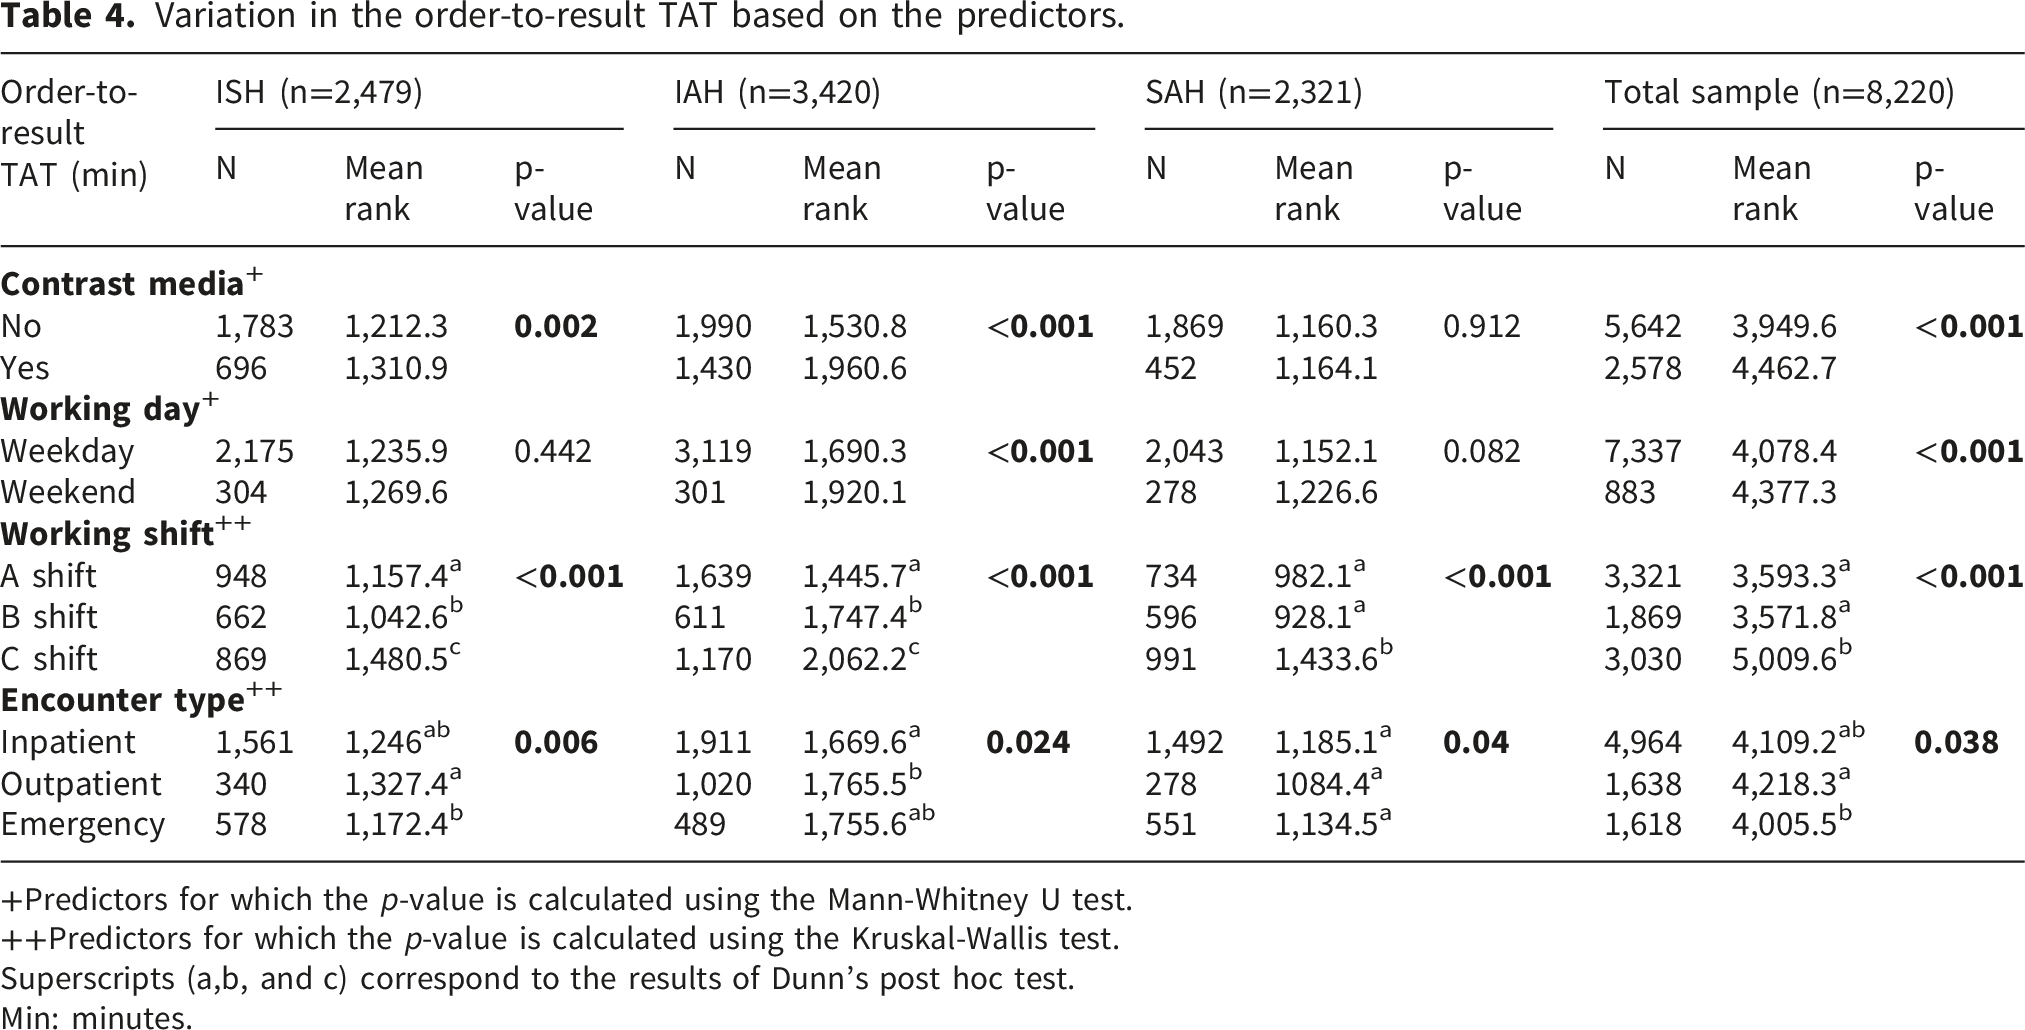
+Predictors for which the p-value is calculated using the Mann-Whitney U test.
++Predictors for which the p-value is calculated using the Kruskal-Wallis test.
Superscripts (a,b, and c) correspond to the results of Dunn’s post hoc test.
Min: minutes.
4. Discussion
This study provides an evaluation of TAT in CT scans across three Palestinian hospitals, offering leading insights into diagnostic workflow performance in a resource-constrained healthcare setting. The findings reveal substantial variability in TATs influenced by operational factors such as working shifts, scan days, encounter types, and contrast media use.
The study revealed that CT scans from the C shift had the longest order-to-result TAT and order-to-accept TAT, while the B shift exhibited a longer accept-to-result TAT. These disparities can be attributed to variations in staffing levels across shifts. During night shifts, the limited number of radiographers often necessitates prioritization of urgent and emergency cases, which in turn prolongs turnaround times for stable, non-urgent patients. Palestinian hospitals generally employ fewer radiographers during the B and C shifts compared to the A shift. 21 Moreover, the absence of essential personnel such as the radiology department secretary, nurse, and head technician during B and C shifts further exacerbates these delays. These findings are consistent with a previous study showing that imaging technologist variability, time of day, and day of the week played a significant role in CT trauma TAT variability. 22 Studies on employee outcomes revealed that night shift work is significantly linked to fatigue, poorer mental health, and job dissatisfaction. Patient outcomes also decline during weekends and night shifts compared to daytime hours. 23 These findings suggest that adequate staffing and resources have to be matched with the needs during all shifts to improve productivity and patient care. 24
Outpatient CT scans showed shorter order-to-accept TATs compared with emergency or inpatient cases. This difference is likely due to direct radiology access, whereby outpatients can proceed directly to imaging without multiple referral or approval steps, and expedited registration and financial processes, as private insurance holders and cash-pay patients typically experience streamlined clearance. In contrast, delays related to insurance authorization, governmental coverage, and unexpected financial burdens contribute to longer TATs for inpatients and emergency cases. Streamlined administrative systems can reduce processing time and accelerate imaging workflows. 25 Emergency patients often receive scheduling priority for CT imaging to prevent ED overcrowding, resulting in a shorter order-to-accept TAT than inpatients. Furthermore, emergency cases may face transfer challenges due to mobility restrictions or the need for anesthesia and monitoring.
Compared to CT scans without contrast media, the order-to-result TAT for CT scans with contrast media was higher. This is partially due to the lower financial cost of scans without contrast, which can expedite the financial authorization process, and the lower scheduling period because scans with contrast require contrast administration preparations and prior kidney function tests. Moreover, scans with contrast require several pre-scan instructions to ensure the safety and effectiveness of the outcomes. CT scans with IV contrast require more time for patient preparation, including a more detailed medical history of the patient concerning previous allergic reactions. Patients are also provided with specific instructions to familiarize them with the sensations associated with IV contrast administration. 26 These preliminary variations between the CT scans with and without contrast media, in addition to the prolonged scan process and the possibility for scans with delays explain the significantly higher TATs for CT scan with contrast media.
The transfer time of the CT scan with contrast media to the Picture Archiving and Communication System (PACS) is also longer since image files are generally larger, and their interpretation is more time-consuming. 27 Similar findings were also identified by previous studies in which the IV line issues, such as infiltration, difficult access, inadequate size, contrast allergies, and the need for contrast administration, were revealed as common contributors to delays in CT scans. 28
Previous studies reported that ED length of stay (LOS) was reduced by about two hours for patients receiving IV contrast alone compared to those given both IV and oral contrast. Patients undergoing non-contrast CT scans had an estimated four-hour shorter LOS than those receiving oral contrast.29,30
Healthcare quality could also vary by day of the week, with CT scan TATs being significantly longer on weekends than on weekdays. This delay is largely due to reduced staffing on weekends. Prior studies similarly link weekend staffing shortages to lower care quality and increased preventable complications. 31 Service delays have also been linked to prolonged registration at the accounting department, due to limited staff and the absence of an internal accountant on weekends. Ensuring adequate staffing and offering incentives for weekend procedures may help maintain healthcare quality.32,33 In the current study, the accept-to-result TAT in ISH and the order-to-result TAT in both ISH and SAH did not vary significantly across working days. This finding suggests that these hospitals maintain a standardized workflow and staffing pattern, with radiology departments operating under consistent resources and protocols throughout the week.
TAT is a quality indicator that reflects the hospital’s effectiveness and testing efficiency and is associated with the satisfaction of clinicians and patients. 34 Studies showed that optimizing TAT in hospitals decreases the waiting time of patients, and this is associated with greater patient satisfaction. 35 According to the current study findings, the implementation of standardized protocols governing CT scan ordering, acceptance, execution, and reporting is recommended. Aligning scan demand with workforce capacity, particularly the availability of radiologists, radiotechnologists, nurses, and CT equipment, is essential for optimizing departmental productivity. Additionally, targeted training on contrast media administration and patient preparation may reduce procedure-related delays.
Integrating technological solutions such as automated scheduling and real-time order tracking can further streamline workflow and enhance interdepartmental communication. A recent quality improvement study in Oman revealed that structured workflow modifications, automation, and interdepartmental collaboration significantly enhance TAT and operational efficiency in radiology services, providing insights into sustainable healthcare improvements. 36 Establishing a continuous quality improvement framework within radiology departments will support ongoing monitoring of TAT and facilitate evidence-based interventions. Finally, future studies should delve deeper into the long-term implications of these delays to fully understand the impact of TAT on patient outcomes. Longitudinal studies examining the connection between TAT and clinical outcomes could provide valuable information for improving imaging processes.
This study was conducted in private, non-governmental hospitals in Palestine, which may limit the generalizability of findings to other healthcare systems. However, the results provide useful benchmarks for assessing CT TATs in comparable contexts. Future studies should expand to include hospitals with different recording systems and workflows, as well as other diagnostic modalities such as X-ray and magnetic resonance imaging (MRI), to further improve the quality of radiology services. Such research is particularly important in Palestine, a conflict-affected zone where radiology departments often face extreme pressures during escalations, making efficiency and resilience in diagnostic services critical. Differences in technological infrastructure may affect the applicability of workflow improvements, and key confounders, such as staff competency and workload distribution, were excluded due to documentation constraints and standardization challenges across institutions. Future prospective studies should incorporate structured training courses to assess the impact of staff competency on CT turnaround times. Lastly, a sample size calculation was not performed in the current study, as the study included all CT scans conducted during the specified six-month period in the selected hospitals. While this ensured comprehensive coverage of available data, it represents a limitation.
5. Conclusion
The TAT in CT scans is a key indicator of diagnostic efficiency and healthcare service quality. TAT is significantly influenced by operational variables, including shift timing, day of the week, encounter type, and the use of contrast media. In general, CT scans performed during night shifts, weekends, or involving contrast agents consistently exhibited longer processing times. By evaluating the TAT periods, the order-to-accept TAT was constantly variable based on the encounter type and working shift, being higher for night shift CT scans, and for CT scans encountered as inpatient or emergency. The accept-to-result TAT was higher for CT scans with contrast media, those performed in weekend, and for outpatient CT scans. Overall, the total order-to-result TAT was prolonged for scans with contrast media, those performed on weekends, and during night shifts, while emergency cases showed shorter total TATs compared with outpatients. Therefore, hospital quality control departments should implement strategies to assess TATs across departments and identify key influencing factors. These strategies should guide staffing levels and distribution to align with service demands, thereby enhancing healthcare delivery efficiency.
Footnotes
Acknowledgments
Ethical considerations
All aspects of the study protocol were authorized by the Institutional Review Board (IRB) at the Arab American University of Palestine (AAUP), Jenin, Palestine (Ref: R-2024/A/48/N). The institutional research committee’s ethical guidelines were followed in all the study procedures.
Consent to participate
The study was approved by the respective hospital ethics committees for access to patient data. As this was a retrospective study, obtaining individual informed consent was not required and therefore not applicable. All data were anonymized, confidentiality was strictly maintained throughout, and information was used solely to achieve the objectives of the study.
Author contributions
SR: Conceptualization, data collection, and manuscript writing, review, and editing. AAA: Conceptualization, supervision, and manuscript writing, review, and editing. MR: Conceptualization, statistical analysis, and manuscript writing, review, and editing.
Funding
The authors received no financial support for the research, authorship, and/or publication of this article.
Declaration of conflicting interests
The authors declared no potential conflicts of interest with respect to the research, authorship, and/or publication of this article.
Data Availability Statement
All data are available upon request from the corresponding author.