
Abstract
Objective:
To develop and validate a parsimonious and clinically applicable nomogram for predicting 28-day mortality in patients with bacterial pneumonia complicated by sepsis and acute kidney injury using data from the Medical Information Mart for Intensive Care-IV database.
Methods:
A total of 470 eligible patients were enrolled and randomly assigned to a derivation cohort (n = 330) and a validation cohort (n = 140). Candidate predictors were screened using least absolute shrinkage and selection operator regression with the λ.1se criterion, followed by multivariable logistic regression to construct the final model. Model performance was assessed in both cohorts using discrimination (area under the receiver operating characteristic curve), calibration plots, calibration statistics, and decision curve analysis. A nomogram was developed based on the final predictors.
Results:
Least absolute shrinkage and selection operator regression identified three independent predictors—age, Sequential Organ Failure Assessment score, and urine output—which were incorporated into the final nomogram. The model demonstrated good discrimination in the derivation cohort (area under the receiver operating characteristic curve = 0.802; 95% confidence interval: 0.750–0.853) and validation cohort (area under the receiver operating characteristic curve = 0.803; 95% confidence interval: 0.721–0.885). Calibration curves and corresponding intercept and slope values indicated satisfactory agreement between predicted and observed mortality risks in both cohorts. Decision curve analysis showed that the nomogram yielded higher net clinical benefit compared with Sequential Organ Failure Assessment alone across a wide range of threshold probabilities.
Conclusion:
The nomogram integrating age, Sequential Organ Failure Assessment score, and urine output provides accurate and clinically meaningful prediction of 28-day mortality among patients with bacterial pneumonia complicated by sepsis and acute kidney injury. This tool may facilitate early risk stratification and guide individualized clinical decision-making in the intensive care unit setting.
Introduction
Bacterial pneumonia is an infection primarily caused by pathogens such as Streptococcus pneumoniae, Staphylococcus aureus, and Escherichia coli, which can trigger severe localized and systemic inflammatory responses. Although antibiotics are generally effective against most causative bacteria, their misuse, inappropriate administration, and the emergence of multidrug-resistant organisms contribute to a significantly higher mortality rate in pneumonia patients compared with those affected by bacterial infections of the urinary or gastrointestinal tracts. 1 Pneumonia remains the leading cause of hospitalization and death worldwide. 2 Lung infections account for ~2.18 million global deaths annually, predominantly affecting individuals older than 70 years, with mortality risk increasing progressively with age.3,4 Furthermore, the presence of comorbidities such as kidney disease, diabetes, and cardiac insufficiency substantially elevates mortality risk. 5
S. pneumoniae remains the most frequently isolated pathogen in elderly patients; however, recent epidemiologic trends indicate a decline in its incidence, while the prevalence of the highly virulent Klebsiella pneumoniae is rising. 1 Pneumonia is the leading cause of sepsis, which in turn represents the primary contributor to acute kidney injury (AKI) in critically ill patients.6,7 The recurrent nature of pneumonia, combined with the growing burden of drug-resistant pathogens—many exhibiting high virulence—has led to an increased incidence of both sepsis and AKI. Consequently, these complications markedly worsen clinical outcomes and prognosis.8,9
Nomogram models are widely used in the study of cardiopulmonary and renal diseases.10,11 However, relatively few studies have focused on short-term mortality prediction in patients with bacterial pneumonia complicated by sepsis and AKI. Building on this background, the present study analyzed data from 470 patients with bacterial pneumonia complicated by sepsis and AKI extracted from the Medical Information Mart for Intensive Care-IV (MIMIC-IV) database. Variable selection was initially performed using least absolute shrinkage and selection operator (LASSO) regression, followed by refinement through multivariable logistic regression, ultimately yielding a nomogram for predicting 28-day mortality risk. The objective was to establish a visual risk assessment tool with strong discrimination, calibration, and clinical utility to support early identification of high-risk patients and inform individualized treatment strategies in intensive care settings.
Materials and methods
Data source and ethical approval
This retrospective cohort study utilized the publicly available MIMIC-IV database, version 3.1, which contains de-identified clinical data from patients (2008–2019) admitted to the intensive care units (ICUs) of Beth Israel Deaconess Medical Center (BIDMC). The creation of and access to MIMIC-IV were approved by the institutional review boards of the Massachusetts Institute of Technology and BIDMC. For this analysis, we completed the required Collaborative Institutional Training Initiative (CITI) online training and signed the data use agreement. Data extraction was conducted by Peng Xue, a certified CITI user (certification no. 62432248). Given that all data are fully de-identified, the requirement for additional institutional review board approval and written informed consent was waived.
Study population
Eligible participants were adult patients (⩾18 years) diagnosed with bacterial pneumonia complicated by sepsis and AKI. We first identified ICU admissions associated with bacterial pneumonia using International Classification of Diseases (ICD) codes. Bacterial pneumonia was identified using ICD-10-CM codes J13, J14, J15.0, J15.1, J15.2, J15.20, J15.21, J15.211, J15.212, J15.29, J15.3, J15.4, J15.5, and J15.9. Patients with any ICD code indicating malignant neoplasms were excluded. In cases of multiple ICU admissions per patient, only the first ICU stay was retained to avoid duplicate observations. After applying all eligibility criteria and addressing missing data (described below), 470 unique patients were included in the final analysis. The study period corresponded to the time frame of adult ICU admissions recorded in MIMIC-IV (2008–2019).
Definitions of sepsis, AKI, and sepsis-associated AKI
Sepsis was defined according to the Sepsis-3 criteria as the presence of documented or suspected infection accompanied by an acute increase in the Sequential Organ Failure Assessment (SOFA) score of ⩾2 points. 12 SOFA scores were calculated using the worst values recorded within the first 24 h after ICU admission. AKI was defined in accordance with the 2012 Kidney Disease: Improving Global Outcomes (KDIGO) guidelines. 13 AKI was diagnosed if any of the following criteria were met: (1) an increase in serum creatinine (Scr) by ⩾0.3 mg/dL within 48 h; (2) an increase in Scr to ⩾1.5 times the baseline value within 7 days; or (3) urine output <0.5 mL/kg/h for at least six consecutive hours. When a prior baseline Scr value was available, the most recent measurement within 7–365 days before admission was used; otherwise, baseline Scr was estimated by back-calculation assuming an estimated glomerular filtration rate of 75 mL/min/1.73 m2, consistent with established epidemiologic approaches.
Sepsis-associated AKI was defined per the 28th Acute Disease Quality Initiative consensus as AKI occurring in the context of sepsis, either directly attributable to the septic insult or indirectly related to sepsis or its management.
Data collection and predictor variables
For each eligible ICU stay, we extracted baseline demographic and clinical characteristics, vital signs, laboratory parameters, organ support requirements, and urine output from the MIMIC-IV database tables.
Demographic variables included age, sex, smoking status, and histories of hypertension and diabetes. Vital signs were defined as the first recorded measurements within the first 24 h after ICU admission and comprised heart rate, respiratory rate, systolic and diastolic blood pressure, body temperature, and peripheral oxygen saturation. Arterial blood gas variables included partial pressure of oxygen (PaO2), partial pressure of carbon dioxide, and the PaO2/FiO2 ratio.
Laboratory variables were obtained as the first available measurement within the first 24 h and included lactate, white blood cell count, platelet count, albumin, blood urea nitrogen, Scr, alanine aminotransferase, aspartate aminotransferase, total bilirubin, serum sodium, and hemoglobin. The SOFA score was calculated using standard definitions based on the worst values observed during the same 24-h window.
Fluid-related variables included cumulative urine output during the first 48 h of ICU stay. The primary outcome was 28-day all-cause mortality, determined from in-hospital records and post-discharge follow-up data in MIMIC-IV.
Handling of missing data
Given the inherent presence of missing data in large ICU databases, we first excluded patients with more than 20% missing values among key candidate variables to ensure data quality. For the remaining patients, variables with <20% missingness were imputed using Multivariate Imputation by Chained Equations implemented in the *mice* package in R (version 4.4.1; R Foundation for Statistical Computing, Vienna, Austria). A single imputed dataset was generated and used for subsequent model development and validation. The reliance on a single imputed dataset is acknowledged as a limitation and is addressed in the discussion.
Model development and internal validation
The final cohort was randomly partitioned into a derivation cohort (70%, n = 330) and an independent validation cohort (30%, n = 140), with stratification by 28-day mortality status to preserve comparable event rates across subsets.
Candidate predictors were initially entered into a LASSO logistic regression model. Ten-fold cross-validation was employed, and the penalty parameter λ was selected using the λ.1se criterion to favor model parsimony. Predictors with non-zero coefficients at λ.1se were then included in a standard multivariable logistic regression model to estimate regression coefficients and construct the final prediction model. No additional p-value-based variable elimination was performed to avoid double data-driven selection. The resulting model was presented as a nomogram for clinical application.
Assessment of model performance
Model performance was evaluated in both the derivation and validation cohorts. Discrimination was assessed using receiver operating characteristic (ROC) curves and the area under the ROC curve (AUC) with 95% confidence intervals (CIs), computed via the pROC package. Where appropriate, AUCs of alternative models (SOFA alone, age + SOFA, and age + SOFA + urine output) were compared using DeLong’s test.
Calibration was evaluated graphically using LOESS-smoothed calibration plots and quantitatively by estimating the calibration intercept and slope from a logistic recalibration model, along with the Brier score as a measure of overall prediction error.
Clinical utility was assessed using decision curve analysis (DCA) to quantify the standardized net benefit of the final nomogram relative to SOFA alone across a range of clinically relevant threshold probabilities.
Software
All data processing, imputation, model development, and statistical analyses were conducted in R version 4.4.1 (R Foundation for Statistical Computing). Key packages used included tidyverse, skimr, mice, glmnet, rms, pROC, rmda, and ggplot2.
Results
Patient selection and baseline characteristics
The patient selection process is illustrated in Figure 1. A total of 470 eligible patients were ultimately included from the MIMIC-IV database. Using a 7:3 random allocation ratio, 330 patients were assigned to the derivation cohort and 140 to the validation cohort. Table 1 summarizes the baseline clinical characteristics of the included patients.

Flowchart of patient selection from the MIMIC-IV database.
Baseline characteristics of the study population.
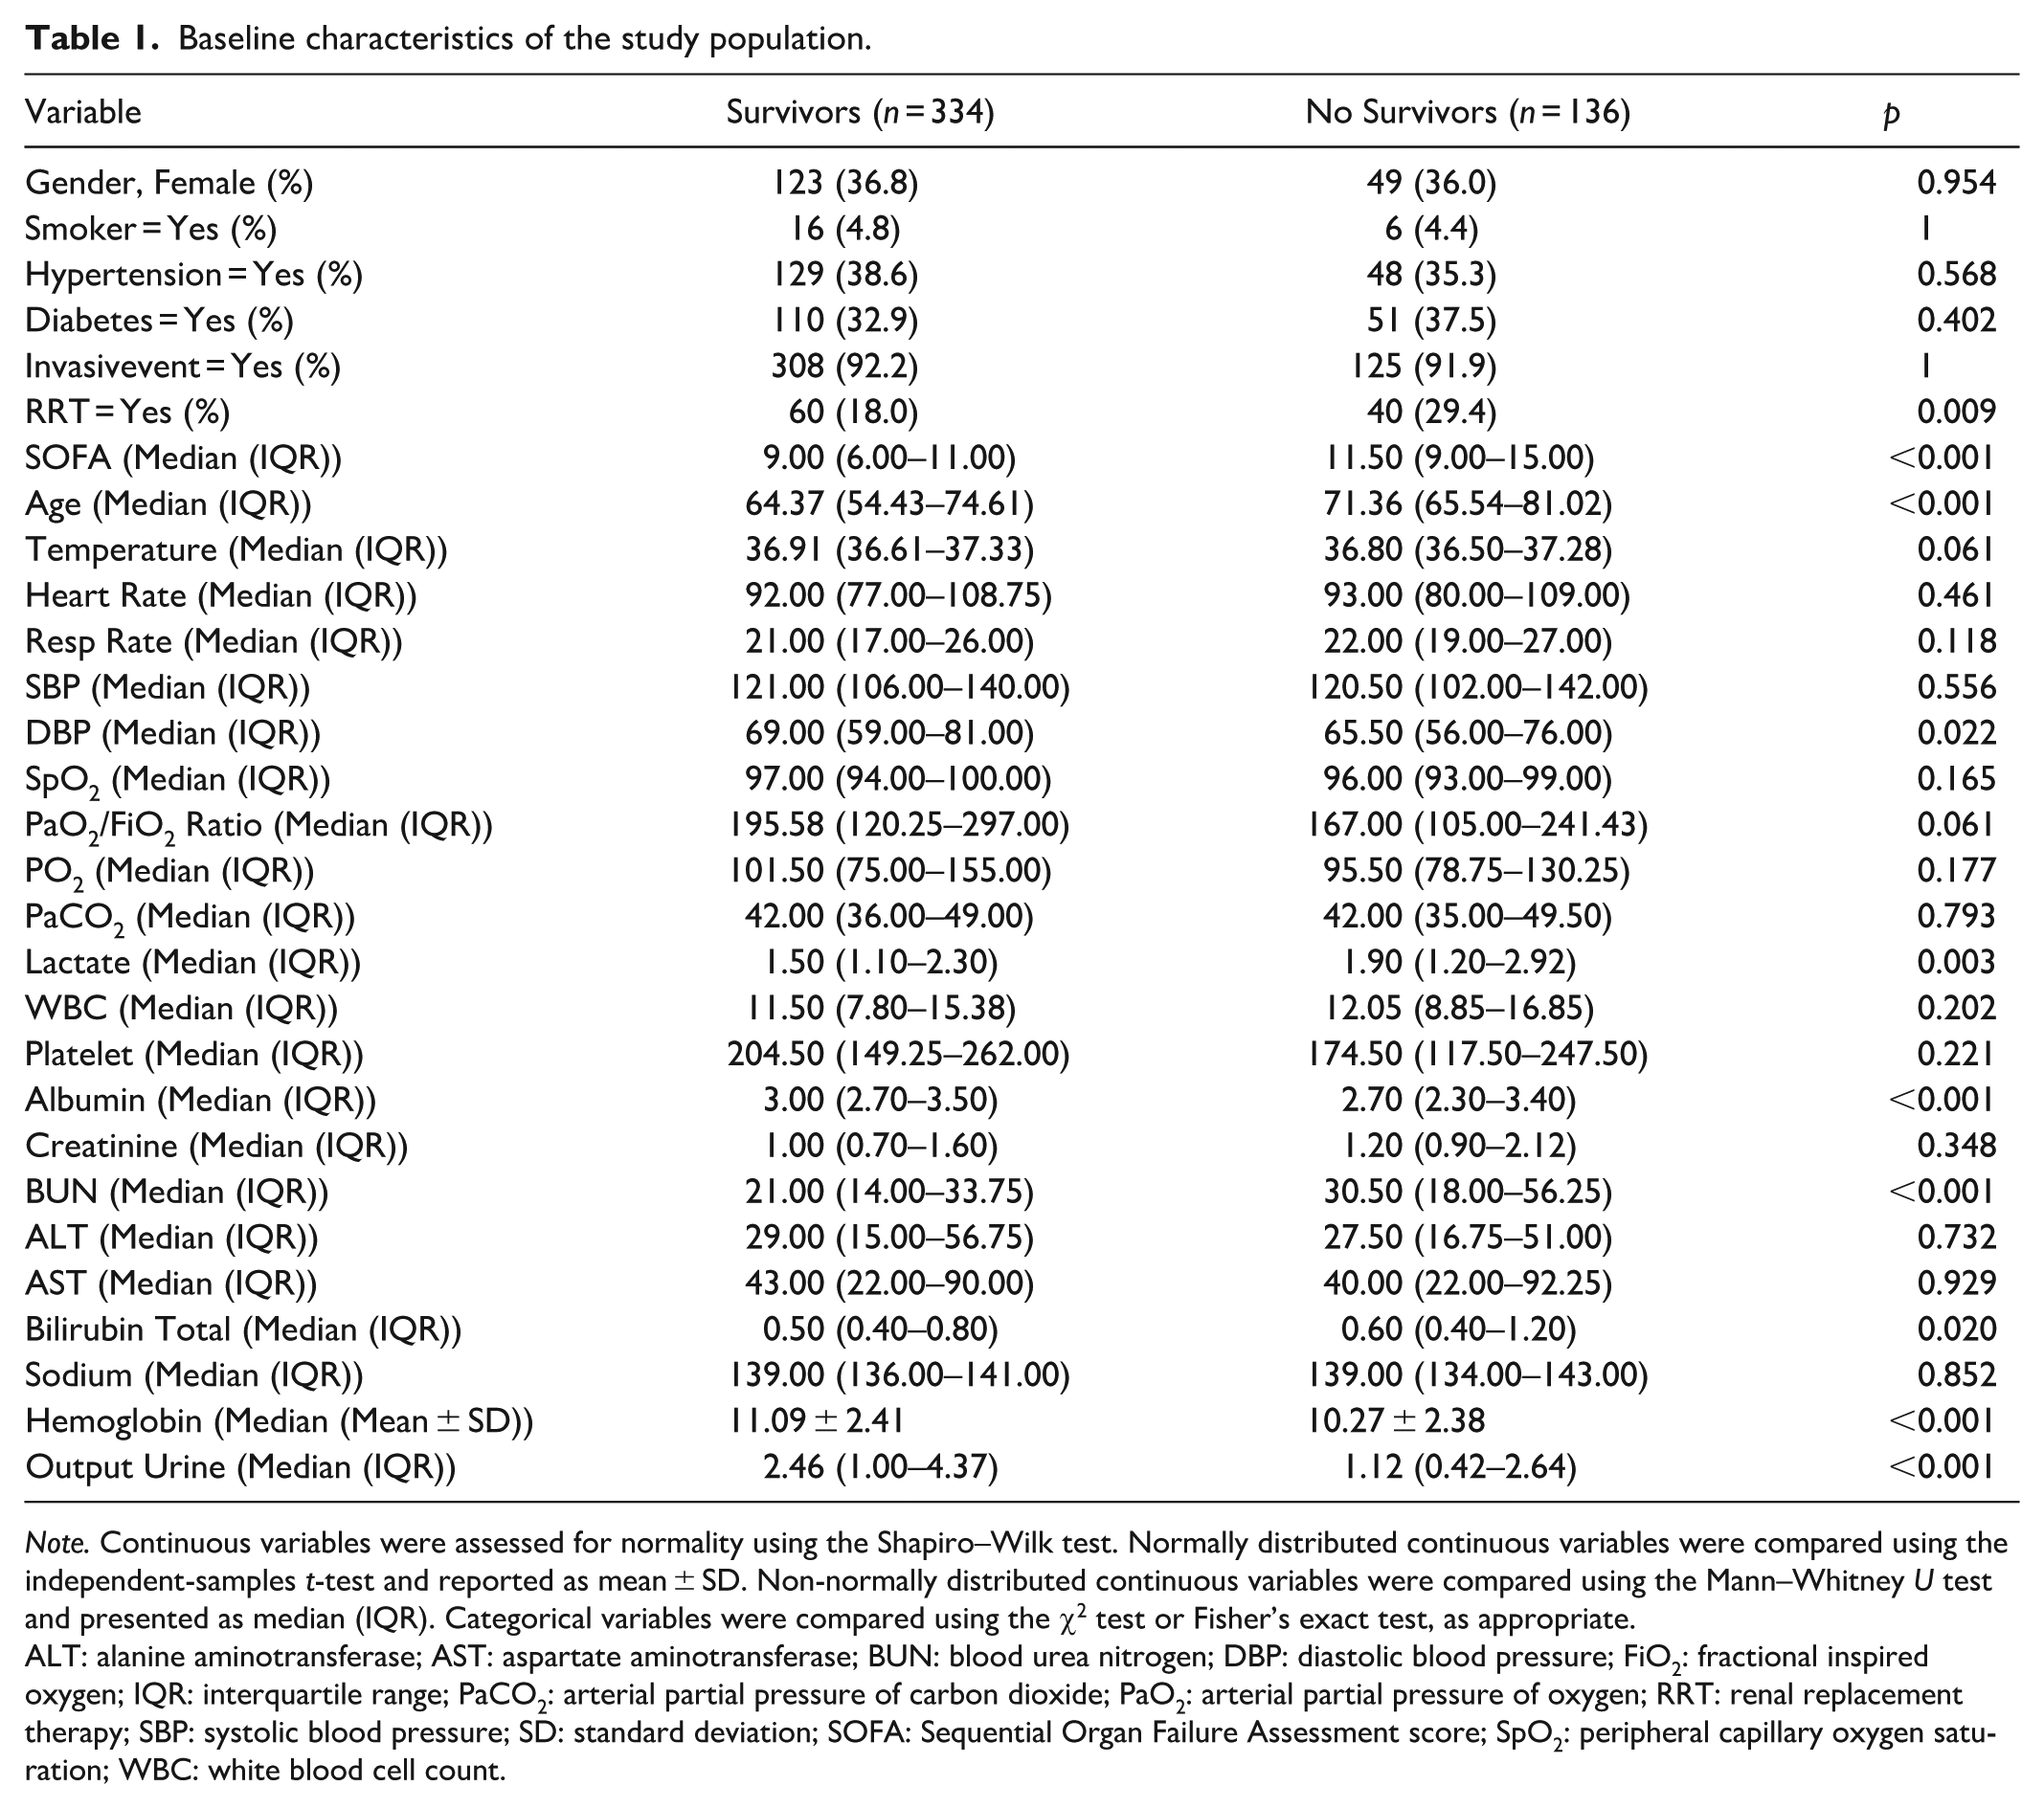
Note. Continuous variables were assessed for normality using the Shapiro–Wilk test. Normally distributed continuous variables were compared using the independent-samples t-test and reported as mean ± SD. Non-normally distributed continuous variables were compared using the Mann–Whitney U test and presented as median (IQR). Categorical variables were compared using the χ2 test or Fisher’s exact test, as appropriate.
ALT: alanine aminotransferase; AST: aspartate aminotransferase; BUN: blood urea nitrogen; DBP: diastolic blood pressure; FiO2: fractional inspired oxygen; IQR: interquartile range; PaCO2: arterial partial pressure of carbon dioxide; PaO2: arterial partial pressure of oxygen; RRT: renal replacement therapy; SBP: systolic blood pressure; SD: standard deviation; SOFA: Sequential Organ Failure Assessment score; SpO2: peripheral capillary oxygen saturation; WBC: white blood cell count.
Variable selection process
Variable selection was conducted using LASSO regression with ten-fold cross-validation to determine the optimal penalty parameter. Under the λ(1-SE) criterion, three predictors were retained for multivariable modeling and nomogramconstruction (Figures 2 and 3).

LASSO regression for predictor selection. The optimal regularization parameter was determined by 10-fold cross-validation using the λ(1-SE) criterion.
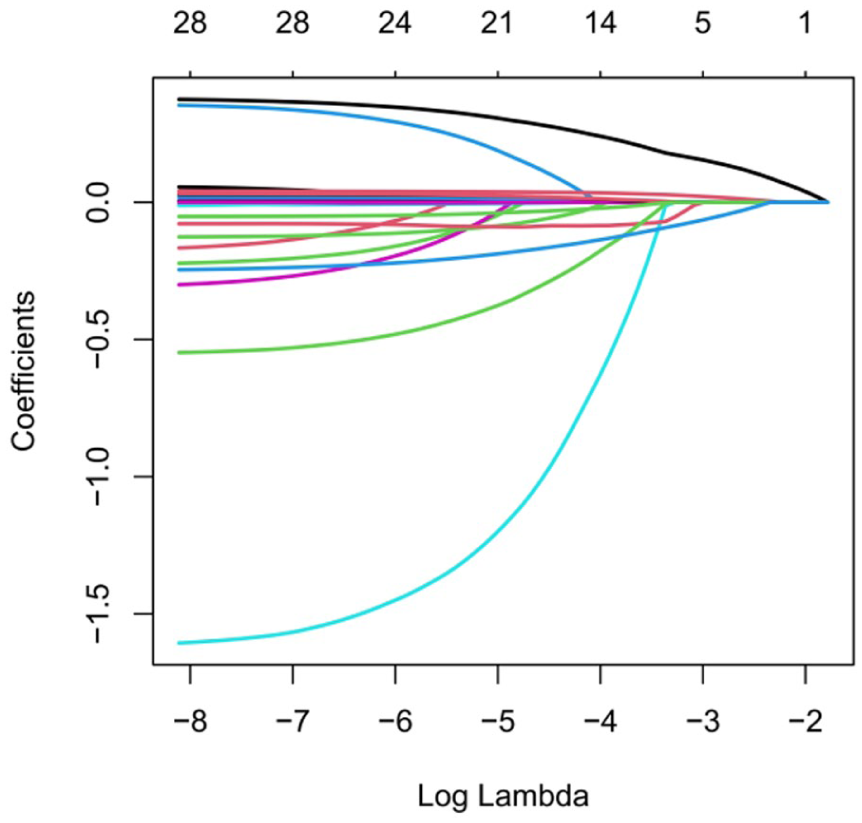
LASSO regression for predictor selection. Under λ(1-SE), the final LASSO model retained three predictors with non-zero coefficients: age, SOFA score, and urine output.
Correlation analysis of selected variables
Prior to nomogram construction, we conducted a heatmap-based correlation analysis of the variables selected by LASSO regression (Figure 4). The analysis revealed significant correlations among SOFA score, age, and clinical outcomes. Notably, thrombocytopenia was strongly associated with elevated SOFA scores, consistent with the established pathophysiology of sepsis-associated coagulopathy.

Correlation heatmap of candidate predictors and outcome. The heatmap displays pairwise correlations among candidate predictors and the outcome variable. Color intensity represents the magnitude and direction of correlation (red indicating positive correlation and blue indicating negative correlation), and numerical values within each cell correspond to the correlation coefficients.
Moreover, the negative correlation between fluid input and renal function markers supports the rationale for a restrictive fluid management strategy. Figure 5(a) and (b) visually depict intergroup differences in SOFA score and age, respectively.
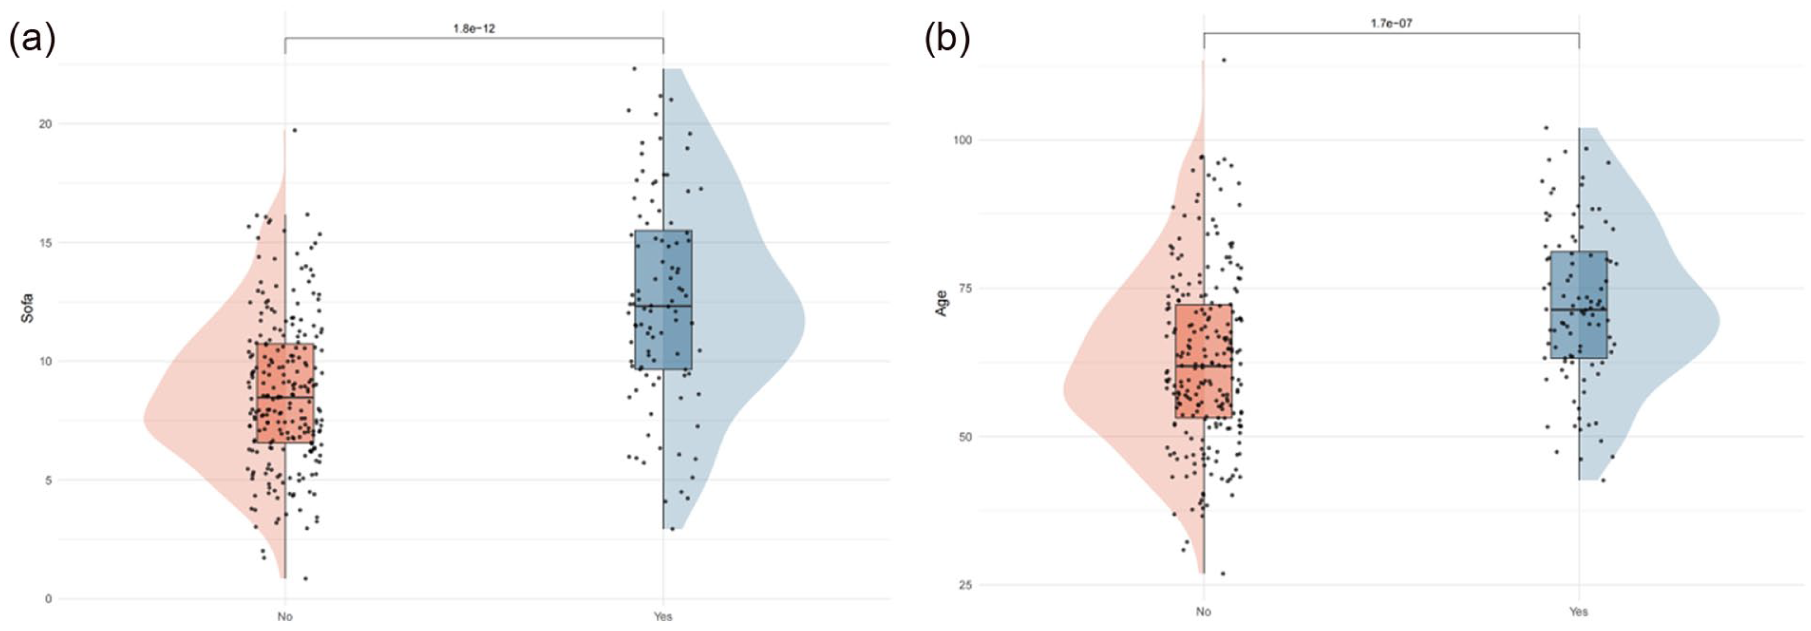
Distribution of SOFA score and age stratified by outcome: (a) violin plots with embedded boxplots and individual data points show the distribution of SOFA scores between the survivor and non-survivor groups. The non-survival group exhibited significantly higher SOFA scores compared with the survival group (p < 0.001) and (b) violin plots with embedded boxplots and individual data points illustrate the distribution of age between the survivor and non-survivor groups. Patients in the non-survival group were significantly older than those in the survival group (p < 0.001).

Nomogram (Figure 6) for predicting 28-day mortality in patients with bacterial pneumonia complicated by sepsis and AKI. The model was constructed using predictors identified exclusively through LASSO regression under the λ(1-SE) criterion. Three variables—urine output, age, and SOFA score—were incorporated as key predictors. For each variable, a point value is determined by projecting upward to the “points” axis. The total points, obtained by summing contributions from all predictors, are then projected downward onto the “predicted probability” axis to estimate the individual probability of 28-day mortality. Red dots illustrate an example patient, and the red arrow indicates the predicted risk (0.923) based on the total score. Higher total points correspond to a greater predicted likelihood of 28-day mortality.

The ROC performance of the model is presented in Figure 7. ROC curves demonstrating the discriminative performance of three predictive models—SOFA score alone, age + SOFA, and the final LASSO-selected model (age + SOFA + urine output)—in the derivation cohort. The SOFA-only model yielded an AUC of 0.687 (95% CI: 0.622–0.752). Incorporating age improved discrimination, with the age + SOFA model achieving an AUC of 0.781 (95% CI: 0.727–0.834). The final model, which included urine output, demonstrated the highest discriminative ability, with an AUC of 0.802 (95% CI: 0.750–0.853). These results indicate that the sequential addition of age and urine output incrementally enhances predictive accuracy beyond the SOFA score alone. ROC curves evaluating external discrimination of the three models in the validation cohort—The SOFA-only model achieved an AUC of 0.733 (95% CI: 0.632–0.834). The addition of age improved performance, with the age + SOFA model reaching an AUC of 0.786 (95% CI: 0.702–0.869). The final model incorporating urine output demonstrated the strongest discrimination, with an AUC of 0.803 (95% CI: 0.721–0.885). The consistent improvement across both cohorts supports the robustness and generalizability of the LASSO-derived model.
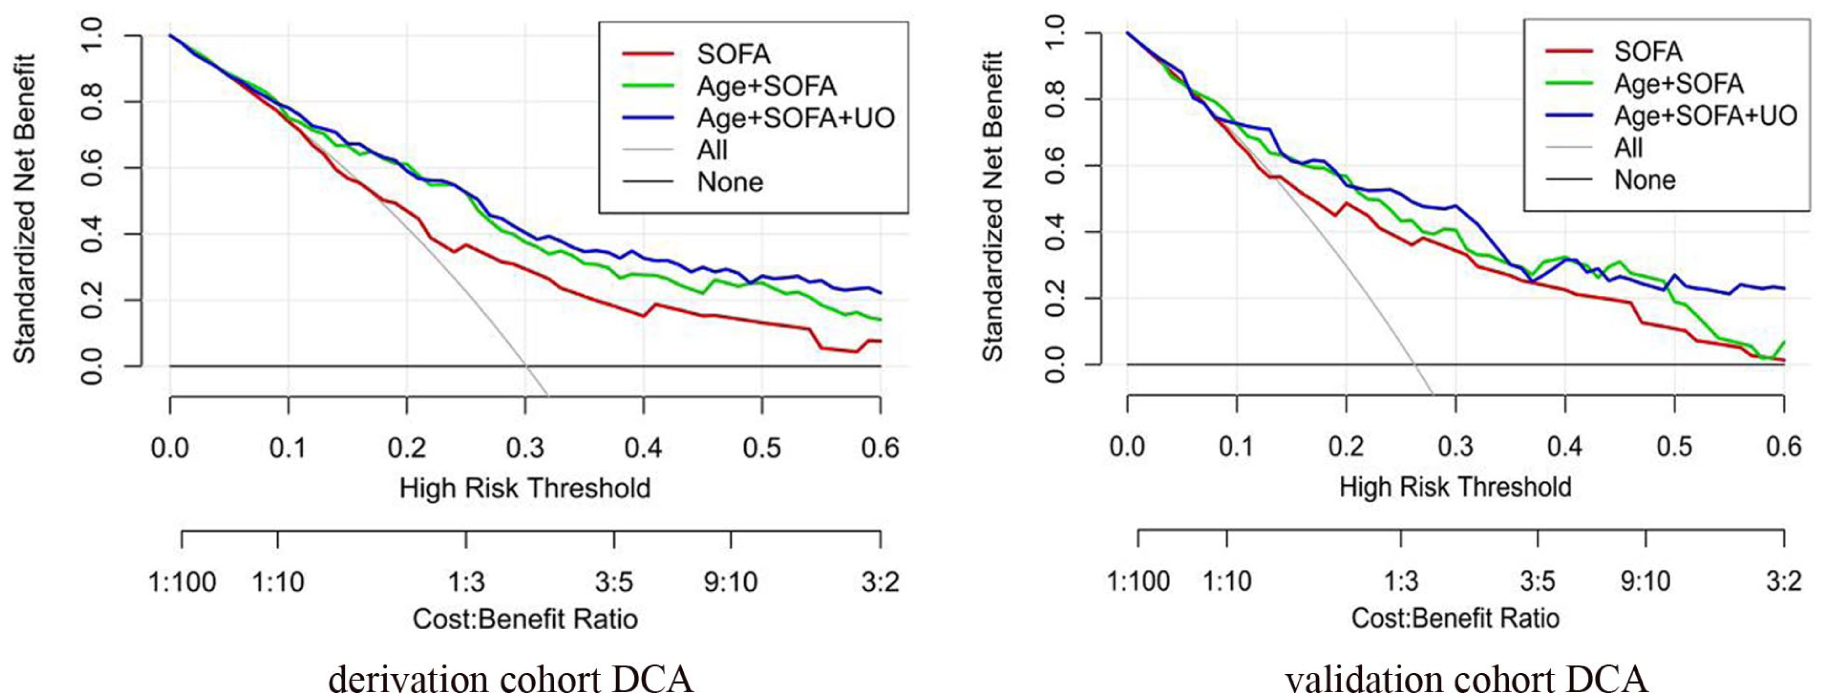
Decision curve analysis is illustrated in Figure 8. Decision curve analysis illustrating the clinical net benefit of the three predictive models—SOFA score alone, age + SOFA, and the final LASSO-selected model (age + SOFA + urine output)—in the derivation cohort. Across a wide range of clinically relevant threshold probabilities (0.05–0.60), the model incorporating urine output consistently yielded the highest standardized net benefit, surpassing both the SOFA-only and age + SOFA models. Both “treat-all” and “treat-none” strategies conferred lower net benefit than the prediction models. These findings suggest that the final model offers superior clinical utility for guiding management decisions in patients with bacterial pneumonia complicated by sepsis and AKI. Decision curve analysis evaluating the external clinical utility of the three models in the validation cohort—Consistent with the derivation cohort, the model combining age, SOFA score, and urine output achieved the highest net benefit across most threshold probabilities, outperforming both SOFA alone and age + SOFA. The reproducible advantage of the final model in the validation cohort underscores its robustness and potential applicability in real-world clinical practice.

Calibration performance is shown in Figure 9. Calibration curve for the derivation cohort—The calibration performance of the final prediction model (age + SOFA + urine output) was evaluated using logistic recalibration. The calibration intercept was −0.098, indicating minimal systematic bias in predicted probabilities. The calibration slope was 1.132, suggesting slight compression in the separation of risk between high- and low-risk individuals relative to observed outcomes. The Brier score was 0.139, reflecting good overall accuracy of probabilistic predictions. Visually, the calibration plot demonstrates close alignment between model-predicted and observed 28-day mortality rates across deciles of predicted risk, with the bootstrap-corrected curve closely approximating the ideal 45° reference line. These results indicate strong calibration and reliable predictive performance in the derivation cohort. Calibration curve for the validation cohort—External verification of calibration was performed using the independent validation dataset. The calibration intercept was 0.392, reflecting a mild tendency of the model to underestimate actual mortality risk. The calibration slope was 1.461, indicating slightly greater dispersion in observed event rates compared with predicted probabilities. The Brier score was 0.141, consistent with acceptable predictive accuracy. The calibration curve demonstrates reasonable agreement between predicted and observed mortality probabilities, although modest deviations from the idealized 45° line were noted at higher predicted-risk strata. Overall, these results confirm that the final model maintains stable calibration performance when applied to previously unseen data.
Discussion
In this retrospective cohort study based on the MIMIC-IV database, we investigated a particularly high-risk subgroup of critically ill patients—those with bacterial pneumonia complicated by sepsis and AKI. Using LASSO regression, we developed a parsimonious nomogram (Figure 6) incorporating age, SOFA score, and urine output to predict 28-day mortality. The model demonstrated robust and consistent discriminative performance in both the derivation cohort (AUC = 0.802, 95% CI: 0.750–0.853) and the validation cohort (AUC = 0.803, 95% CI: 0.721–0.885) (Figure 7), along with good calibration (Figure 9) and a clear net clinical benefit on DCA (Figure 8) when compared with SOFA score alone. These findings suggest that a simple, bedside-applicable risk prediction tool based on routinely available clinical variables can effectively stratify mortality risk in this complex patient population.
Although several prognostic studies have examined outcomes in sepsis-associated AKI or early mortality among critically ill patients, relatively few have focused specifically on bacterial pneumonia-related sepsis complicated by concurrent AKI, and comprehensive prediction models tailored to this subgroup remain limited. Commonly used severity scores such as the Acute Physiology and Chronic Health Evaluation II and SOFA score are widely implemented in ICU practice; however, these tools were not designed to fully capture the combined burden of pulmonary infection, systemic sepsis, and renal dysfunction within a single predictive framework. In the present analysis, SOFA score—as expected—remained a strong predictor of mortality. Importantly, the addition of age and urine output significantly improved predictive performance over SOFA alone across both cohorts. Age reflects baseline physiological reserve and comorbidity burden, whereas urine output represents a dynamic and sensitive marker of renal perfusion and organ dysfunction in critically ill patients, particularly in the context of sepsis-associated AKI. The integration of these three complementary dimensions—global organ failure, renal function, and intrinsic patient vulnerability—likely underlies the enhanced prognostic performance observed with our nomogram.
The pathophysiological interaction between sepsis and AKI in the setting of bacterial pneumonia has been extensively explored in experimental and clinical studies. Sepsis-induced systemic inflammation and microcirculatory dysfunction can aggravate renal ischemia and tubular injury, while the development of AKI contributes to the accumulation of nephrotoxins, immune dysregulation, and metabolic disturbances, thereby perpetuating multiorgan failure.14,15 Mechanistic investigations have highlighted the role of iron metabolism and neutrophil activity in this process. For example, Wu et al. demonstrated that reduced serum iron levels were inversely associated with the incidence of sepsis in bacterial pneumonia, whereas increased transferrin saturation combined with decreased total iron-binding capacity was linked to a higher risk of pneumonia and sepsis through neutrophil-mediated mechanisms. 16 Similarly, Tsai et al. showed that neutrophil recruitment plays a critical regulatory role in the initiation and severity of bacterial acute lung injury, particularly in Pseudomonas aeruginosa pneumonia.17,18 These findings underscore the central importance of dysregulated inflammatory and innate immune responses in pneumonia-associated sepsis and its complications.
Experimental studies further support the existence of a bidirectional lung–kidney axis in bacterial pneumonia. Singbartl et al. demonstrated that bacterial pneumonia can precipitate AKI via platelet-dependent mechanisms, while the subsequent development of AKI may increase pulmonary bacterial burden, impair oxygenation, and exacerbate pneumonia severity.19,20 In addition, AKI has been shown to impair neutrophil recruitment to the lungs, thereby amplifying pulmonary inflammation. These models consistently indicate that intrinsic tubular injury, rather than prerenal mechanisms alone, predominates in pneumonia-associated AKI.19,20 Our identification of urine output as an independent predictor of mortality aligns with these observations and highlights the clinical importance of early recognition and management of renal dysfunction in patients with bacterial pneumonia complicated by sepsis.
Beyond indices of organ dysfunction, multiple metabolic and inflammatory biomarkers have been associated with outcomes in bacterial pneumonia. Previous studies have reported close associations between renal injury and admission blood glucose levels, as well as subsequent glycemic variability during hospitalization.21,22 Excessive inflammatory responses mediated by circulating cytokines and chemokines may directly induce apoptosis in renal tubular epithelial cells, thereby contributing to AKI development. 23 Inflammatory markers such as C-reactive protein (CRP) and procalcitonin (PCT) have also been evaluated as prognostic indicators, with CRP showing stronger correlations with mortality in some studies,24,25 while PCT appears more specific for identifying bacteremia and guiding antimicrobial therapy. 26 In addition, protein-energy malnutrition has emerged as an independent risk factor for adverse outcomes in bacterial pneumonia, including higher mortality and increased susceptibility to complications such as sepsis, AKI, and thromboembolic events. 8 Severe bacterial pneumonia accompanied by stress hyperglycemia has likewise been associated with increased mortality, independent of diabetes status.27,28 Although these biomarkers and nutritional factors are clinically relevant, their exclusion from our final model was primarily due to limitations in data completeness, availability, or lack of incremental predictive value following penalized regression. Future studies using prospectively collected datasets may clarify whether incorporating such markers alongside our nomogram could further enhance prognostic accuracy.
From a clinical perspective, our findings have several important implications. First, the proposed nomogram relies exclusively on age, SOFA score, and urine output—parameters that are routinely collected in the ICU—without requiring additional laboratory testing or complex calculations, thereby facilitating real-time bedside application. Second, early identification of patients at high risk for 28-day mortality may support timely escalation of care, including intensified hemodynamic monitoring, prompt infection control measures, early nephrology consultation, and individualized fluid and renal-protective strategies. Third, by providing individualized absolute mortality risk estimates rather than relative scores alone, the nomogram may aid clinical decision-making, improve communication with patients’ families, and inform the design of targeted interventional trials in this vulnerable patient population.
Conclusion
In summary, we developed and internally validated a straightforward nomogram incorporating age, SOFA score, and urine output for predicting 28-day mortality among patients with bacterial pneumonia complicated by sepsis and AKI. This model demonstrated strong discriminative ability, satisfactory calibration, and clear net clinical benefit, surpassing the predictive performance of SOFA score alone in both derivation and validation cohorts. Owing to its dependence on routinely available clinical variables, the nomogram offers a feasible and practical approach for early risk stratification and individualized management in the ICU. Further prospective and multicenter studies are necessary to externally validate and refine this predictive tool, and to examine whether the integration of additional inflammatory, metabolic, and nutritional markers may further improve prognostic accuracy in this vulnerable patient population.
Limitations
In addition, because the cohort was derived from a large ICU database with strict inclusion/exclusion criteria and an a priori missing-data threshold (>20%), selection bias cannot be fully excluded. We did not perform a formal comparison of excluded versus included patients or sensitivity analyses incorporating patients with substantial missingness; therefore, model performance may be optimistic and should be interpreted cautiously until confirmed in external cohorts.
This study has several limitations that warrant consideration. First, as a retrospective analysis based on a single-center database, our findings may be subject to intrinsic selection bias and residual confounding. Despite the application of standardized Sepsis-3 and KDIGO definitions, some degree of misclassification regarding sepsis onset or AKI staging cannot be entirely excluded. Second, patients with more than 20% missing data were excluded, and multiple imputation was used for the remaining missing variables. This may have introduced selection bias and depends on the assumption that data are missing at random. Additionally, model development was performed using a single imputed dataset rather than pooling across multiple imputations, which could lead to a slight underestimation of uncertainty. Third, internal validation utilized a 70/30 random split, which, although it provided an independent test set, may be less statistically efficient than bootstrapping or k-fold cross-validation in the context of a moderate sample size. External validation in different centers and health systems is necessary before broad clinical implementation. Fourth, our model incorporated only baseline variables and data from the ICU period; it did not account for pre-ICU interventions, longitudinal biomarker changes, or detailed microbiological findings, factors that may also impact prognosis. Finally, as the model was specifically developed for bacterial pneumonia complicated by sepsis and AKI, extrapolation to other sepsis phenotypes or cases of pneumonia without AKI requires further study and cannot be presumed without additional validation.
Footnotes
Funding
The authors received no financial support for the research, authorship, and/or publication of this article.
Declaration of conflicting interests
The authors declared no potential conflicts of interest with respect to the research, authorship, and/or publication of this article.