
Abstract
Objective:
Rheumatoid arthritis (RA) and major depressive disorder (MDD) are interconnected conditions with a growing incidence, yet the mechanism that links them remains uncertain. This research focused on identifying the overlapping genes and pathogenic processes of RA and MDD via bioinformatics and National Health and Nutrition Examination Survey (NHANES) validation.
Methods:
The Gene Expression Omnibus (GEO) database provided RA and MDD-related data from datasets GSE715573 and GSE76826. To identify common differentially expressed genes (co-DEGs) between RA and MDD, a differential analysis was carried out with |logFC| > 0.5 and p < 0.05 as the screening thresholds. GEO 2R was used to screen the differential genes applied to construct volcano diagrams; Genome Ontology and Kyoto Encyclopedia of Genes and Genomes, and Database for Annotation, Visualization, and Integration Discovery were used to explore the functions and regulatory pathways of co-DEGs. In addition, we examined data from the NHANES between 2005 and 2006 to verify the link between Hcy and depression symptoms in arthritis patients.
Results:
Differential gene expression analysis identified 142 downregulated and 102 upregulated genes in RA peripheral blood, 935 upregulated genes, and 409 downregulated genes in MDD peripheral blood. Ten common genes (VNN1, CKAP4, CLEC4D, F5, CBS, TNFRSF25, NELL2, RNASE2, TXN, and SRPK1) were identified, and abnormal biosynthesis and catabolism process of cysteine was found as a comorbid link between RA and MDD. Population-level NHANES analysis confirmed higher serum Hcy associated with more severe depression symptoms in arthritis patients.
Conclusions:
This investigation reveals the overlapping genetic signatures that explain the common manifestations and the association between RA and MDD. The two diseases share DEGs of CBS, VNN1, and TXN, which indicates that the abnormal metabolic pathway of homocysteine is a common pathogenic pathway in RA and MDD. NHANES proved an association between Hcy and depression in arthritis participants, indicating that Hcy may be an important biomarker for intervention to delay or ultimately prevent comorbidities, and highlights the importance of dietary interventions such as supplementing folate. The knowledge may help develop novel therapies and a potential strategy to prevent or delay the coexistence of depression and arthritis, especially RA.
Introduction
The coexistence of Rheumatoid arthritis (RA) with depression has long been recognized.1–6 Accumulating epidemiological and clinical evidence supports a strong association between RA and major depressive disorder (MDD), the comorbidity may intensify the diseases. 4 RA is a long-term inflammatory disease marked by an autoimmune reaction where the immune system targets the joints, leading to joint deformity, disability, and reduced mobility due to pain and deterioration. 7 Inflammatory cascade in RA can be initiated or intensified by genetic predispositions and specific environmental factors, 8 and can trigger systemic reactions, thereby linking RA to various comorbidities, including depression. 9 RA patients show symptoms of fatigue, pain, and sleep disturbances, 10 and frequently manifest with depression and anxiety. A Japanese study found that the prevalence of MDD in RA patients was 6.8%, 2 while another study found the prevalence of current major depressive episodes in RA patients to be 31%.11,12 Furthermore, the prevalence of depression was notably higher among female RA patients, with depressive symptoms observed in up to one-third of this population. 13 Mild-to-moderate depressive symptoms are frequently observed in RA patients. 14 Meanwhile, MDD is a prevalent psychiatric disorder globally, significantly correlated with physical impairment and comorbidity. 15 MDD individuals also have an increased prevalence of RA, 16 suggesting shared etiologies and intersecting pathways between RA and MDD. Fully understanding the similarities in the pathogenesis of RA and MDD may help find more effective diagnostic methods and may hopefully prevent the occurrence of RA and MDD more effectively.
However, joint studies on the RA and MDD mainly concentrate on the treatment, and there are few bioinformatic studies on the two diseases at the same time, though some bioinformatic studies on a single disease are conducted.17–20 The data of gene expression profiles have been increasing rapidly in recent years, and it has become a new research hot issue to deeply explore the data of gene expression profiles by taking advantage of bioinformatics methods. Hence, we performed bioinformatics analyses using RA and MDD datasets from the Gene Expression Omnibus (GEO) database simultaneously, 12 and investigated the bioinformatics significance of the gene expression differences in patients with RA and MDD, thus further expanding the studies on genes for molecular pathogenesis of RA and MDD.
Furthermore, we used data from the National Health and Nutrition Examination Survey (NHANES) program to further investigate the connection between serum Hcy levels and RA-MDD comorbidity at the population level014). The NHANES study aims to examine the health and nutrition conditions of the participants by gathering information through demographic surveys, dietary assessments, questionnaires, physical examinations, and laboratory tests.10,13 The researchers obtained representative samples using a stratified multi-stage sampling design (Additional details regarding the database can be obtained from the website www.cdc.gov/nchs/nhanes.html). Included in this analysis were individuals who had arthritis according to the medical condition questionnaire from the NHANES 2005–2006 period. By integrating these two datasets, we aimed to provide a more comprehensive understanding of the relationship of RA-MDD comorbidity.
Materials and methods
Acquisition of data on gene expression profiles
Two expression profiling datasets, GSE15573 and GSE76826, were downloaded from the GEO database (http://www.ncbi.nlm.nih.gov/geo), an open-source platform for retrieving gene expression data. The GSE15573 dataset includes gene expression data of the peripheral blood mononuclear cells samples of 18 RA patients and 15 normal controls. In GSE76826, the number of cases from MDD patients and normal controls was 20 and 12, respectively. Two datasets were peripheral blood specimens, of which the detailed information is shown in Table 1 (Supplemental material).
Detailed information on GSE15573 and GSE768.
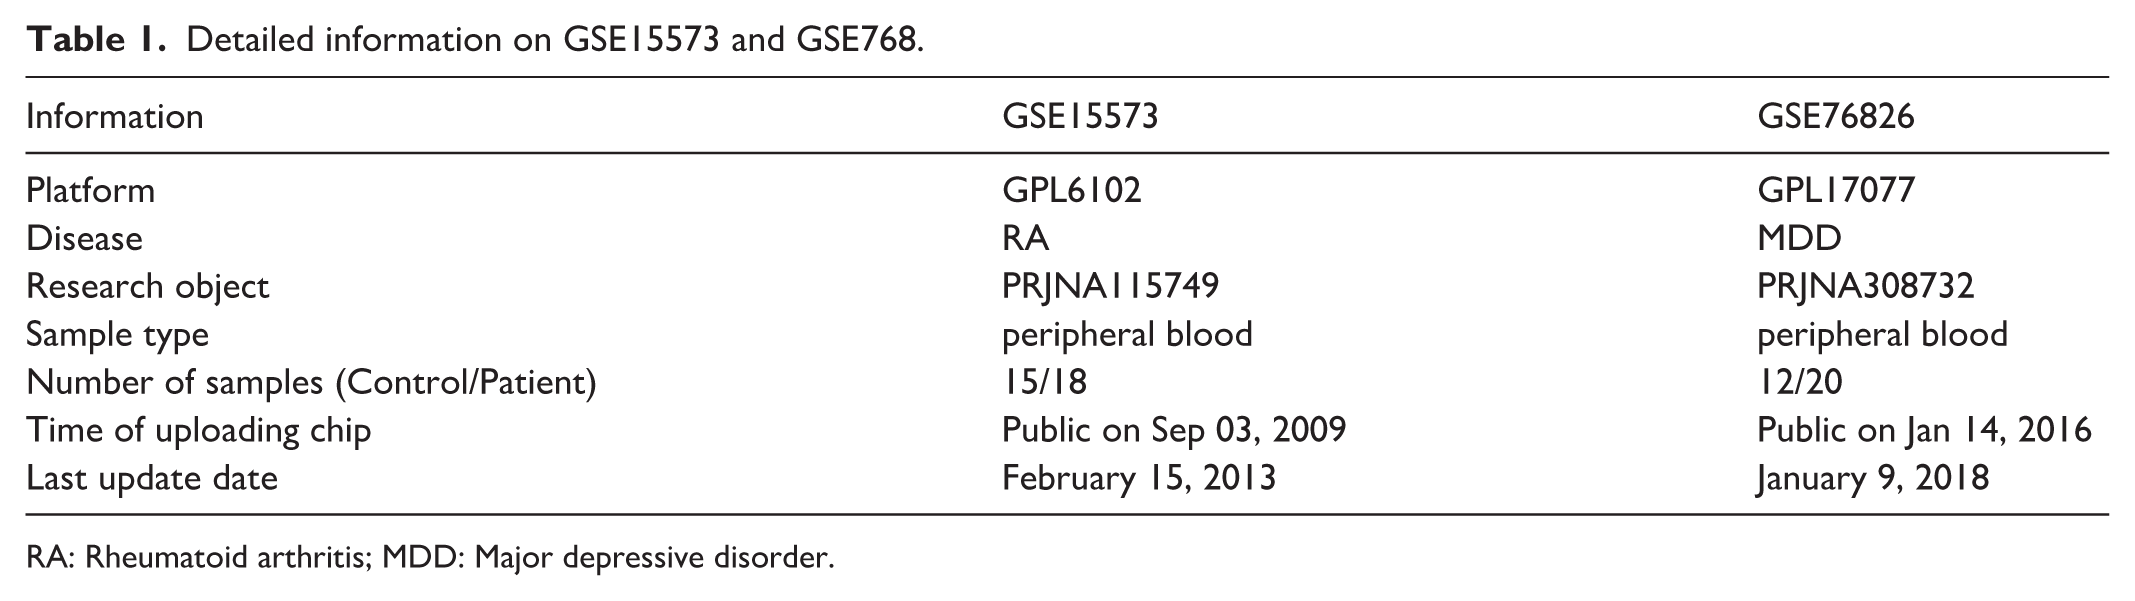
RA: Rheumatoid arthritis; MDD: Major depressive disorder.
Screening of differential genes and drawing of volcano diagrams
GEO2R (https://www.ncbi.nlm.nih.gov/geo/geo2r/), an online tool based on GEO query and limma R packages, was used to identify differentially expressed genes (DEGs) between patients and normal controls. Results for which p-value < 0.05 and |Fold change (FC)| > 0.5 were considered statistically significant. We chose a threshold of | logFC | > 0.5 mainly for the consideration of the relatively small sample size of this study, and its statistical testing power is limited; setting an overly strict logFC threshold will systematically exclude genes that have real biological effects but are underestimated, thereby significantly increasing the false negative rate. Furthermore, volcano diagrams were delineated by SangerBox software based on R language (http://sangerbox.com/).
Screening of common differential genes
The differential genes selected from the two datasets underwent Venn diagram analysis, and the intersection of genes in the differential genes of the two was defined as common differential genes, whose expression levels in the chips were stored for subsequent analysis. Venn diagrams were delineated by SangerBox software based on R language (http://sangerbox.com/).
Genome ontology enrichment analysis and Kyoto Encyclopedia of Genes and Genomes pathway analysis
Database for Annotation, Visualization, and Integration Discovery (DAVID) integrates all the major public bioinformatics resources and can interpret gene-related biological mechanisms by providing enrichment analysis with standardized genetic terminologies. DAVID knowledge base aims to accelerate high-throughput gene function analysis; for given gene lists, it gives rapid accessibility of extensive heterogeneous annotation data from the enriched area and enhances the biological information levels of the individual gene. 21
DAVID and Cytohubba (plug-in of Cytoscape software) were applied for Genome Ontology (GO) enrichment analysis and Kyoto Encyclopedia of Genes and Genomes (KEGG) pathway analysis for integrated differential genes. By logging in to the DAVID database (https://david.ncifcrf.gov/), the Gene ID Conversion was selected, followed by submission of differential gene lists.
The NHANES observational study
Included in this analysis were individuals who had arthritis according to the medical condition questionnaire from the NHANES 2005–2006 period. Missing data on the Hcy test and Patient Health Questionnaire (PHQ) test were omitted (Figure 1).

Flow chart of the procedure for the selection of eligible participants.
Depressive symptoms were assessed using the PHQ-9, which was administered to determine the frequency of depressive symptoms over the past 2 weeks. Each question has four response categories: ‘not at all’, ’several days’, ‘more than half the days’, and ‘nearly every day’, corresponding to scores of 0, 1, 2, or 3, respectively. Severity of depressive symptoms can be quantified as the summation of scores for all 9 items, with a total ranging from 0 to 27, where a higher score indicates more severe depressive symptoms. The following covariates were potentially confounding factors: age, gender, race, educational attainment, and type of arthritis.
Statistical analysis
Data analysis was performed using R software 4.2.3. (R Foundation for Statistical Computing). In descriptive analysis, continuous variables were shown in median (interquartile range), and categorical variables were shown in unweighted and weighted numbers and percentages (%). Hcy was classified according to quartiles (Q1-Q4 representing less than the 25th percentile, between the 25th and 50th percentiles, between the 50th and 75th percentiles, equal to or greater than the 75th percentile) with Q1 serving as the reference category. To determine the disparities, Wilcoxon rank-sum tests were utilized for intricate survey samples. Multivariate logistic regression analysis was conducted to determine the effect size (beta) with a 95% confidence interval (CI). We evaluated both categorical (quartiles) variables of Hcy. To probe the connection between serum Hcy levels and depressive severity in arthritis patients, we sequentially applied three logistic regression models. Initially, Model 1 adjusted for age and gender, while Model 2 adjusted for age, gender, race, and educational attainment. Model 3 included adjustments for age, gender, race, educational attainment, and type of arthritis. Statistical significance was set at p < 0.05, a standard for evaluating data associations or differences’ reliability.
Ethical considerations
The GEO database is a publicly available dataset with no personal identifiers and is not considered human subjects’ research. The National Center for Health Statistics Research Ethics Review Board approved the implementation of NHANES involving human subjects, and all participants provided informed consent.
Results
Screening of differential genes in RA and MDD
To identify the DEGs shared by RA and MDD, we first determined the DEGs in RA and MDD using microarray data from the GSE15573 and GSE76826 datasets, respectively. As revealed in Figure 2(a), a total of 244 differential genes in RA were selected from the GSE15573 dataset, including 102 upregulated genes and 142 downregulated genes (p < 0.05, log|FC| > 0.5). The top10 upregulated differential genes in RA were S100A8, RPL31, ORM1, COMMD6, LY96, RNASE2, S100P, CAMP, DEFA1B, TMA7; and the top10 downregulated differential genes in RA were IL2RB, RUNX3, HBZ, HNRNPH1, DNMT1, CD247, NUP62, ETS1, EVL, HDC (Table 2).

Volcano plots of DEGs in MDD and RA datasets. (a) MDD, GSE15573, and (b) RA, GSE76826.
The top 10 differential genes in GSE15573.

Full names of abbreviated genes and their biological significance. The top10 upregulated DEGs in RA: S100A8: S100 Calcium-Binding Protein A8, is a calcium- and zinc-binding protein which plays a prominent role in the regulation of inflammatory processes and immune response; RPL31: Ribosomal protein L31, component of the large ribosomal subunit; ORM1: alpha1-acid glycoprotein 1, functions as a transport protein in the blood stream, appears to function in modulating the activity of the immune system during the acute-phase reaction; COMMD6: COMM Domain Containing 6, Scaffold protein in the commander complex that is essential for endosomal recycling of transmembrane cargo, downregulates activation of NF-kappa-B and inhibits TNF-induced NFKB1 activation; LY96: Lymphocyte Antigen 96, Binds bacterial lipopolysaccharide (LPS), cooperates with TLR4 in the innate immune response to bacterial LPS, and with TLR2 in the response to cell wall components from Gram-positive and Gram-negative bacteria, and enhances TLR4-dependent activation of NF-kappa-B; RNase2: Ribonuclease A Family Member 2, a non-secretory ribonuclease, selectively chemotactic for dendritic cells; S100P: S100 calcium-binding protein P, may function as calcium sensor and contribute to cellular calcium signaling and stimulate cell proliferation in an autocrine manner via activation of the receptor for activated glycation end products (RAGE); CAMP: Cathelicidin Antimicrobial Peptide, antimicrobial protein that is an integral component of the innate immune system; DEFA1B: Defensin Alpha 1B, effector molecule of the innate immune system that acts via antibiotic-like properties against a broad array of infectious agents including bacteria, fungi, and viruses; TMA7: Translation Machinery Associated 7 Homolog, its function involves regulating cell proliferation, migration, invasion, and apoptosis; The10 downregulated DEGs in RA: IL2RB: Interleukin 2 Receptor Subunit Beta, receptor for interleukin-2; RUNX3: RUNX Family Transcription Factor 3, forms the heterodimeric complex core-binding factor (CBF) with CBFB; HBZ: Hemoglobin Subunit Zeta, the zeta chain is an alpha-type chain of mammalian embryonic hemoglobin; HNRNPH1: Heterogeneous Nuclear Ribonucleoprotein H1, this protein is a component of the heterogeneous nuclear ribonucleoprotein (hnRNP) complexes which provide the substrate for the processing events that pre-mRNAs undergo before becoming functional, translatable mRNAs in the cytoplasm; DNMT1: DNA Methyltransferase 1, methylates CpG residues and preferentially methylates hemimethylated DNA; CD247, part of the TCR-CD3 complex present on T-lymphocyte cell surface that plays an essential role in adaptive immune response; NUP62: Nucleoporin 62, essential component of the nuclear pore complex; ETS1: ETS Proto-Oncogene 1, Transcription factor, directly controls the expression of cytokine and chemokine genes in a wide variety of different cellular contexts, may control the differentiation, survival and proliferation of lymphoid cells; EVL: Enah/Vasp-Like, Ena/VASP proteins are actin-associated proteins involved in a range of processes dependent on cytoskeleton remodeling and cell polarity; HDC: Histidine Decarboxylase, catalyzes the biosynthesis of histamine from histidine.
Meanwhile, a total of 1341 differential genes in MDD were selected based on the GSE76826 dataset, including 935 genes with upregulated expression and 409 genes with downregulated expression (p < 0.05, log|FC| > 0.5) (Figure 2(b)). The top 10 upregulated and downregulated differential genes in MDD were presented in Table 3.
The top 10 differential genes in GSE7682.

Full names of abbreviated genes and their biological significance. The top10 upregulated DEGs in MDD: LOC391322: D-Dopachrome Tautomerase-Like, similar to D-dopachrome tautomerase; GSTT1: Glutathione S-Transferase Theta 1, conjugation of reduced glutathione to a wide number of exogenous and endogenous hydrophobic electrophiles; C4BPA: Complement Component 4 Binding Protein Alpha, controls the classical pathway of complement activation; FAM3B: FAM3 Metabolism Regulating Signaling Molecule B, induces apoptosis of alpha and beta cells in a dose- and time-dependent manner; ABCB5: ATP Binding Cassette Subfamily B Member 5, energy-dependent efflux transporter responsible for decreased drug accumulation in multidrug-resist; CTHRC1: Collagen Triple Helix Repeat Containing 1, may act as a negative regulator of collagen matrix deposition; LOC100233156: Tektin 4 Pseudogene, the transcription protein of this gene may be related to cell adhesion or immune regulation; XAGE3: X Antigen Family Member 3, may participate in tumor immune regulation; OR5T3: Olfactory Receptor Family 5 Subfamily T Member 3, Odorant receptor; C1orf145: chromosome 1 open reading frame 145; The top 10 downregulated DEGs in MDD: PSPHP1: Phosphoserine-Phosphatase Pseudogene 1, L-3 phosphoserine-phosphatase homolog, overexpressed in Fanconi anemia, fibroblats; UTS2: Urotensin 2, Highly potent vasoconstrictor; S100B: S100 Calcium-Binding Protein B, Small zinc- and calcium-binding protein that is highly expressed in astrocytes and constitutes one of the most abundant soluble proteins in brain; VSTM2B: V-Set And Transmembrane Domain Containing 2B, Encoding transmembrane proteins containing V-type immunoglobulin domains, which may be involved in cell signaling or immune regulation; CCL23: C-C Motif Chemokine Ligand 23, shows chemotactic activity for monocytes, resting T-lymphocytes, and neutrophils, inhibits proliferation of myeloid progenitor cells in colony formation assays; PSPH: Phosphoserine Phosphatase, Catalyzes the last irreversible step in the biosynthesis of L-serine from carbohydrates, the dephosphorylation of O-phospho-L-serine to L-serine; L-serine can then be used in protein synthesis, to produce other amino acids, in nucleotide metabolism or in glutathione synthesis, or can be racemized to D-serine, a neuromodulator; may also act on O-phospho-D-serine; C8orf31: Chromosome 8 open reading frame 31, may participate in cell signaling or stress response; TMEM176B: Transmembrane Protein 176B, may play a role in the process of maturation of dendritic cells.
Finally, we obtained a total of 10 common differential genes in RA and MDD by overlapping the DEGs screened from GSE15573 and GSE76826 datasets: VNN1, CKAP4, CLEC4D, F5, CBS, TNFRSF25, NELL2, RNASE2, TXN, and SRPK1 (Figure 3).
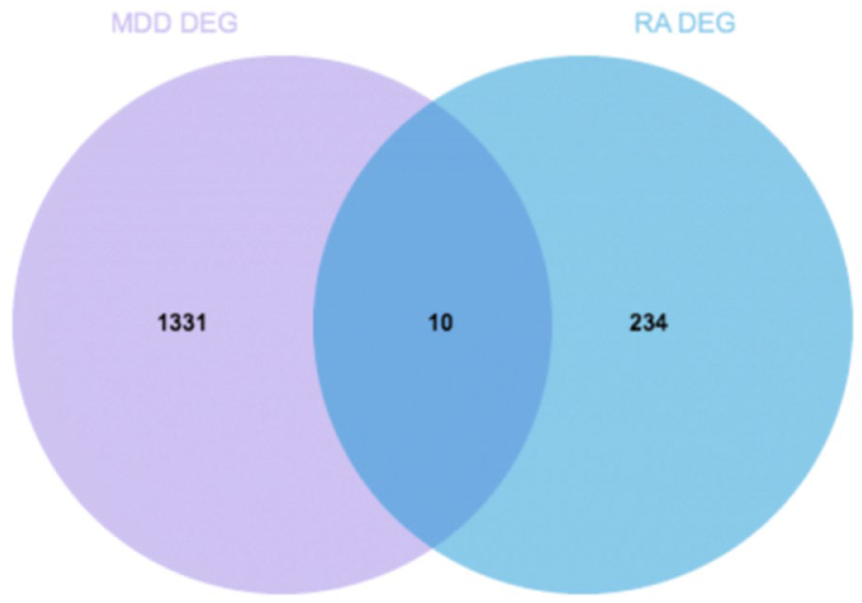
Ten common differential genes (VNN1, CKAP4, CLEC4D, F5, CBS, TNFRSF25, NELL2, RNASE2, TXN, SRPK1).
Functional enrichment of common differential genes in RA and MDD
To further investigate the function of the common differential genes in RA and MDD, we performed GO and KEGG functional enrichment analysis on 10 common differential genes using DAVID. The enriched top molecular function, biological process entries, cellular component, and KEGG pathways were listed in Figure 4(a–d). We note that the common DEGs in RA and MDD function in cysteine biosynthesis and glycine metabolism, indicating comorbid pathology concerning Hcy.
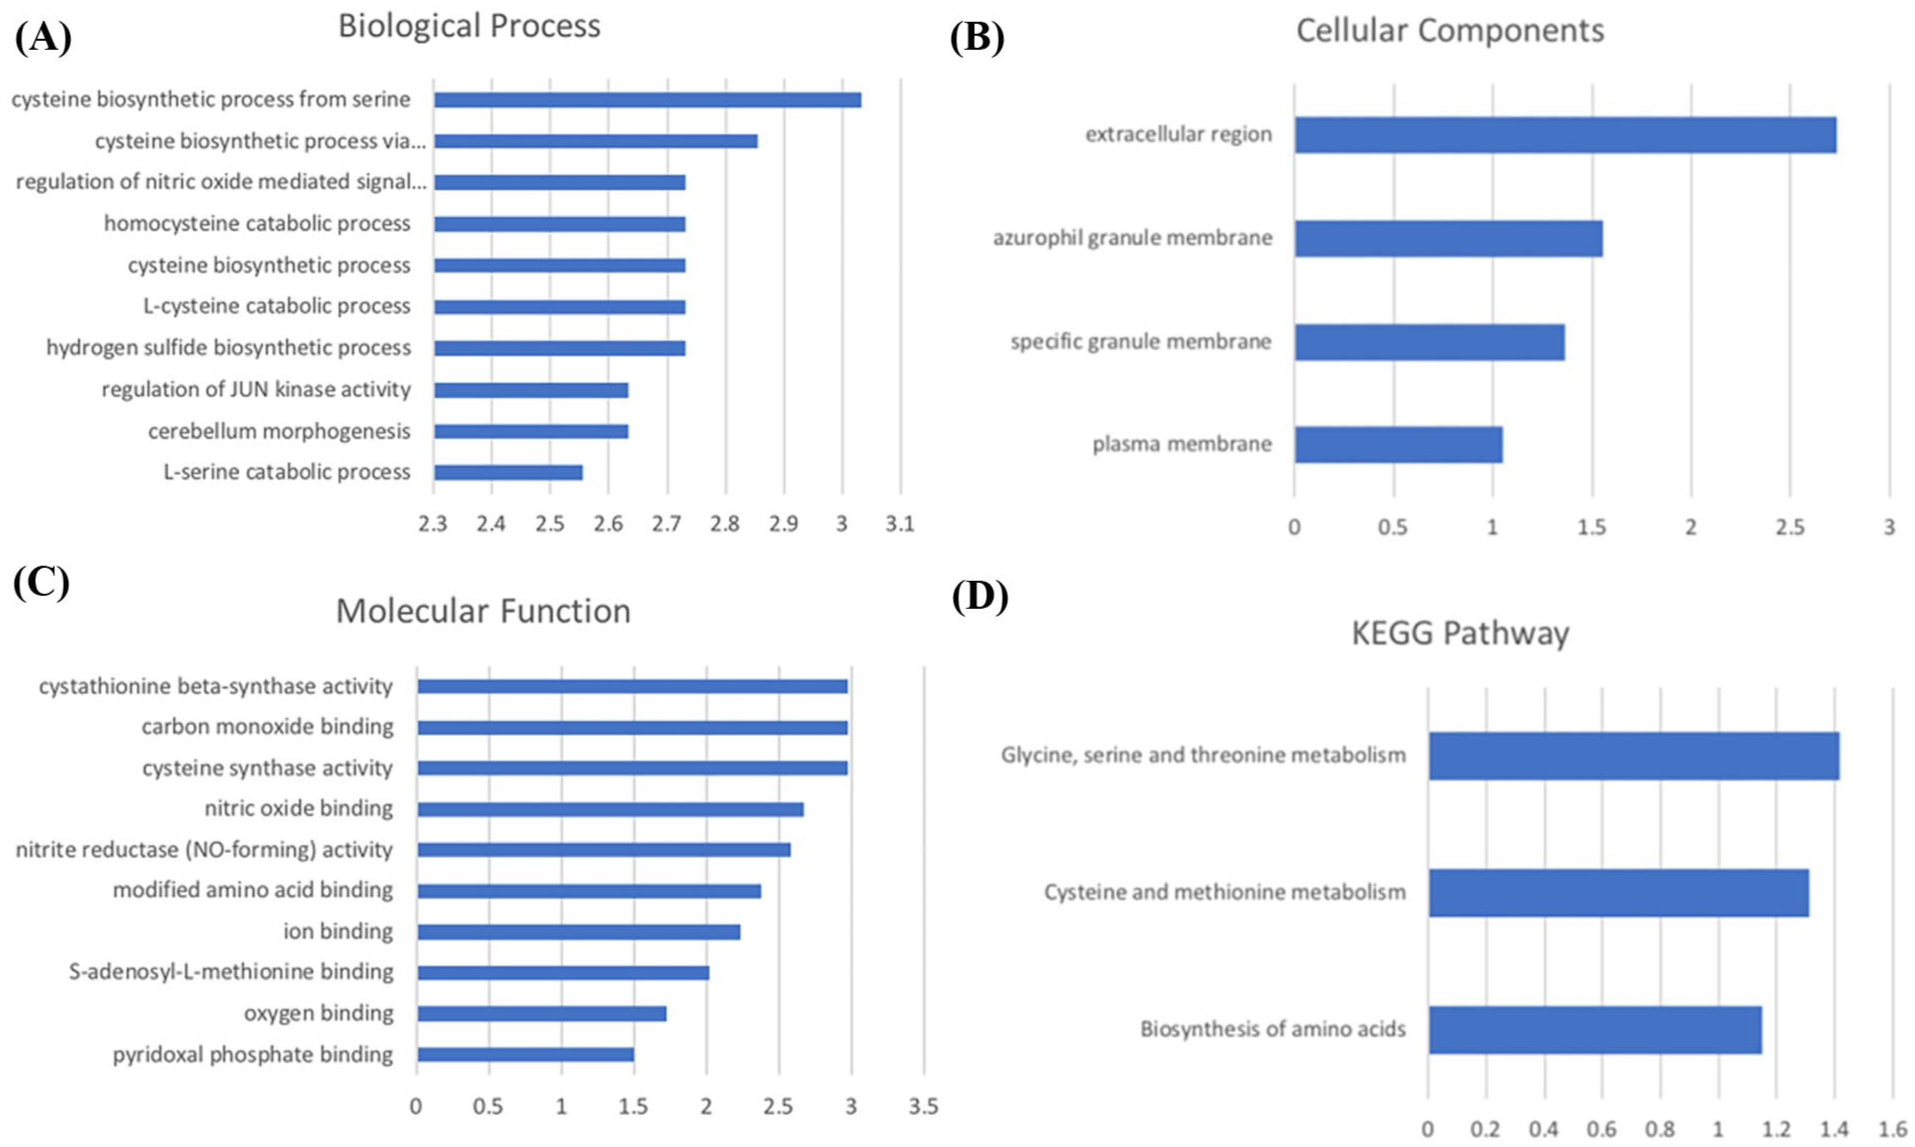
Function of the common DEGs. (a) Biological process, (b) Cellular component, (c) Molecular function, (d) KEGG pathway.
Association between serum Hcy and depressive symptoms in participants with arthritis
From the NHANES study, we validated that a correlation was observed between the serum Hcy levels of the arthritis patients and their performance on depressive severity. By using the Wilcoxon rank-sum test for complex survey samples, we found that the serum Hcy levels were positively correlated with PHQ-9 scores; higher serum Hcy level was associated with higher PHQ-9 scores in arthritis patients (Table 4).
Weighted multivariable linear regression analysis between Hcy and PHQ-9 score in arthritis participants.
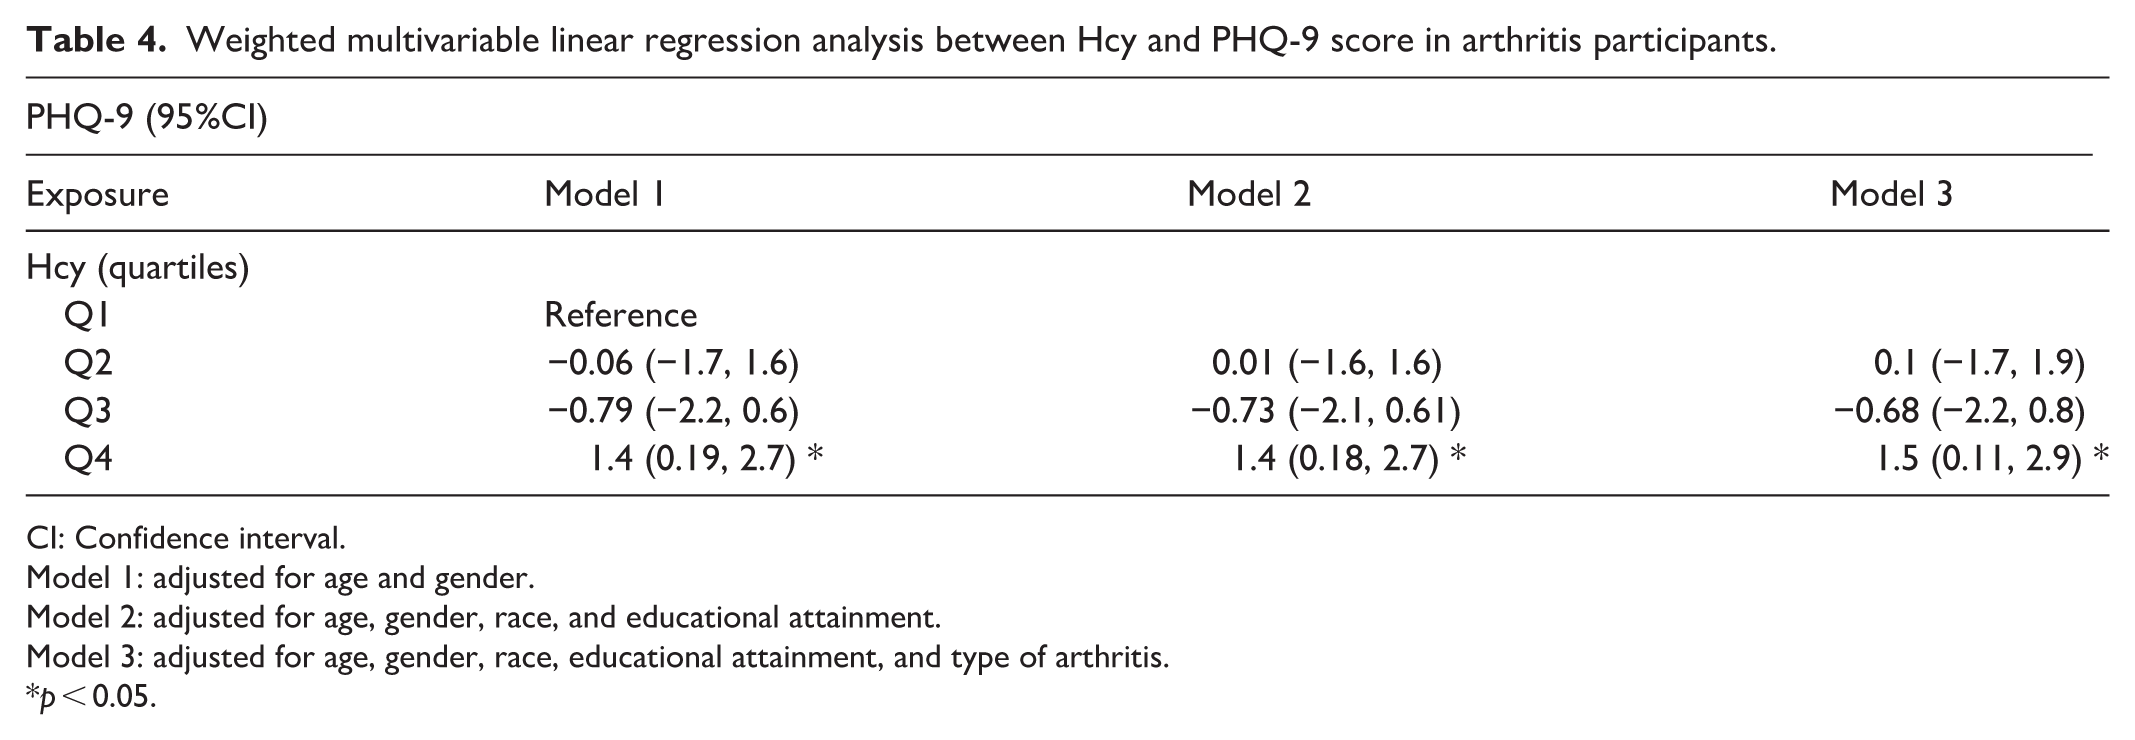
CI: Confidence interval.
Model 1: adjusted for age and gender.
Model 2: adjusted for age, gender, race, and educational attainment.
Model 3: adjusted for age, gender, race, educational attainment, and type of arthritis.
p < 0.05.
The multivariate linear regression analysis between Hcy and PHQ-9 score is presented in Table 4, after full adjustments of age, gender, race, education attainment, and types of arthritis in Models 1 (adjusted for age, gender), 2 (adjusted for age, gender, race, and educational attainment) and 3 (adjusted for age, gender, race, educational attainment, and type of arthritis), there is still a significant association between Hcy and PHQ-9 score (β = 1.5, 95%CI: 0.11, 2.9, p < 0.01). Meanwhile, serum Hcy levels were categorical variables for sensitivity analysis. The analysis of serum Hcy by quartile revealed that there is a positive association between higher serum Hcy levels and more severe depressive symptoms in arthritis patients
Discussion
Through GEO microarray analyses and the GEO2R tool, the study we identified a set of common DEGs (such as CBS, TXN, and VNN1) of RA and MDD, functional enrichment of the common DEGs indicating RA-MDD comorbidity pathology concerning abnormal biosynthesis and catabolism processes of cysteine. A population-based NHANES study further validated that there is a positive association between higher serum Hcy levels and more severe depressive symptoms in arthritis patients, indicating a potential value in the prevention of depression and RA coexistence by Hcy management through supplementing folic acid and vitamin B.
Hcy exacerbates arthritis (especially RA) through inflammation
Former researchers have found the critical role of Hcy in the pathogenesis of both RA and MDD. Hcy was present in synovial fluids, with a concentration significantly higher in RA patients than in controls. Hyperhomocysteinemia (HHcy) has been associated with inflammation, as Hcy can exert a proinflammatory effect by stimulating cytokine production from several vascular cell types, 22 and can enhance IL-6 and IL-8 production in RA synoviocytes (up to 35%) and produce a clear-cut activation of NF-kB in rheumatoid cells. Former studies have suggested that plasma Hcy levels independently predict chronic inflammation and serve as a useful biomarker for assessing complication risks in RA patients, 23 with folic acid and B12 supplements being crucial. 24 Patients with gout and RA, particularly those treated with Methotrexate(MTX), are suggested to be screened for HHcy, and those with HHcy could gain from earlier folic acid supplementation.25–27
Plenty of explanations for the high frequency of depression in RA patients, in addition to psychological causes, studies have proposed an inflammation hypothesis to explain possible biological mechanisms.28,29 Proinflammatory mechanisms, such as TNFα, IL-6, IL-17, and oxidative stress factors, are common pathogenetic pathways that emerge between inflammatory arthritis and mood disorders. 3 Hcy is an inflammatory marker contributing to vascular dysfunction, which can cause changes in the neural system, as well as induce mitochondrial dysfunction and disturb bone metabolism. 30 Furthermore, Hcy is one of the post-translational modifications of alpha 1 antitrypsin (A1AT), and anti-Hcy-A1AT autoAbs were considered potential biomarkers for RA. 31 Overall, Hcy can activate the immune system, and immune-inflammatory reactions may also lead to elevated Hcy levels, forming a malignant cycle
As for osteoarthritis(OA), high Hcy levels are also associated with an increased risk of all-cause mortality in OA patients. Hcy can cause joint damage through various pathways, such as inducing oxidative stress and participating in the release of inflammatory factors. 32 However, the link of Hcy could be stronger in inflammatory arthritis (e.g. RA) compared to non-inflammatory types (e.g. OA), while the NHANES data support a broader association between Hcy and depression in arthritis (all types of arthritis), the molecular findings from the GEO datasets are more specific to RA and MDD.
Hcy exacerbates depression by promoting vascular disease and neuroinflammation
Higher Hcy level has been suggested to be associated with MDD.33–35 This association intensified as depression severity increased. 36 Hcy is an important and adjustable risk factor for several neurological diseases. Animal experiments37,38 revealed that Hcy triggers symptoms similar to depression in normal Sprague Dawley(SD) rats and that HHcy has harmful effects on the nervous system, 38 with a focus on the synaptic vesicle cycle, and significantly contributed to the decrease in brain-derived neurotrophic factor (BDNF) and depressive behaviors, suggesting Hcy as a possible therapeutic target.
Several potential biological mechanisms have been proposed to explain how Hcy could contribute to the onset and development of depression. First, neurotoxic effects: High concentrations of Hcy may cause glutamate excitotoxicity by overactivation of N-methyl-D-aspartate receptors, leading to neuronal damage and death. 36 In addition, Hcy metabolism produces reactive oxygen species, causing oxidative stress and damaging nerve cells. 39 Second, promoting vascular disease and neuroinflammation: Hcy is an independent risk factor for cardiovascular and cerebrovascular diseases, which may indirectly participate in depression by damaging cerebral blood vessels, affecting brain blood supply. Hcy can simultaneously activate inflammatory signaling pathways, including NF-κB, promote the release of proinflammatory cytokines (such as IL-6 and TNF-α), and increase neuroinflammation, 39 which exacerbates depression. Third, affects neurotransmitter balance: Hcy has the potential to interfere with the creation and metabolism of monoamine neurotransmitters, including serotonin, norepinephrine, and dopamine, and the disruption of these systems is a classic pathological mechanism associated with depression.
The interaction of the CBS, TXN, and VNN1 affects the metabolic balance of Hcy
Among the common DEGs, the identification of CBS, a key enzyme in Hcy metabolism, 40 among the common genes provides a clear rationale for investigating systemic Hcy levels. The CBS gene is one of the key genes regulating Hcy levels in the body. The CBS enzyme is the initiating and limiting enzyme of the ‘sulfur conversion pathway’ in Hcy metabolism, responsible for converting Hcy into cysteine sulfide and clearing it from the blood. The defects or mutations of the CBS gene directly affect the activity of the CBS enzyme, 41 hindering the conversion of Hcy to cystathionine, resulting in the occurrence of HHcy.
In addition to directly metabolizing Hcy, CBS also has a very important function: it is also one of the key synthases of the endogenous gas signaling molecule hydrogen sulfide (H2S). 42 H2S has various physiological functions, including neuroprotection, vasodilation, anti-inflammatory effects, and antioxidant properties. In the brain, CBS is the main enzyme that produces H2S. CBS can utilize Hcy (as well as cysteine) as a substrate to generate H2S. This means that the activity of CBS not only determines the clearance efficiency of Hcy but also affects the level of H2S production with protective effects.
Furthermore, common DEGs such as VNN1, CBS, and TXN form a complex synergistic and antagonistic network in the homocysteine metabolism pathway. VNN1 regulates glutathione levels through pantothenic acid metabolism, CBS directly degrades Hcy as a key enzyme in the transculturation pathway, and TXN affects metabolic phenotype by regulating inflammatory response. The interaction of these genes not only affects the metabolic balance of Hcy but also participates in the pathogenesis of various diseases through mechanisms such as inflammation regulation and oxidative stress, providing new targets and strategies for the treatment of metabolic and inflammation-related diseases.
The NHANES database was analyzed and further verified that Hcy is significantly increased in arthritis participants with depressive symptoms, indicating that Hcy is a key link between the two diseases. Further supporting the value of supplementing with folic acid and vitamins B to reduce Hcy levels. Hcy is catabolized in the presence of vitamins B as coenzymes. 43 Deficiency of vitamins B12, folate (B9), and pyridoxine (B6) leads to HHcy, 44 indicating vitamin B intake shows a potential value in the prevention of depression and RA coexistence. 37
Limitations and future perspectives
There are some strengths in this study. First, the finding is further verified by NHANES samples that represent the entire nation, which underwent strict quality assurance measures, leading to more compelling statistical findings and confirming the analysis. Second, several meaningful confounders were considered and adjusted for, resulting in a more precise estimate of the correlation. Third, the study revealed a positive link between the Hcy quartile and depressive symptoms as measured by the PHQ-9 test; this finding had not been previously discussed.
While our investigation gives a valuable understanding of the relationship between Hcy and RA-MDD, acknowledging certain limitations is essential. First, because of the cross-sectional design, it was not possible to establish causality using the NHANES data, thus necessitating further research to investigate causality. Second, NHANES samples analyzed by arthritis participants include RA, osteoarthritis, and other unknown types of arthritis, and may lead to wider conclusions, while the NHANES data supports a broader association between Hcy and depression in arthritis (all types of arthritis), the molecular findings from the GEO datasets are more specific to RA and MDD. Third, PHQ-9 is a screening tool for depressive symptoms, not a diagnostic tool. Fourth, the lack of external validation is a limitation of this study; the molecular functions of CBS were not validated in this study. Further studies are needed to verify the expression of CBS in clinical samples from patients with both diseases.
Conclusions
This study provides insights into the overlapping genetic signatures underpinning the common phenotypic manifestations and the interrelationship between RA and MDD. The two diseases share DEGs of CBS, VNN1, and TXN, which indicates that the abnormal metabolic pathway of homocysteine is a common pathogenic pathway in RA and MDD. NHANES proved an association between Hcy and depression in arthritis participants, indicating that Hcy may be an important biomarker for intervention to delay or ultimately prevent comorbidities, and highlights the importance of dietary interventions such as supplementing folate. The knowledge may help develop novel therapies and a potential strategy to prevent or delay the coexistence of depression and RA.
Supplemental Material
sj-docx-1-smo-10.1177_20503121251410051 – Supplemental material for Homocysteine as a biomarker in arthritis and depression: Evidence from NHANES and gene expression studies
Supplemental material, sj-docx-1-smo-10.1177_20503121251410051 for Homocysteine as a biomarker in arthritis and depression: Evidence from NHANES and gene expression studies by Chuyu Deng, Zhenhua He and Xiaofeng Zhu in SAGE Open Medicine
Footnotes
Author contributions
Chuyu Deng: Study concept and design, acquisition of data, analysis, and interpretation of data, drafting of the manuscript; Zhenhua He, Xiaofeng Zhu: Critical revision of the manuscript, study design.
Funding
The authors disclosed receipt of the following financial support for the research, authorship, and/or publication of this article: This study is supported by the following grants: National Natural Science Foundation of China (NSFC)/ 82174479, Science and Technology Project of Guangzhou (2025A03J4285).
Declaration of conflicting interests
The authors declared no potential conflicts of interest with respect to the research, authorship, and/or publication of this article.
Data availability statement
The datasets analyzed during the current study are available in the GEO repository and NHANES database: https://www.ncbi.nlm.nih.gov/geo/query/acc.cgi?acc=GSE76826, https://www.ncbi.nlm.nih.gov/geo/query/acc.cgi?acc=GSE15573, ![]() .
.
Supplemental material
Supplemental material for this article is available online (https://www.ncbi.nlm.nih.gov/geo/query/acc.cgi?acc=GSE76826, https://www.ncbi.nlm.nih.gov/geo/query/acc.cgi?acc=GSE15573, ![]() ).
).
References
Supplementary Material
Please find the following supplemental material available below.
For Open Access articles published under a Creative Commons License, all supplemental material carries the same license as the article it is associated with.
For non-Open Access articles published, all supplemental material carries a non-exclusive license, and permission requests for re-use of supplemental material or any part of supplemental material shall be sent directly to the copyright owner as specified in the copyright notice associated with the article.