
Abstract
Objective:
To investigate the differences in mineral and glucose metabolic disorders among patients with primary aldosteronism, nonfunctional adrenal tumors, and controls.
Methods:
A retrospective analysis was conducted on clinical data from 578 patients, including those with primary aldosteronism, nonfunctional adrenal tumors, and control subjects, at our hospital between January 2013 and December 2023. Biochemical indices including parathyroid hormone, serum potassium, serum calcium, urine potassium, urine calcium, plasma renin, plasma aldosterone, glycosylated hemoglobin, insulin resistance index, and pancreatic beta cell function index were compared among the three groups.
Results:
Compared with the nonfunctional adrenal tumors and control groups, primary aldosteronism patients exhibited significantly higher levels of parathyroid hormone, urinary potassium, and aldosterone (p < 0.05), while their serum potassium and serum calcium levels were significantly lower (p < 0.05). Additionally, primary aldosteronism patients had higher glycosylated hemoglobin levels, lower HOMA-IR, and lower HOMA-β levels (p < 0.05). Pearson’s correlation analysis revealed that serum parathyroid hormone levels were negatively correlated with serum potassium, serum calcium, serum renin activity, and HOMA-β levels, while positively correlated with urinary potassium, urine calcium, blood carbon dioxide combining power, urine pH, serum aldosterone, and HOMA-IR levels. Stepwise regression analysis indicated that HOMA-IR and aldosterone were the main factors influencing parathyroid hormone levels. Based on receiver operating characteristic curve analysis, the optimal cut-off value for parathyroid hormone in diagnosing primary aldosteronism was 62.1 pg/ml, with a sensitivity of 94.4% and specificity of 81.0%.
Conclusion:
Primary aldosteronism is often characterized by elevated parathyroid hormone levels, which can exert direct adverse effects on mineral and glucose metabolism. Elevated parathyroid hormone levels serve as a valuable indicator in the screening of primary aldosteronism.
Introduction
Primary aldosteronism (PA) is characterized by low renin and high aldosterone levels. The excessive secretion of aldosterone by the adrenal cortex leads to renal potassium excretion, sodium retention, and increased blood volume, thereby causing hypertension, which is one of the most common causes of endocrine-related hypertension. 1 The classic clinical manifestations of PA include hypertension and hypokalemia. Beyond hypertension, PA is associated with increased rates of insulin resistance, 2 type 2 diabetes, and osteoporosis, 3 phenomena that cannot be easily explained by hypertension alone. A growing body of evidence indicates that parathyroid hormone (PTH) levels are elevated in PA patients, and the proportion of PA patients with concurrent diabetes or abnormal glucose tolerance is higher.4–7 This study aimed to analyze the differences in mineral and glucose metabolic disorders among PA, nonfunctional adrenal tumor (NFAT), and control groups, providing insights for the diagnosis and treatment strategies of PA.
Subjects and methods
Subjects
A retrospective analysis was conducted on 178 patients with PA treated and followed up in the Endocrinology Department of our hospital from January 2013 to December 2023, along with 219 patients with NFAT confirmed through functional screening, and 181 control patients who did not have hypertension, hypokalemia, or adrenal space-occupying lesions. All patients had discontinued antihypertensive medications, including β-receptor blockers, Angiotensin Converting Enzyme inhibitors, and angiotensin II receptor blockers for more than 2 weeks, and diuretics such as spironolactone for more than 4 weeks before admission. For patients who could not discontinue antihypertensive drugs, α-receptor blockers and nondihydropyridine calcium channel blockers were used to maintain blood pressure below 160/100 mmHg, and serum potassium levels were corrected to normal or at least 3.0 mmol/L. The plasma aldosterone concentration to plasma renin activity (PRA) ratio (aldosterone-renin ratio (ARR)) was calculated to identify potential PA patients, and one or more confirmatory tests (saline infusion test or captopril challenge test) were conducted to verify ARR-positive patients. Exclusion criteria included patients with severe cardiac, hepatic, or renal insufficiency; primary hyperparathyroidism; Cushing’s syndrome; pheochromocytoma; secondary aldosteronism; osteoporosis (T-score < −2.5); vitamin D deficiency; malignant tumors; those receiving glucocorticoid therapy; using licorice preparations; or taking medications affecting calcium and phosphorus metabolism. This study was approved by the Ethics Committee of Shenzhen Luohu People’s Hospital.
Methods
General data collection
Data including sex, age, body mass index (BMI), serum and urine electrolytes (potassium, calcium, and phosphorus), PRA, aldosterone concentration, 25-hydroxyvitamin D3 (VitD3), serum PTH measured by electrochemiluminescence immunoassay, the homeostatic model assessment of insulin resistance (HOMA-IR), and pancreatic beta-cell function (HOMA-β) were collected. All data were anonymized and retrieved from the Hospital Information System (HIS) on 20 June 2024, to ensure patient confidentiality.
PA screening
For patients with persistent hypertension (>150/100 mmHg), refractory hypertension (blood pressure > 140/90 mmHg despite treatment with three or more conventional antihypertensive drugs), or those requiring four or more antihypertensive drugs to achieve blood pressure control (<140/90 mmHg), newly diagnosed hypertensive patients, and patients with spontaneous hypokalemia and adrenal space-occupying lesions identified through imaging, hypertension screening tests were conducted. Prior to the examination, patients maintained a regular diet and sleep schedule. Plasma aldosterone and renin levels were assessed (measured by chemiluminescence) after 2 h of upright position and 15 min of sitting position. The aldosterone-to-renin ratio (ARR) was calculated based on these measurements. Patients with ARR > 30 underwent further confirmatory diagnostic tests, including the saline infusion test and/or captopril challenge test.
Inclusion criteria
The inclusion criteria for the PA group were as follows: patients whose aldosterone levels could not be suppressed below 100 pg/mL in the saline infusion test, and whose aldosterone concentrations did not decrease by at least 30% after 1 or 2 h during the captopril challenge test. Patients were diagnosed with PA based on clinical manifestations, confirmed endocrine function evaluation results, and postoperative pathology.1,8
The inclusion criteria for the NFAT group were as follows: 1. Patients with adrenal adenomas or nodules. 2. Patients without clinical manifestations of hypertension or hypokalemia, confirmed by functional screening to have nonfunctional tumors (excluding adrenal hormone excess through measurement of cortisol levels, ARR, and plasma norepinephrine). Specifically, the midnight blood cortisol level must be <50 nmol/L, or >50 nmol/L but suppressed to below 50 nmol/L after a 1-mg overnight dexamethasone suppression test. 3. Benign adrenal imaging findings or postoperative pathology confirming benignity. 9
The healthy control group consisted of individuals without underlying diseases such as hypertension, hypokalemia, or adrenal space-occupying lesions that could affect the study outcomes.
Statistical analysis
Statistical analysis was performed using SPSS version 28.0 for Windows (IBM Corp.). Measurement data were subjected to normality testing and analysis of variance. Normally distributed measurement data were expressed as mean ± standard deviation (SD). One-way analysis of variance was conducted to compare multiple groups, and the Least Significant Difference (LSD) method was used for pairwise comparisons when statistically significant differences were observed between groups. p < 0.05 was considered statistically significant. Pearson’s correlation analysis was conducted to evaluate the correlation between PTH and each indicator. Subsequently, stepwise regression analysis was performed to identify the main factors among the relevant indexes. The receiver operating characteristic (ROC) curve was employed to assess the diagnostic efficacy of PTH in PA and to determine the optimal cut-off value.
Results
Clinical and biochemical parameters were assessed and compared between the PA group, NFAT group, and control group.
The related indexes among the three groups were compared. The male-to-female ratios in each group were comparable, and there were no significant differences in age or BMI. Serum potassium and urine potassium levels in the PA group were significantly different from those in the NFAT and control groups (p < 0.01). Meanwhile, there was no significant difference in serum or urine potassium between the NFAT and control groups. Serum calcium levels in the PA group were lower than those in the NFAT and control groups, with a statistically significant difference (p < 0.05). Although urinary calcium levels did not differ significantly among the three groups, the level in the PA group was higher. Renin activity, aldosterone, and PTH levels in the PA group were significantly different from those in the NFAT and control groups. Specifically, renin activity was lower, while aldosterone and PTH levels were higher in the PA group. There was no significant difference in VitD3 levels among the three groups (Table 1).
Clinical and biochemical parameters across all groups.

Data are presented as means ± SE.
BMI: body mass index; VitD3: 25-hydroxyvitamin D3; PTH: parathyroid hormone; HbA1c: glycated hemoglobin; HOMA-IR: fasting blood glucose (mmol/L) × fasting insulin (μU/ml)/22.5; HOMA-β: 20× fasting insulin level (mIU/L)/(fasting blood glucose (mmol/L)-3.5).
Significant difference (at least p < 0.05).
Through Pearson’s correlation analysis, serum PTH was found to be negatively correlated with serum potassium, serum calcium, serum renin activity, and HOMA-β levels, while positively correlated with urinary potassium, urinary calcium, blood carbon dioxide combining power, urine PH, serum aldosterone, and HOMA-IR levels. All correlations were statistically significant. The differences were statistically significant (Table 2).
Pearson’s correlation analysis of PTH with relevant factors.
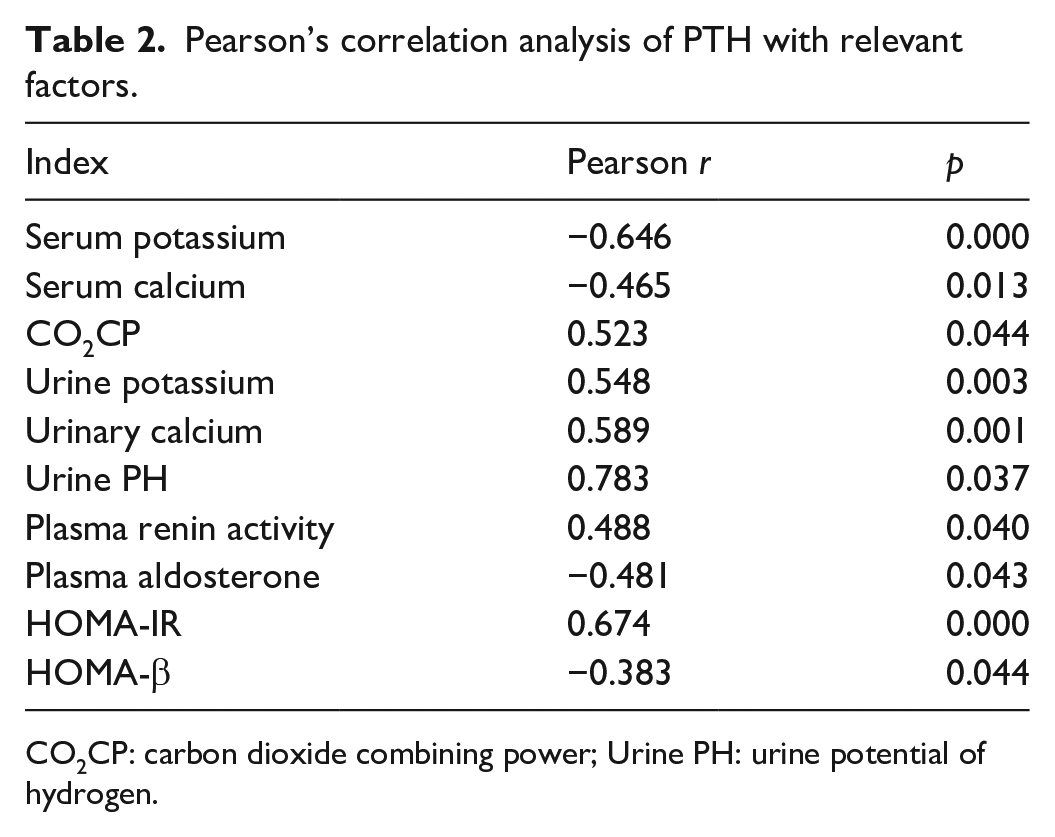
CO2CP: carbon dioxide combining power; Urine PH: urine potential of hydrogen.
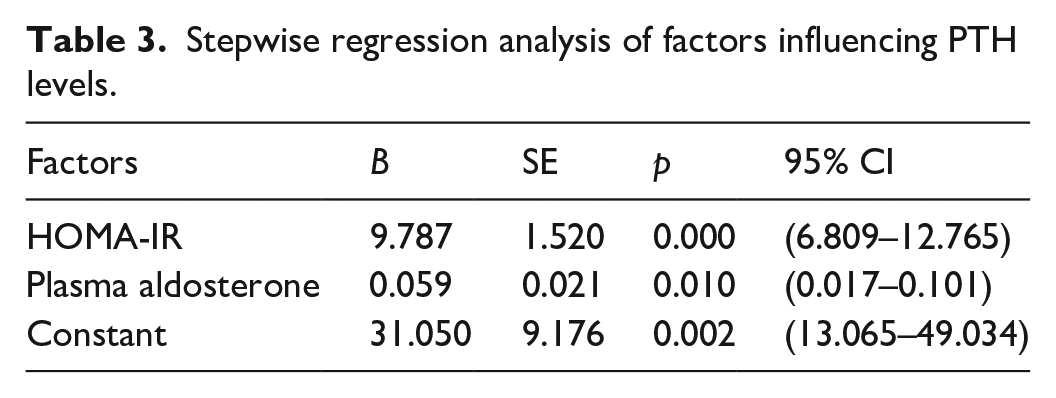
PTH was subjected to stepwise regression analysis, with serum potassium, serum calcium, urine potassium, urine calcium, VitD3, HOMA-β, HOMA-IR, aldosterone, and renin activity serving as independent variables, while PTH served as the dependent variable. The final model included HOMA-IR and aldosterone, with an R-square value of 0.691. This suggests that HOMA-IR and aldosterone are the primary factors influencing PTH levels (Table 3).
Stepwise regression analysis of factors influencing PTH levels.
Value of the PTH cut-off point in screening for PA
According to the ROC curve analysis, the cut-off point corresponding to the highest Youden index was determined as the optimal threshold for screening PA. The PTH cut-off value was determined to be 62.1 pg/mL, with a sensitivity of 94.4%, specificity of 81.0%, and a Youden index of 0.754. This cut-off value serves as an important evaluation indicator for PTH screening in PA (Table 4 and Figure 1).
The cut-off value for PA screening using PTH.

AUC: area under the curve.

ROC curve analysis for PTH screening in PA.
Discussion
PA is not only associated with hypertension but also exhibits significantly higher levels of abnormal glucose and lipid metabolism, as well as damage to target organs such as the heart, brain, and kidneys. Recent studies have identified mild secondary hyperparathyroidism, characterized by elevated PTH levels, as another potential clinical feature of PA. 6 Some studies have reported that hyperaldosteronemia may lead to abnormal glucose metabolism through mechanisms including islet dysfunction and insulin resistance, which can subsequently affect glucose homeostasis via impaired insulin-dependent glucose uptake in peripheral tissues, enhanced gluconeogenesis, and reduced insulin secretion. 10 The aim of our study was to investigate the differences in mineral and glucose metabolic disorders among the PA, NFAT, and control groups, thereby exploring the clinical value of PTH in the screening of PA.
Our data from the three groups in our study were compared, revealing that patients in the PA group exhibited hyperparathyroidism, hyperaldosteronemia, and significantly lower renin levels compared to the NFAT and control groups. Hypokalemia and hypocalcemia were also observed in the PA group, with statistically significant differences. Although urinary calcium levels in the PA group were slightly higher than those in the NFAT and control groups, this difference was not statistically significant, potentially due to an inadequate sample size or statistical limitations. The level of vitamin D3 was slightly lower but not significantly different, indicating that the serum calcium changes in the PA group were not induced by vitamin D3 levels. As shown in previous studies, patients with PA are often associated with hyperparathyroidism and even secondary hyperparathyroidism, which is an important indicator of calcium and phosphorus electrolyte metabolism in addition to serum potassium. 11
Correlation analysis in this study indicated that PTH levels were positively correlated with urinary potassium, urinary calcium, blood carbon dioxide combining power, urine pH, serum aldosterone, and HOMA-IR. Regression analysis revealed that serum aldosterone was one of the main factors influencing PTH levels. This suggests that hyperparathyroidism may be a secondary consequence of hyperaldosteronism caused by PA and may also contribute to the development and maintenance of PA. There is a reciprocal interaction between aldosterone and PTH, leading to the coexistence of secondary hyperparathyroidism in PA and hyperaldosteronism in hyperparathyroidism.3,12 The initial factor may be that increased aldosterone induces higher urinary calcium excretion, resulting in changes in serum calcium levels and subsequently elevated PTH levels leading to secondary hyperparathyroidism.13–17
Our study also found that PA patients exhibited hyperparathyroidism, which was associated with mineral metabolic disorders. The decrease in serum calcium levels may lead to secondary hyperparathyroidism. However, pathological diagnosis or adrenal vein sampling remains the gold standard for differentiating PA from NFAT and control groups. Given the invasiveness, complexity, and high cost of these methods, simple markers as auxiliary standards for clinical diagnosis of PA are needed. Our study observed a significant increase in PTH levels in the PA group compared to the NFAT and control groups. Analysis of diagnostic value indicated that the optimal PTH cut-off value was 62.1 pg/ml, with a sensitivity of 94.4% and specificity of 81.0%. Zhang et al. 7 also suggested that PTH may serve as a promising auxiliary index for diagnosing aldosterone-producing adenomas. Brunaud et al. 18 demonstrated that preoperative PTH levels > 100 pg/ml were an independent predictor of abnormally elevated plasma aldosterone levels. Our study found a cut-off value of 62.1 pg/ml for PTH, which is considerably lower than 100 pg/ml, indicating higher sensitivity but potentially lower specificity.
In this study, glucose metabolism data were analyzed across the three groups, revealing that patients with PA exhibited higher levels of glycosylated hemoglobin (HbA1c) and HOMA-IR, while demonstrating lower HOMA-β levels compared to those in NFAT patients and controls. These findings suggest the presence of glucose metabolic disorders in PA patients. Hyperaldosteronemia and hyperparathyroidism may contribute to abnormal glucose metabolism through impaired islet function and insulin resistance. First, PTH affects calcium and phosphorus metabolism, leading to changes in intracellular calcium ion concentration, which in turn interferes with insulin secretion and action mechanisms, causing insulin secretion disorders and insulin resistance. Karras et al. 19 found that inappropriate PTH oversecretion may exacerbate disordered glucose homeostasis, playing a pivotal role in the progression from prediabetes to overt diabetes. They also demonstrated that parathyroidectomy in individuals with hyperparathyroidism and prediabetes can improve glucose homeostasis. 20 Second, elevated aldosterone levels reduce insulin sensitivity and promote or even induce insulin resistance via multiple mechanisms, including the activation of mineralocorticoid receptors, damage to insulin-sensitive cells such as adipocytes and skeletal muscle cells, and increased inflammation and reactive oxygen species, leading to pancreatic beta cell dysfunction and reduced insulin secretion.21–23
Limitations
In this study, a formal sample size calculation was not conducted prior to data collection due to the retrospective of the analysis, which relied on preexisting medical records. As a result, the sample size was determined by the number of eligible patients within the specified study period, which may have constrained the statistical power and generalizability of the findings. Future research would benefit from prospective designs that incorporate rigorous sample size calculations to enhance the robustness and reliability of statistical analyses.
This study had several limitations. The data were restricted to information documented in the HIS. Variations in population characteristics and measurement methodologies across different laboratories may result in discrepancies in cut-off points. To more comprehensively evaluate the diagnostic utility of PTH in screening for PA in incidental adrenal tumors, future studies should consider larger sample sizes and leverage big data from diverse populations.
Conclusions
Aldosterone interacts with increased PTH levels, participating in mineral and glucose metabolic disorders. The elevation of PTH levels holds clinical significance for the screening of PA. Therefore, early intervention of metabolic disorders are crucial for effective treatment. Future research should explore whether combining mineralocorticoid receptor antagonists with glucocorticoid receptor antagonists or targeted therapies for glucocorticoid excess in PA patients can mitigate the risk of hyperglycemia and evaluate their safety.
Footnotes
Acknowledgements
The authors thank all the participants of the study.
Authors’ contributions
All authors contributed to the study conception and design. The project were funded by Wenxiu Liu. Material preparation, data collection, and analysis were performed by Zhilian Sun. The first draft of the manuscript was written by Zhilian Sun. All authors read and approved the final manuscript.
Declaration of conflicting interests
The author(s) declared no potential conflicts of interest with respect to the research, authorship, and/or publication of this article.
Funding
The author(s) disclosed receipt of the following financial support for the research, authorship, and/or publication of this article: This work was supported by the Yulin Science and Technology Bureau Foundation (Grant number 2023-SF-53, Research on the Application of Metabolic Management Center(MMC) in the Management of Diabetic Patients).
Ethical approval
This study was approved by the Ethics Committee of Shenzhen Luohu People’s Hospital (approval number:2024-LHQRMYY-KYLL-29). Written Informed Consent was waived by the Institutional Review Board. The date of approval for the study was 17 June 2024. This study was performed in accordance with the ethical principles of the Declaration of Helsinki.
Informed consent
Informed consent was not sought for this study because *Written Informed Consent was waived by the Institutional Review Board (Ethics Committee of Shenzhen Luohu People’s Hospital)*.
Trial registration
Not applicable.