
Abstract
Objectives:
Evaluating peripheral neuropathy mainly relies on physical examination, patient history, and electrophysiological studies. High-resolution ultrasound is a fast, noninvasive modality for dynamic nerve assessment that enables the length of the nerve to be examined. Magnetic resonance imaging is preferred for examining deeper nerves with a high contrast resolution; its use shows excellent benefit in patients with atypical presentation, equivocal diagnosis, suspected secondary causes, and postsurgical relapse. We aimed to assess the measurements and criteria for both ultrasound and magnetic resonance neurography for the diagnosis of carpal tunnel syndrome, based mainly on the three measurements assessed by Buchberger et al.
Methods:
This prospective study was conducted to test diagnostic accuracy. Thirty-two patients who presented clinically with, and were diagnosed by electrophysiological tests as having, carpal tunnel syndrome participated. Superficial ultrasound of the wrist joint was performed on all participants, followed by magnetic resonance imaging within 1 week of ultrasonography.
Results:
The three main parameters of cross-sectional area measurement, distal nerve flattening, and flexor retinaculum bowing indices showed positive occurrences of 93.7%, 59.4%, and 59.4%, respectively; 90.6% of patients had decreased nerve echotexture. The diagnostic ability of magnetic resonance imaging was decreased when cross-sectional area measurements were used: positive results were achieved in 81.2% of patients, but the positive results showing the distal tunnel nerve increased flattening and bowed flexor retinaculum slightly decreased to 56.2% for each. A high T2 signal of the median nerve was observed in 90.6% of patients. In an agreement analysis, we found a statistically significant difference that supported the use of ultrasound as a primary diagnostic modality for carpal tunnel syndrome. However, magnetic resonance imaging improved tissue characterization and was a good diagnostic modality, with a statistically significant difference, for cases of secondary carpal tunnel syndrome, detection of the underlying entrapping cause, and early abnormality detection in the innervated muscle.
Conclusions:
Our results demonstrate that ultrasound examination can be used as the first imaging modality after physician evaluation, with results comparable to those of electrophysiological studies for evaluating carpal tunnel syndrome and determining its cause. Magnetic resonance neurography examination is the second step in detecting secondary causes in cases with suspected early muscle denervation changes that cannot be elicited by ultrasound or in cases with equivocal results.
Keywords
Introduction
Neuropathy is a clinical term that describes both sensory and motor abnormalities in areas supplied by specific peripheral nerves, and may be caused by metabolic or regional structural disorders. Carpal tunnel syndrome (CTS) is the most common peripheral neuropathy of the upper extremities, with a prevalence of 2%–3% in the general population. 1
Many risk factors have been described as causes of CTS, with diabetes mellitus being the most common. Others include pregnancy (in which CTS can resolve after delivery), rheumatoid arthritis, obesity, acromegaly, hypothyroidism, and a variety of metabolic and depositional diseases such as gout, calcium pyrophosphate deposition, amyloidosis, and mucopolysaccharidosis, which occurs in children. The development of CTS can also be induced by compression from external forces such as accessory muscles, tendon synovitis, or wrist masses such as ganglion cysts, hamartomas, lipomas, or surrounding tissue masses. 2
Nerve compression induces a cascade of pathophysiological changes, mainly due to microcirculatory disorders. In the early stages, compression primarily affects axonal transport and leads to reversible symptomatic damage. Subsequently, interstitial edema of the epineurium and endoneurium causes nerve damage, starting with the nerve sheath and resulting in recurrent symptoms. Damage to the axon follows, which causes signs of denervation, including muscle weakness and sensory abnormalities. In the chronic stages, edema activates fibroblasts and leads to fibrosis of the supporting tissue. If CTS treatment fails, it increases the possibility of double crush syndrome, in which the nerve may be proximally compressed and likely causing its distal part to be compressed and vice versa. 3
The clinical evaluation of peripheral neuropathy mainly depends on physical examination, patient history, and electrophysiological studies of evoked potential abnormalities. 4 Conduction studies are mainly used to diagnose regional median nerve injury and determine the degree of nerve damage, distal sensory nerve conduction velocities, and motor latency abnormalities. 5
High-resolution ultrasound (US) has the advantage of being a fast and noninvasive modality. In addition, US facilitates dynamic nerve assessment with high spatial resolution, enabling longer nerves to be examined. However, its main limitation is that it is operator dependent. 6
Magnetic resonance is a good modality to use for examining nerves and has a high contrast resolution. Its use has excellent benefits in patients with atypical presentation, equivocal diagnosis, suspected secondary causes, and postsurgical relapse. 7
In the current study, we included patients diagnosed with CTS on the basis of electrophysiological studies. Our aim was to assess the measurements and criteria of both US and magnetic resonance neurography (MRN) in diagnosing CTS, based on the three measurements assessed by Buchberger et al. 8
Ultrasonography diagnostic criteria
US is used in patients with normal electrophysiological test results at an early stage of the disease. 9 In the early stages of CTS, US morphological changes to the nerve can be visualized using US before electrophysiological abnormalities become apparent. 2 The diagnostic features of CTS on US include the following: (1) different calibers are visualized as proximal enlargement of the median nerve followed by distal flattening (i.e., a notch sign). Nerve constriction beneath the flexor retinaculum gives the nerve an hourglass-like appearance. In some cases, distal nerve enlargement has been noted, with limited nerve motion in the sagittal plane 10 ; (2) increased cross-sectional area (CSA) of the nerve is observed at the pisiform and scaphoid levels. The normal CSA ranges from 6.1 to 10.4 mm2 in the diagnosis of CTS, a CSA of 12 mm² has a 99% sensitivity, whereas one of 8.5–12 mm² shows an 87% sensitivity, with a proportional relationship being observed between increases in CSA and decreases in nerve conduction velocity. 11 Patients with bifid median nerves have a CSA of 12 mm2, which is calculated by adding the CSA of both the medial and lateral branches 12 ; (3) palmer bowing of the flexor retinaculum of ⩾2–4 mm can be used in the diagnosis of CTS 13 ; (4) if the fattening index, that is, the ratio between the greatest and smallest diameters of the nerve, is greater than three 13 ; (5) a hypoechoic nerve with loss of the fasciculate appearance 3 ; (6) intraneural hyperemia due to congestion of epi- and endoneurial veins caused by a compressed nerve 2 ; (7) extrinsic compressive masses can be detected on US as accessory muscles, ganglion cysts, or related soft-tissue tumors. Routine scanning of the full length of the nerve, “lift” technique, should be done systemically 3 ; and (8) dynamic flexion-extension of the fingers shows reduced transverse nerve mobility under the flexor retinaculum due to compression. 3
MRI diagnostic criteria
Diagnostic criteria for MRI include the following: (1) hyperintense signals are noted in nerve fibers in fluid-sensitive sequences; (2) an increased nerve caliber is observed at the level of the pisiform bone; (3) volar bowing of the palmar aponeurosis is observed, with nerve flattening at the hook of the hamate level; (4) denervation edema of the muscles followed by atrophy could be an uncommon sequela in severe cases of CTS and chronic conditions. This can also be observed in cases of distal carpal tunnel entrapment of the recurrent branch; and (5) Carpal tunnel masses may involve pathognomonic lesions such as lipomatosis of the nerve or peripheral nerve soft-tissue neoplasms (Case 1).
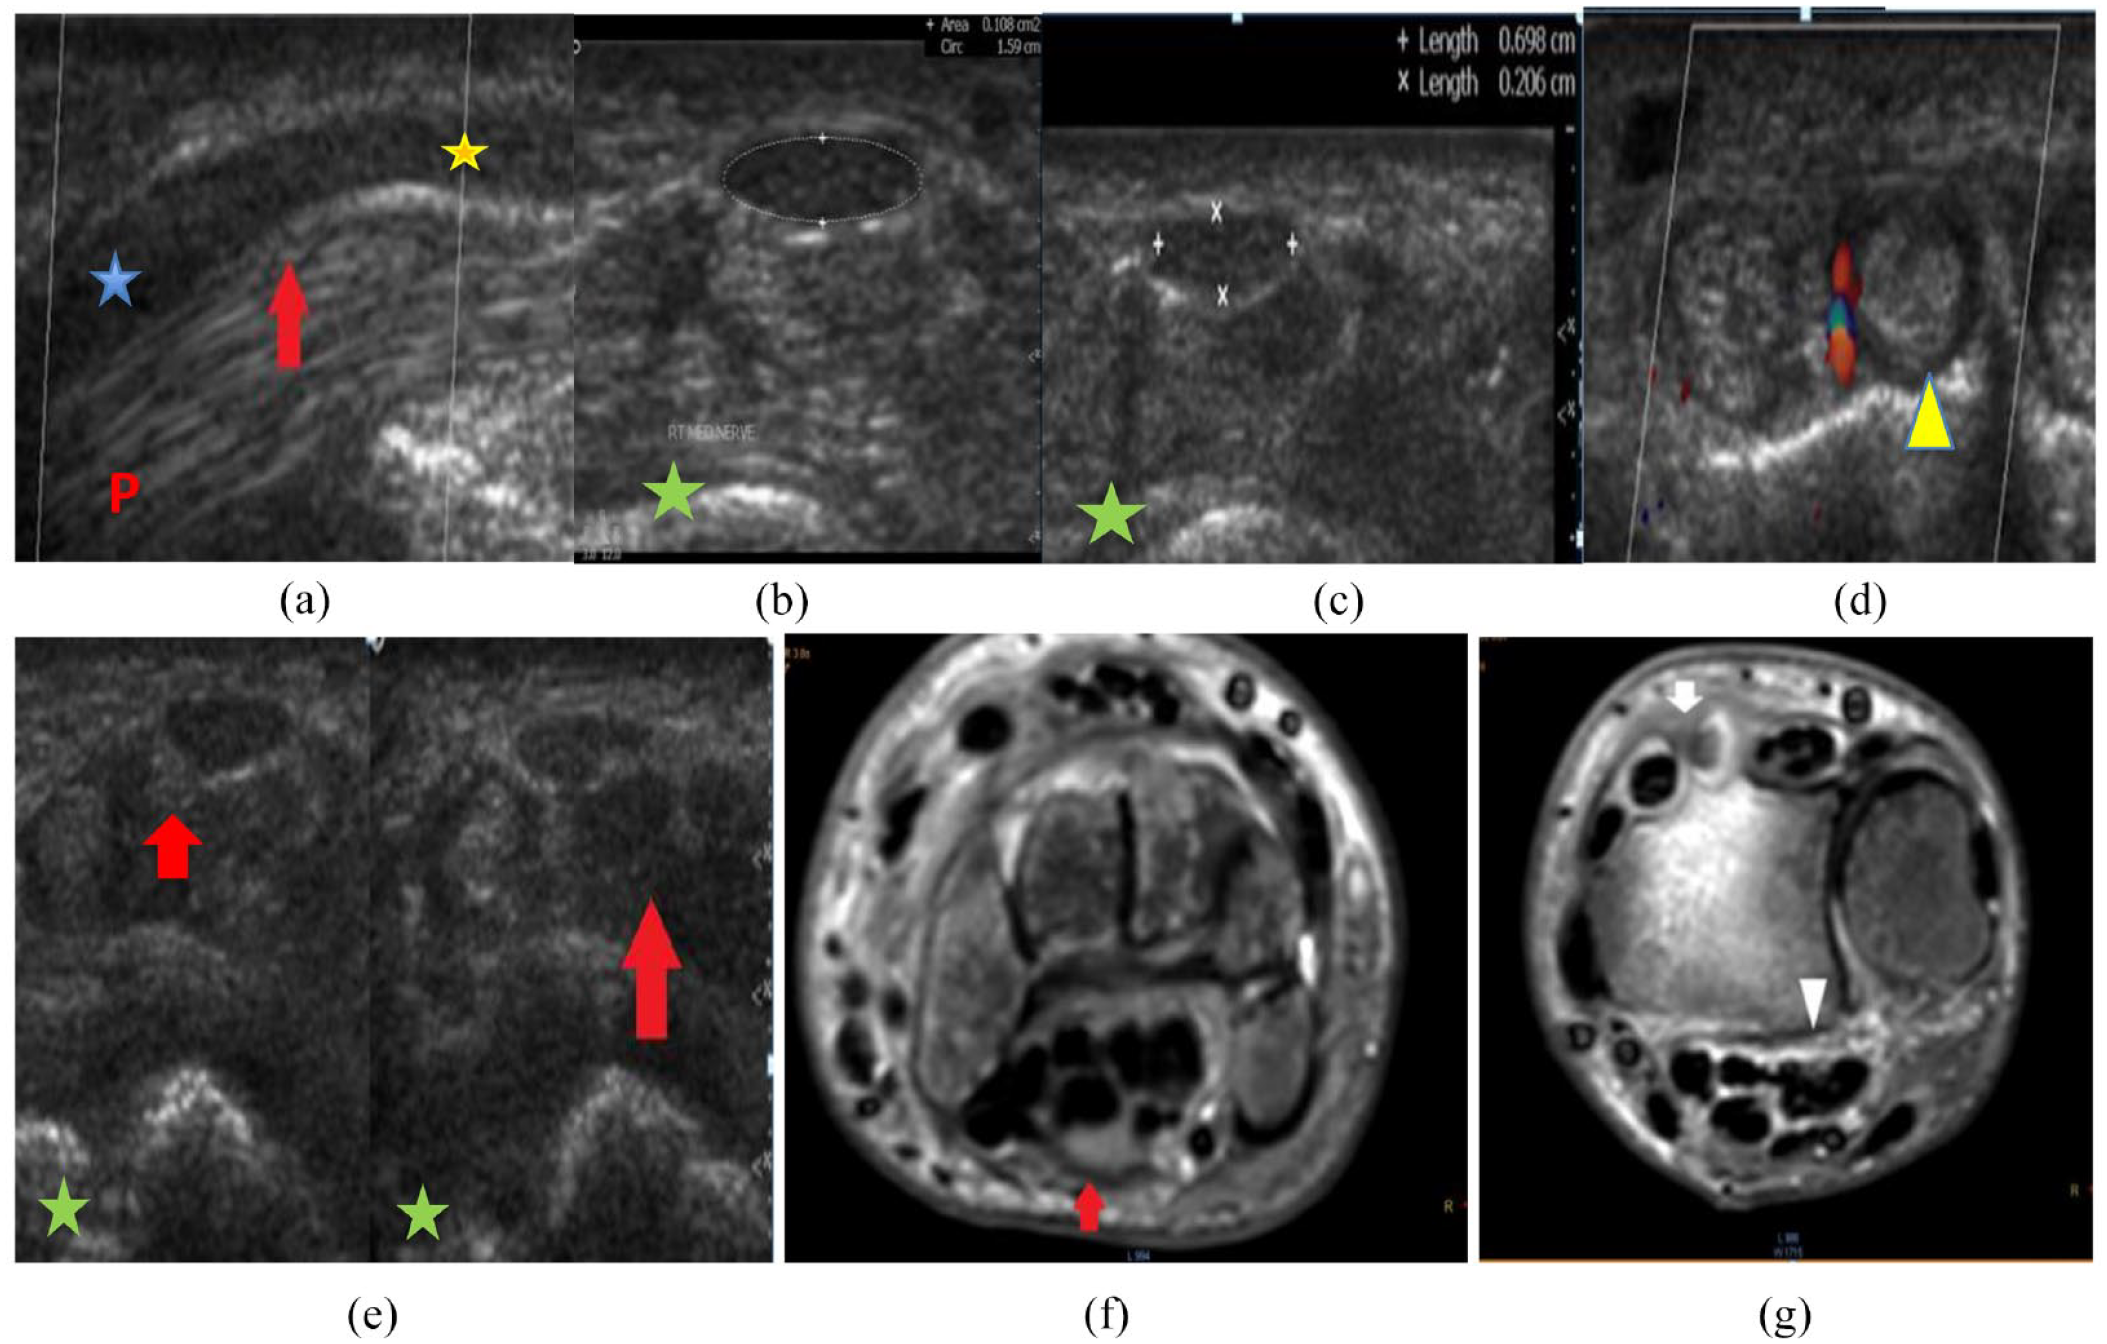
A 43-year-old diabetic housewife presented with right wrist pain and moderate median neuropathy was detected on electromyography. (a) The longitudinal section of the carpal tunnel shows diffuse decreased median nerve echogenicity with caliber changes, swelling at the proximal tunnel with flattening at its distal part, and caliber transition at its midpoint (red arrow). (b and c) The transverse section (TS) of the tunnel shows an increased cross-sectional area of the nerve at the proximal tunnel (b) measuring 10.8 mm2 (normal, up to 10 mm2) and flattening of the nerve at distal tunnel (c) with a flattening index of 3.45 (normal, less than 3). (d) The TS of the tunnel shows that the deep wrist extensor tendons are thickened and swollen, with surrounding synovial hypertrophy and increased vascularization of tenosynovitis. (e) The TS of the tunnel shows diffuse flexor tendon swelling and decreased echogenicity with blurred fat planes (red arrow) and thickened overlying skin. (f) Axial T2 STIR images of the carpal tunnel show swelling of the median nerve with a mildly increased signal (red arrow). Of note is the mosaic pattern of the carpal bone marrow signal (sympathetic reflex). (g) Axial T2 STIR images show the interstitial tunnel and edema fluid around the flexor tendons (arrowhead) with minimal fluid collection and synovial hypertrophy around the tendons of the second and third extensor groups (white arrow).
Methods
This prospective study was conducted on 32 patients who visited the Radiology Department of the Ain Shams University Hospital from March to December 2021. The study was approved by the Faculty of Medicine, Ain Shams University Ethical Committee (approval number, (Fmasu R163/2021)). All patients presented with CTS and were diagnosed on the basis of electrophysiological tests. Written informed consent was obtained from all participants.
Inclusion criteria
Patients who presented clinically with CTS and who had a positive electrophysiological test of isolated median nerve neuropathy at the carpal tunnel level were included.
Exclusion criteria
Patients with (1) previous surgical intervention of the median nerve or wrist joint, (2) a complaint of brachial plexus entrapment syndromes (to exclude high-level entrapment), (3) contraindications to MRI such as an implanted pacemaker, (4) evidence of polyneuropathy or radiculopathy, and (5) associated peripheral neuropathy as revealed by electrodiagnostic studies were excluded.
Imaging protocol
Superficial US of the wrist joint was performed by an experienced musculoskeletal imaging radiologist with 10 years of experience in musculoskeletal imaging. A superficial ultrasonography set (Toshiba Xario 200 and Philips iU22) and a resolution probe of 7.5–10 MHz frequency was used. Patients were examined in a seated position facing the examiner, with their arms extended and forearm in a supinated position. The wrist was examined on an examination table. Both the metacarpophalangeal and proximal interphalangeal joints were mildly flexed. Imaging of both the long and short axes of the median nerve was performed using the carpal bones as landmarks.
MRI using a 1.5-Tesla scanner (Achiva-Philips, Germany) was performed within 1 week of US to ensure no interval changes. A phased array surface coil was used in the wrist region. A small field of view (5–10 cm) was applied for high spatial resolution using the following sequence: (1) axial T1 SE-weighted image (2–3 mm) for anatomical baseline and isotropic reconstruction; (2) axial T2 FS and T2 SPAIR-weighted images (3 mm) for pathological correlation; (3) three-dimensional SPAIR images (1 mm) with sampling perfection and application-optimized contrast post-acquisition processing, including MPR, MIP, and curved planar reconstruction; and (4) three-dimensional DW PSIF images with fat suppression (reversed fast imaging with steady-state free precession) and selective suppression of all moving structures such as vessels.
No contrast media were required, unless a superadded inflammation was suspected.
Image analysis
MRI and US images were assessed for the following measurements and criteria for CTS diagnosis, depending mainly on the three measurements described by Buchberger et al. 8 : (1) the CSA proximal to the tunnel (scaphoid pisiform level), normal less than 10 mm2; (2) the flattening index, calculated as the ratio between the nerve transverse axis and the Antero-posterior (AP) axis (flattening ratio; D1/D2), which should be less than three; (3) the bowing index of the flexor retinaculum measured at the hamate-trapezium level: a line was drawn connecting the tubercle of trapezium and hook of the hamate, and the distance from this line to the most anterior part of the transverse carpal ligament was calculated. The distance is less than 4 mm and the bowing index indicates the AP distance/transverse distance and should not exceed 15%; and (4) textural changes in the nerve echo on US, T2 signal intensity, and fasciculate patterns of the compressed median nerve on MRI, as well as the innervated muscles, were reported. The compressed nerve becomes uniformly hypoechoic on US and shows a high T2 signal on MRI, thereby disrupting the fasciculate pattern. The presence or absence of a mass was also noted.
Statistical analysis
Sex, age, and the number of right and left wrists examined were tabulated. The sample size was calculated using PASS 11.0, based on studies by Fowler et al. 14 and El-Shaboury et al. 15 A total sample size of 32 patients achieved a 13% power to detect a change in sensitivity from 0.5 to 0.776 using a two-sided binomial test, and 87% power to detect a change in specificity from 0.5 to 0.868 using a two-sided binomial test. The target significance level was set at p < 0.01. The actual significance level achieved by the sensitivity test was 0.0078 and that achieved by the specificity test was 0.0072. The prevalence of this disease is 0.276.
The diagnostic agreement between US and MRI in patients with CTS was tabulated using the CSA, bowing, and flattening indices, and nerve textural changes and underlying causes were identified. All statistical tests were performed using IBM SPSS (Statistical Package for the Social Sciences) version 20. Quantitative analyses are presented as means and standard deviations and qualitative analyses are presented as numbers and percentages. The chi-square test was used to compare qualitative variables.
A one-way analysis of variance was used to determine whether any statistically significant differences existed between the means of three or more independent (unrelated) groups and whether any of those means were statistically significantly different from each other. Pearson’s formula was used to record the quantitative variable relationships.
Results
Demographic data
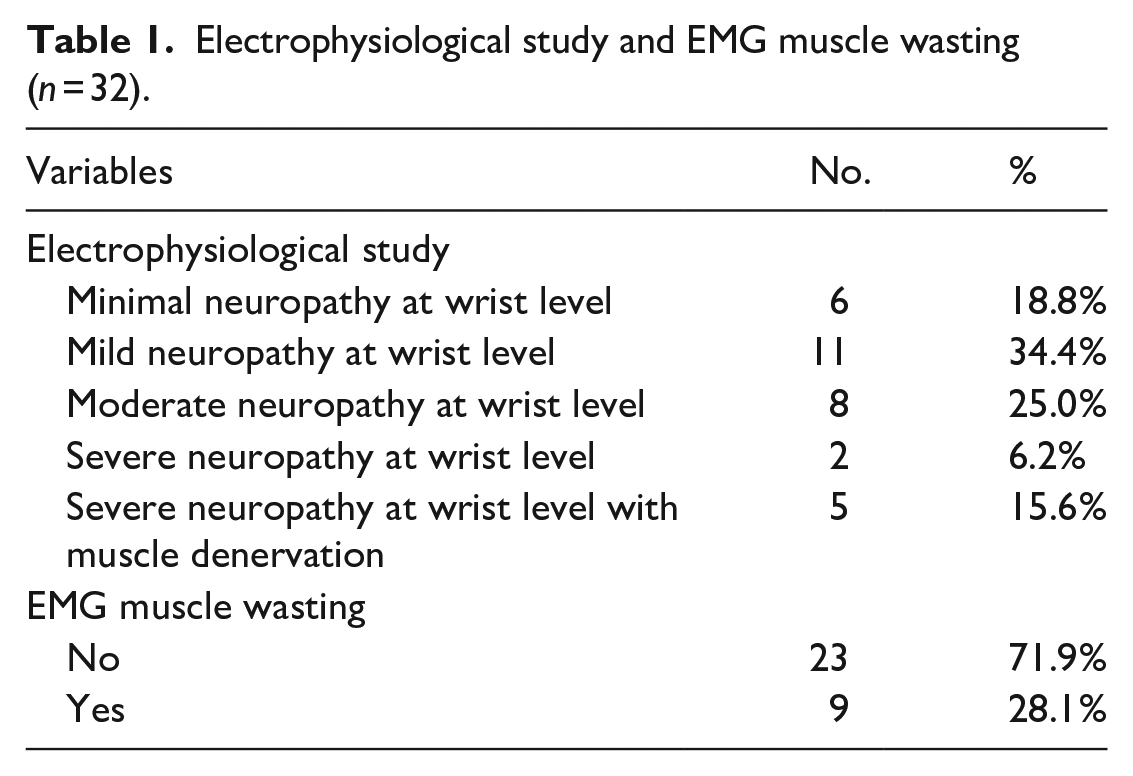
Thirty-two patients diagnosed with CTS, aged from 18.00 to 67.00 years (mean, 43.25 years), were enrolled in the present study. Diagnoses were confirmed by electrophysiological testing using electromyography and nerve conduction velocity. More than one-third of the patients had mild CTS (34.4%), approximately one third were diagnosed with minimal neuropathy, and a quarter were diagnosed with moderate neuropathy. Wasting of the thenar muscle was observed in more than a quarter (28.1%) of the patients (Table 1).
Electrophysiological study and EMG muscle wasting (n = 32).
Twenty (62.5%) of the participants were female and 12 were male. Of the patients, 26 (81.2%) had right-sided affection and six had left-sided affection. Sixteen participants were housewives, 11 were handworkers, two were gymnasts, two were employees, and one was a nurse. All patients complained of wrist pain and 21 (65.6%) complained of hand paralysis (Table 2).
Characteristics and clinical picture in the studied participants (n = 32).
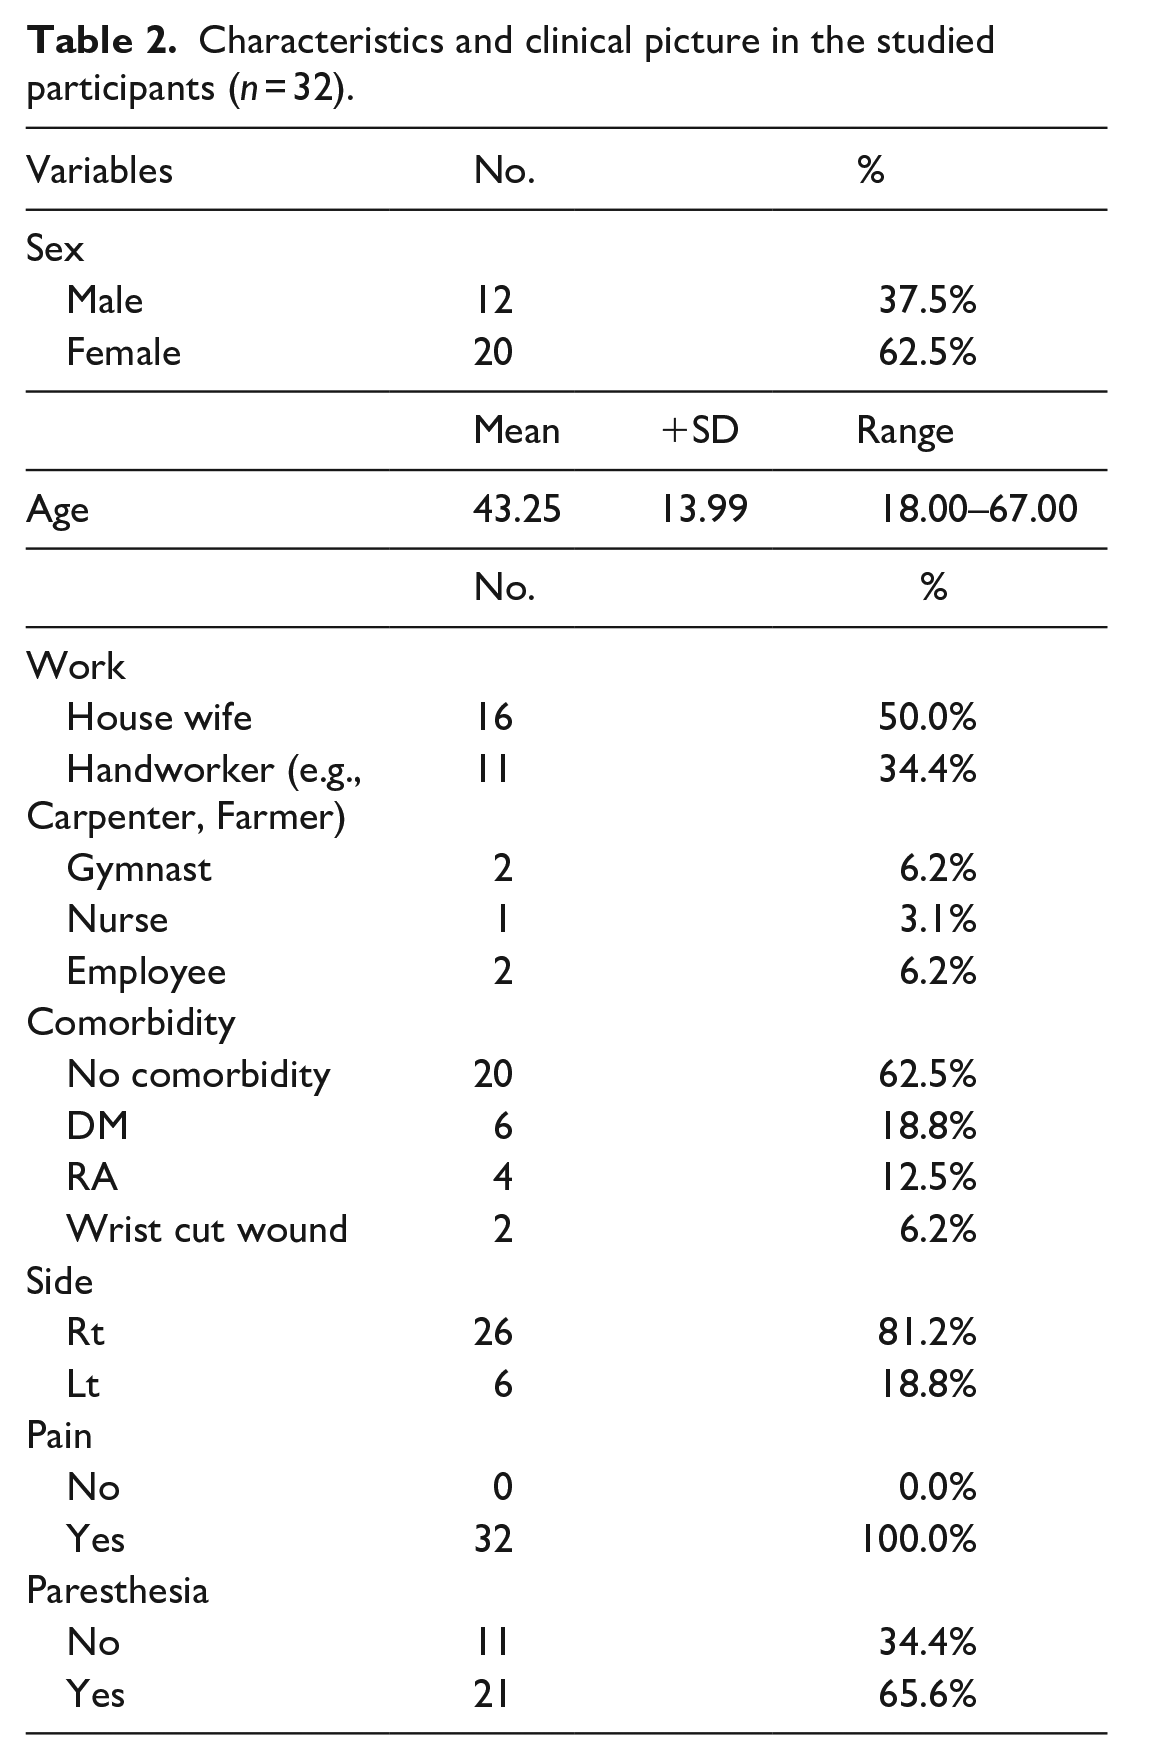
Most patients had no associated comorbidities (20 of 32 (62.5%)). Among patients with comorbidities, diabetes mellitus was the most common, followed by rheumatoid arthritis. Two patients had cut wounds on the wrist.
US findings
Increased CSA was observed in 30 of the 32 (93.7%) patients, whereas 59.4% of them showed synchronous increases in both the distal nerve flattening and flexor retinaculum bowing indices. On US, decreased nerve echotextures were observed in 29 of the 32 (90.6%) patients and changes in muscle atrophy were observed in two. US was used to detect the underlying cause in ten patients, six of whom had flexor tenosynovitis, two of whom had synovial hypertrophy, and two of whom had post-traumatic neuroma-in-continuity (Table 3; Figure 1).
U/S findings in the studied participants (n = 32).


Causes of CTS based on ultrasound findings.
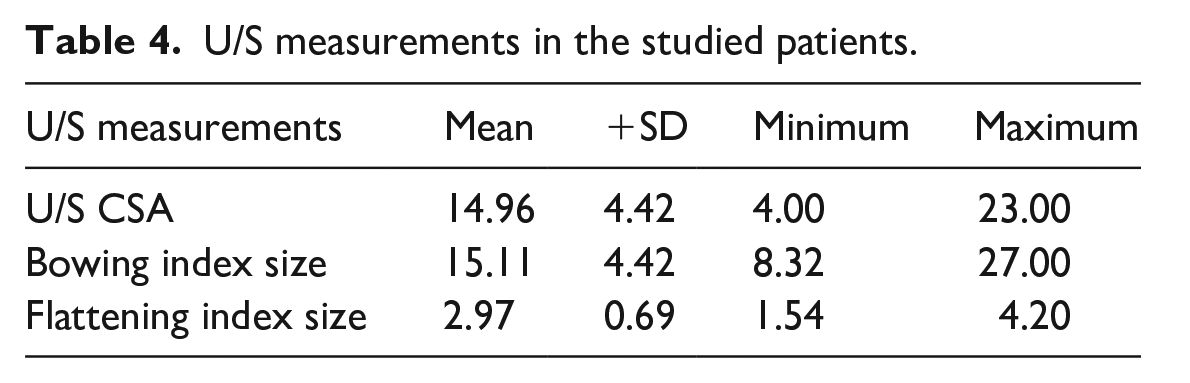
The mean CSA was 14.96 mm2 ± 4.2 (range, 4–24 mm2), the mean bowing index was 15.11 ± 4.42 (range, 8.32–27.00), and the mean flattening index was 2.97 ± 0.69 (range, 1.54–4.20; Table 4).
U/S measurements in the studied patients.
MRI findings
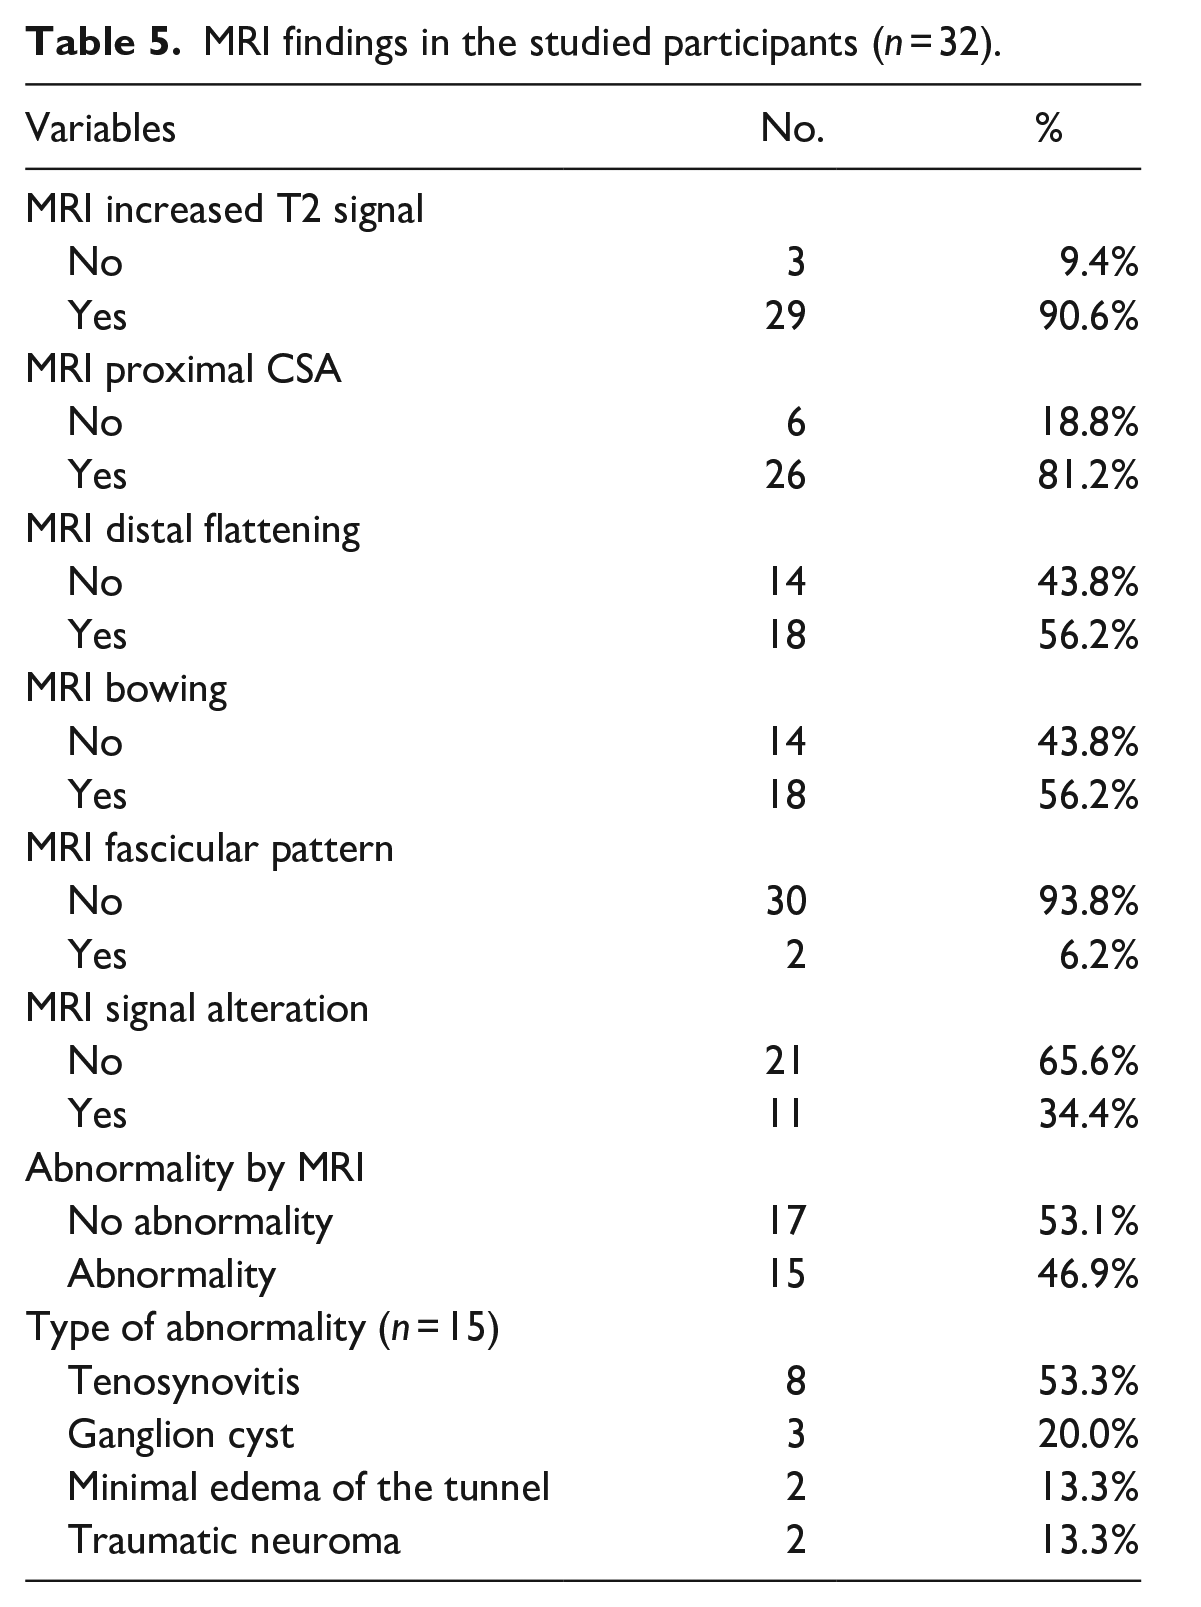
MRI detected an increased CSA in 26 of the 32 (81.2%) patients; distal tunnel nerve flattening and a bowed flexor retinaculum were observed in 18 (56.2%) patients. An increased T2 signal of the nerve was observed in 29 of 32 (90.6%) patients, with only three patients showing a disrupted fasciculate pattern. Muscle denervation signal alterations were observed in 34.4% of patients. Underlying tunnel abnormalities were detected in 15 patients: eight had flexor tenosynovitis, two had traumatic neuroma, three had ganglion cysts, and two showed deep interstitial edema of the carpal tunnel (Table 5; Figure 2).
MRI findings in the studied participants (n = 32).

Causes of CTS based on magnetic resonance imaging findings.
Analysis of agreement between MRI and US measurements
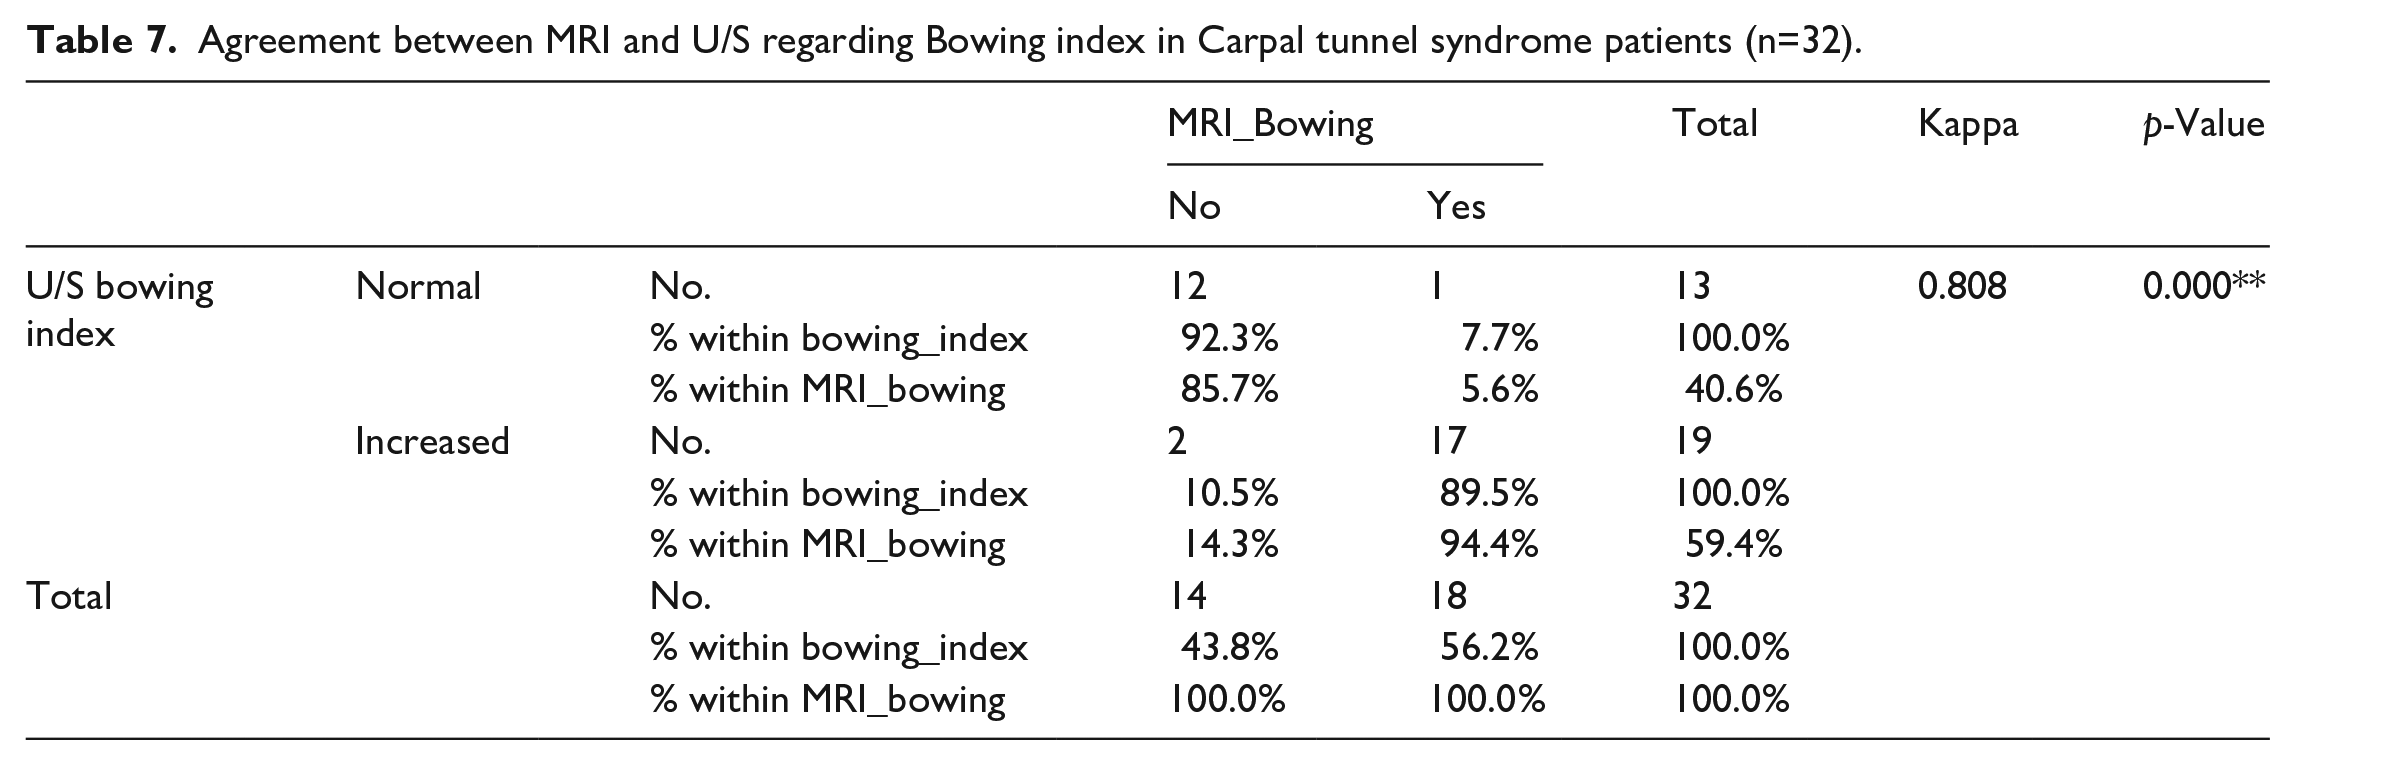
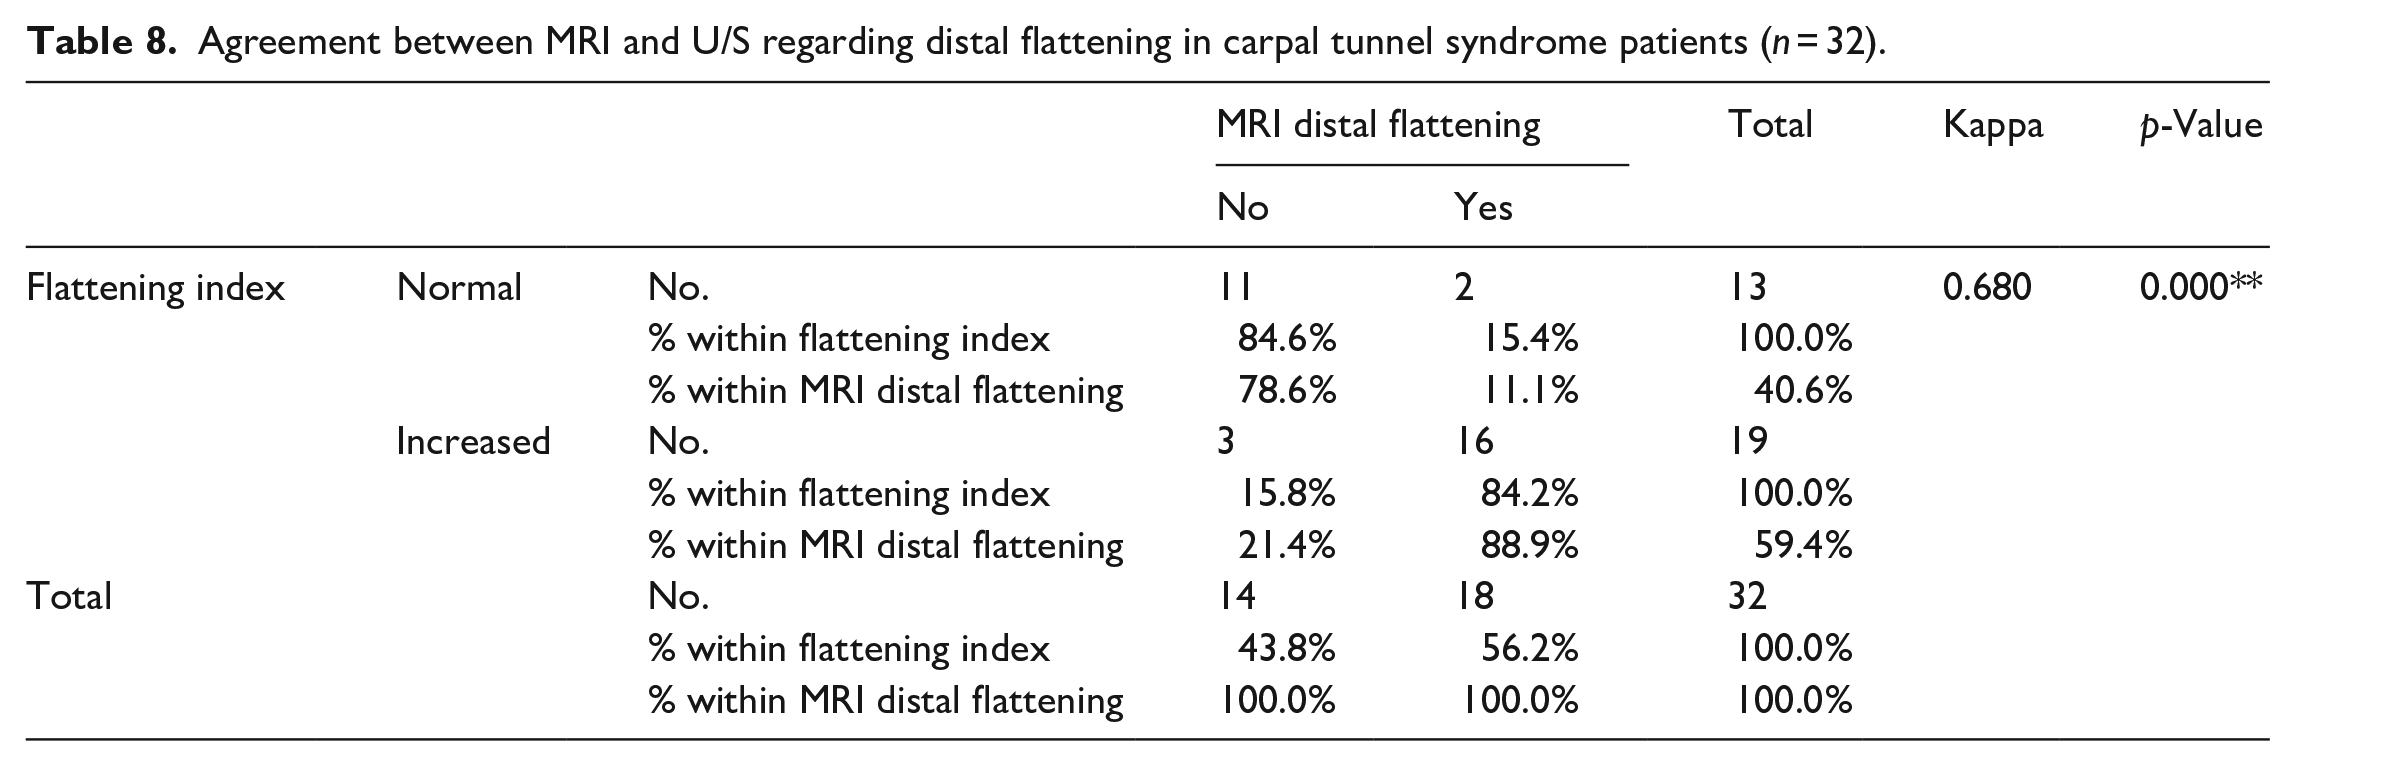
Increased CSA on both MRI and US was positive in 93.8% and 81.2% of patients, respectively, indicating a significantly higher correlation on US than on MRI (p = 0.02). An increase in both the bowing and flattening indices was detected in 59.4% of patients on US compared with 56.2% of patients on MRI, indicating a significant statistical variability (p = 0.001; Tables 6, 7 and 8).
Agreement between MRI and U/S regarding CSA in carpal tunnel syndrome patients (n = 32).

Agreement between MRI and U/S regarding Bowing index in Carpal tunnel syndrome patients (n=32).
Agreement between MRI and U/S regarding distal flattening in carpal tunnel syndrome patients (n = 32).
Underlying local causes were detected in 31.25% of patients on US compared to 46.80% of patients on MRI. Two diagnoses of patients with tenosynovitis and three of patients with ganglion cysts were missed on US, indicating a statistically significant finding (p = 0.001; Table 9).
Agreement between MRI and U/S regarding diagnosis of cause of carpal tunnel syndrome (n = 32).

Sensitivity of U/S = 10/32*100 = 31.25%.
Sensitivity of MRI = 15/32*100 = 46.8%.
Discussion
The term “entrapment syndrome” describes neuropathic changes due to local structural abnormalities or intrinsic nerve lesions. 16 Electrophysiological testing and clinical examinations are cornerstones for diagnosing CTS and can be used as the gold standard to detect the efficacy and sensitivity of other diagnostic modalities. 17 In our study, all patients were diagnosed based on clinical signs that were confirmed by electrodiagnostic examinations.
US is used as a noninvasive modality for assessing nerve entrapment and offers the advantages of real-time, high-resolution, low-cost, and dynamic imaging. However, the drawbacks of this modality are operator dependence and, sometimes, difficulty arising from images that are degraded by shadowing and tissue distortion, as in cases of scarring and local injury. 18 Compression of the median nerve in the carpal tunnel leads to flattening of the nerve and swelling of its proximal portion, causing endoneurial edema. Thus, CSA is used as a measurement for diagnosing CTS; however, other measurements, including the flattening ratio and bowing index, were later added by Buchberger et al. 8
In the current study, we aimed to assess the measurements and criteria of both US and MRI for the diagnosis of CTS, based mainly on the three measurements assessed by Buchberger et al. 8 We also aimed to determine the agreement between the use of US and magnetic resonance for the diagnosis of CTS.
The CSA cutoff value determined in previous studies has ranged from 6.1 to 10.4 mm2, with a 4.3 mm2 difference in both normal values (4.3 mm2): this value represents 51% of the normal CSA of the median nerve (8.4 mm2). 19 Yesildag et al. 20 concluded that US measurements of median nerve CSA were the most predictive measurements for CTS, with a cutoff value of 10.5 mm2 at the proximal tunnel level, and provided a diagnostic sensitivity and specificity of 89% and 94.7%, respectively. Compared to Buchberger et al., 8 who reported a mean CSA of 14.5 mm2 in patients with CTS and one of 7.9 mm2 in the controls, Duncan et al. 21 reported a mean CSA in patients with CTS and controls of 12.7 mm2 and 7 mm2, respectively. Such variability in the results may be attributed to different study designs, measurement techniques, or the exclusion of patients with mild electrodiagnostic test results.
Buchberger et al. 8 recorded the mean median CSA of the proximal tunnel nerve to be 14.5 mm2 (range, 8.8–20.5 mm2; SD, 3.8 mm2). The mean flattening ratios were 2.7 (range, 2.0–3.7; SD, 0.4) in the pisiform bone and the mean bowing of the flexor retinaculum was 3.7 mm (range, 2.0–6.0 mm; SD, 1.1 mm). In our study, all patients diagnosed with CTS fell in the range described by Buchberger et al., 8 with a mean CSA of 14.96 mm2 ± 4.2 (range, 4–24 mm2). The mean bowing index in the current study was 15.11 mm2–4.42 mm and ranged from 8.32 to 27.00 mm; the mean flattening ratio was 2.97 ± 0.69 and ranged from 1.54 to 4.20. The bowing index was high in our study because most of our patients had diabetes and a high percentage showed tenosynovitis, interstitial edema of the tunnel, and tissue swelling.
Sonographically, we found that CSA was the most frequently occurring parameter, as it was positive in 93.7% of our patients, followed by a decreased nerve echotexture (90.6%). Unfortunately, no study has evaluated the diagnostic capabilities of the retinacular bowing index and flattening index of the median nerve as separate diagnostic parameters for CTS. However, in the present study, these indices were recorded as positive in 59.4% of patients on US, indicating a relatively low predictive value compared to CSA and nerve echotexture changes.
MRN is an excellent modality for soft-tissue contrast, enabling subtle abnormalities to be detected as T2 increases the signals within nerve fibers and fasciculate patterns. However, isolated MRI of the nerve with a high T2 signal showed a specificity of less than 40%. Therefore, using additional MRN signs and parameters of neuropathy—such as an enlarged nerve (>10–11 mm2) proximal to the tunnel and at the level of the pisiform bone, nerve flattening at the level of the hook of the hamate at the distal tunnel, and palmar bowing of the retinaculum—improves MRN specificity in detecting CTS. Effaced carpal tunnel fat and thenar muscle denervation edema may be secondary findings of a compressed median nerve. 19 Pasternack et al. 22 demonstrated that, using MRI as a diagnostic tool, an increased T2 signal, CSA, distal nerve flattening, and retinaculum bowing were the most frequently occurring signs of CTS. Our study showed that the occurrence rates of these parameters were 90.6%, 81.2%, 56.2%, and 56.2%, respectively.
Kim et al. 1 concluded that MRI is more sensitive in detecting muscle denervation changes in the form of high signal intensity. These changes progress from acute (edema-like T2 signal intensity) to subacute (muscle edema with early fatty changes and/or atrophy) to chronic (muscle atrophy and fatty changes). In addition to facilitating characterization of space-occupying lesions, fibrotic changes and thickened fasciae were observed. We agree with Kim et al., 1 who concluded that using US, muscle denervation changes could only be diagnosed in two cases, while the use of MRN enabled muscle denervation changes to be detected in 34.4% of patients and underlying tunnel abnormalities to be detected in 15 of 32 patients. These findings demonstrate that MRN has higher sensitivity in detecting secondary muscle changes in CTS than US does (Case 2).

A 46-year-old male handworker presented with right upper limb pain but had normal cervical magnetic resonance imaging findings. Electromyography shows moderate right median neuropathy at the level of the wrist. (a) Axial images of T2W STIR show right median nerve swelling with a bright signal (green arrows). (b) Axial STIR images of the distal tunnel show a flattened nerve with a flattening index of 3.41 (normal, up to 3). (c) An axial T2W image shows the volar bowed flexor retinaculum with a bowing index of 20.9% (normal, up to 15%). (d and e) Coronal three-dimensional PDW-SPACE-SPAIR (d) and axial STIR images (e) showing deep articular ganglion cysts (yellow arrow) related to the scaphotrapeziotrapezoid joint compressing the carpal tunnel content volume that were not detected sonographically. (f) A sagittal reconstructed three-dimensional PDW-SPAIR image shows caliber changes in the median nerve, proximal swelling (red arrow), and distal flattening (blue arrows) with a diffuse bright signal.
In our study, we tabulated agreement between MRI and US regarding the three parameters of CSA, and bowing and flattening indices; we found that, using these three parameters, CTS could be better detected with US than with MRI. High significant statistical variability (p = 0.001) was observed.
US was able to detect the cause of entrapment in approximately 31.25% of cases, and approximately 68.8% of cases were considered to have idiopathic causes. However, MRN was able to detect the cause of entrapment in approximately 46.80% of cases and approximately 53.1% of them were considered to have idiopathic causes. MRI was able to diagnose muscle denervation as a secondary sequela of nerve entrapment (Case 3). Therefore, in cases in which primary nerve abnormalities could not be visualized using US, the detection of innervated muscle MRI signal changes could be used to diagnose and locate the nerve lesion, indicating a high sensitivity of MRN in the detection of secondary causes and muscle denervation changes, with a highly statistically significant difference (Case 4).

A 58-year-old female with diabetes presented with progressive pain in her right hand, numbness, and limited movement. Electromyography revealed severe axonal right median nerve neuropathy affecting both the sensory and motor branches at the wrist level, with evidence of active muscle denervation. (a) The longitudinal section image shows textural (decreased echogenicity) and caliber changes in the right median nerve (proximal swelling and distal flattening; red arrows). (b) The transverse section (TS) images show an increased cross-sectional area in the proximal tunnel measuring 22 mm. (c) The TS image of the wrist shows that the thenar muscle is bulky, with increased echogenicity denoting muscle edema (red arrow). (d) The STIR axial images of the right wrist show the swelling of the median nerve with a diffuse high signal (red arrow). (e) The STIR TSE axial image shows the swelling of the right thenar muscle and high-intensity denting of acute denervation muscle edema.

A 44-year-old male patient with a history of surgically repaired right wrist cut wounds involving the flexor tendons complained of pain in the hand and limited movement. (a) The transverse section ultrasound image obtained at the carpal tunnel level shows the swelling of the median nerve with heterogeneous echogenicity of minor neural disruption and an increased cross-sectional area (blue arrows). (b) The longitudinal section (LS) just proximal to the tunnel shows a small irregular hypoechoic soft-tissue lesion (red arrows) along the course of the median nerve just proximal to its entry into the tunnel, which represents the neuroma-in-continuity at the site of injury. Note the heterogeneously thickened US appearance of the nerve in the tunnel (green arrow). (c) The LS images show synovial hypertrophy and edema around nerves and tendons (red arrows). (d) Axial STIR TSE images show a nearly rounded neuroma of increased signal intensity along the course of the median nerve just proximal to where the nerve enters the tunnel (green arrows), with surrounding interstitial and S.C tissue edema. Notably, an intact fasciculate pattern is visible. (e) A T1W Fat-sat post-contrast axial image shows the homogenous swelling contrast enhancement (green arrow). (f) The axial STIR-TSE image shows the swelling of the median nerve in the tunnel with high signal intensity (blue arrow). Swelling of the thenar muscle and the high signal intensity of acute denervation changes (red arrow) are not detected sonographically.
Our results are in agreement with those of Martinoli et al. 6 who found that the findings of US were comparable to those of MRN in the diagnosis of CTS. However, MRI is superior to US in recognizing subtle changes because neural signal changes are caused by edema and changes in blood perfusion. In addition, we agree with Thawait et al., 23 who showed that MRN could support clinical data and provide information about the nature of the underlying nerve lesion, defining its site and extent with good intraneural fasciculate pattern assessment, and providing an overview of the surrounding tissue and regional muscle abnormalities.
The limitations of this study were as follows. First, the small sample size was not verified by statistical analysis, and larger multicenter studies are recommended. Second, only one consultant was responsible for reading and measuring the parameters. Future studies involving two or more readers are recommended to assess inter-reader agreement and improve the accuracy of the study.
Conclusions
We conclude that US examination can be used as the first imaging step after physician evaluation. In evaluating CTS and determining its cause, results achieved with US are comparable to those achieved with electrophysiological studies. MRN examination was the second step in detecting secondary causes in patients with suspected muscle denervation changes that could not be detected by US, or in cases where equivocal findings occur.
Footnotes
Acknowledgements
Authors’ contributions
MGA collected data, wrote the paper, and organized the manuscript. EFD conceived and designed the analysis, shared it in writing, and contributed to the data and analytical tools. All authors have read and approved the manuscript.
Availability of data and material
The authors declare that all other data supporting the findings of this study are available for this article.
Declaration of conflicting interests
The authors declared no potential conflicts of interest with respect to the research, authorship, and/or publication of this article.
Funding
The authors received no financial support for the research, authorship, and/or publication of this article.
Ethics approval and consent to participate
Written consent was obtained from all participants, and the study was conducted in accordance with, and approved by, the Ethics Committee of the Faculty of Medicine at Ain Shams University (approval number, (Fmasu R163/2021)). All patient data were de-identified and the research involved only MRI and US images.
Informed consent
Written informed consent was obtained from all participants.
Trial registration
Not applicable.