
Abstract
Objective:
The aim of this study is two fold. First, it describes the temporal trends of malignant melanoma mortality from 2000 to 2016 in Ecuador. Second, it analyzes the spatial clusters of high mortality rates due to malignant melanoma in the country, from 2011 to 2016.
Methods:
This is an ecological study; we included all death certificates of malignant melanoma from the National Institute of Statistics and Census database in Ecuador from 2000 to 2016. We calculated crude mortality rates and age-standardized mortality rates, all rates are expressed as deaths per 100,000 population. In order to assess the trend of malignant melanoma rates, we obtained average annual percent changes through Joinpoint regression analysis. Spatial scan statistics were used to identify high-risk clusters and the spatial autocorrelation was evaluated through a global Moran index.
Results:
In Ecuador, between 2000 and 2016, malignant melanoma caused a total of 958 deaths. Crude mortality rates increased significantly (annual percent change = 4.8%; 95% confidence interval: 2.6–7.0), the age-standardized mortality rate also increased (annual percent change: 2.9%; 95% confidence interval: 0.5–5.4). The most likely cluster included 19 cantons and the second most likely cluster included 10 cantons, located in the Highlands region. The Global Moran I index for the study period shows a positive spatial autocorrelation (0.32; p = 0.001).
Conclusion:
Mortality due to malignant melanoma in Ecuador significantly increased over the 17-year study period; the spatial analysis and spatial autocorrelation indicates the presence of high-risk occurrence clusters in the Highlands region of the country.
Introduction
Malignant melanoma (MM) represents a challenge for public health care systems around the world due to increasing incidence in recent decades. 1 In 2016, 282,000 (95% uncertainty interval (UI), 243,000–314,000) cases of MM were diagnosed worldwide, representing 1.6% of all cancer cases. 2
According to the Global Burden of Disease Study, deaths from MM showed a significant increase of 25.9% between 2006 and 2016. While age-standardized death rates showed a non-significant decrease of –2.9, within the same period. 3
The world regions with the greatest burden from age-standardized MM mortality rates are Australia at 5.6 (95% confidence interval (CI), 4.08–7.91), North America at 2.3 (95% CI, 1.67–3.34), and Europe at 2.3 (95% CI, 1.80–2.91). In contrast, regions like the Asian Pacific and South Asia reported the lowest rates at 0.3 (95% CI, 0.23–0.42) and at 0.2 (95% CI, 0.20–0.29), respectively. 4 In 2015, Andean Latin America age-standardized incidence rates resulting from MM were 2.82 (95% CI, 2.37–3.54), with an age-standardized mortality rate of 0.7 (95% CI, 0.65–0.94), and an age-standardized disability-adjusted life year (DALY) rate of 16.7 (95% CI, 14.46–20.92). 4
Risk factors for developing MM include fair skin or hair, increased exposure to sun or other forms of ultraviolet (UV) radiation, immunosuppression, multiple nevi, family history of MM, and genetic susceptibility. 5 The most commonly known MM susceptibility for some families is due to mutation in one of the known high-penetrance predisposition genes such as CDKN2A, CDK4, BAP1, POT1, ACD, TERF2IP or TERT. 6
It is not clear how much MM impacts Ecuador—most recent data from the National Tumor Registry dates from 2012 and does not include all cities in the country. According to the World Cancer Observatory, the incidence rate of MM in Ecuador was 2.2 per 100,000 population (392 cases) in 2018, in the 19th place in the list of incidence by cancer site in the country. 7 The National Institute of Statistics and Census (INEC), on the contary, issues an annual report of mortality classified according to the International Statistical Classification of Diseases (ICD-10), reported 102 deaths of which were attributed to MM in 2016. 8
In addition, Ecuador is crossed from north to south by the Andes Mountains, and is located on the equatorial land line, with territory in both hemispheres. At higher altitudes, the intensity of UV radiation increases by 10%–12% per each 1000 m that increase the altitude; and the closer to the equator, the more intense is UV radiation. 9 No published study has analyzed the trend and geographic distribution of MM morality in Ecuador.
This study aims to describe the temporal trend in MM mortality from 2000 to 2016 and to analyse the spatial distribution and autocorrelation due to MM mortality in Ecuador from 2011 to 2016.
Methods
Data sources
We performed an ecological study, data were collected from the INEC database in its “Statistical Reports” section: live birth, death, and fetal death. 10 Death registries include “underlying cause” of death coded according to the ICD, which we used for our temporal and spatial analysis. Registries matched ICD-10 code C43 for MM, for the period 2000 to 2016. Finally, we extracted population data from estimates of 2001 and 2010 censuses conducted by the INEC. 11
Study area
Ecuador is located in western South America bordering the Pacific Ocean, and it has a total area of 283,561 km 2 . 12 It is geographically divided into four regions (the Amazon, the Highlands, the Coast, and the Galapagos Islands) and is politically split into 24 provinces, which, in turn, are split into 224 cantons. INEC reported a projection of population growth from 12,531,210 in 2000 to 16,528,730 in 2016. 13
According to the 2015 World Population Aging report from the United Nations, Ecuador increased the percentage of those aged above 60 from 7.2% in 2000 to 9.8% in 2015, which corresponds to the 5th–10th percentile (moderate aging). 14 , 15
Statistical analysis
Crude mortality rates and specific mortality rates by sex were calculated. We calculated age-standardized mortality rates (ASMR) using the direct standardization method, through the SEGI world standard population. 16 All rates are expressed as deaths per 100,000 population. Microsoft Excel 2010 (Microsoft Office Professional Plus 2010) was used to calculate mortality rates and standard errors.
Time trends
We used the Joinpoint regression model to identify the years when there were significant changes in ASMR and crude mortality rates, for the period 2000–2016. Joinpoint regression analysis fits a series of joined straight lines on a logarithmic scale; straight line segments are joined at “Joinpoints,” where mortality trend changes with statistical significance, we used a log-linear model for MM mortality rates. 17
The analysis starts with the minimum number of joinpoints (0 joinpoint) and tests for model fit with a maximum of two joinpoints, the program sought the simplest model that fits by the weighted least-squares method. The slope of each line segment, of the best-fitting model, was expressed as the annual percentage change (APC) and average annual percent change (AAPC). Significance tests were performed using the Monte Carlo permutation technique. We considered p statistically significant when below a level of 0.05. Our team used the Joinpoint regression program, version 4.4.0.0, from the Surveillance Research Program of the US National Cancer Institute, for the statistical analysis. 17
Spatial analysis
We identified high-risk spatial clusters of MM mortality in Ecuador during the period 2011–2016 using retrospective Kulldorff’s spatial scan statistics. Under the statistical assumption that mortality cases follow a Poisson distribution, we used a discrete model. The 224 cantons of Ecuador were our spatial unit of analysis, with a maximum spatial cluster size of 50% of the population at risk, and a maximum temporal cluster size of 50% of the study period. The most likely or primary cluster and secondary clusters were detected through the log likelihood ratio (LLR) test. 18 The statistical significance of these clusters was calculated through Monte Carlo simulations. We considered p statistically significant when below 0.05. We analyzed spatial clusters using SaTScan software 19 and displayed them in cartographic representations created by free software QGIS, version 2.18.14.
Spatial autocorrelation
We used the Global Moran I index, which ranges from –1 to +1 to evaluate the presence of global spatial autocorrelation, allowing us to determine if the analysis units present a tendency to cluster, scatter, or randomize. 20 We calculated average annual smoothed mortality rates by cantons for the period 2011–2016, applying the Local Empirical Bayesian smoothing method, to both correct for random fluctuations and to provide greater stability of mortality rates in small cantons. 21 Local Indicator of Spatial Association (LISA) was used to describe the spatial patterns of MM mortality hot spots/clusters at the canton level. LISA was used to identify significant hot spots (high values next to high, HH), cold spots (low values next to low, LL), and spatial outliers (high among low, HL or vice versa, LH) of mortality rates. 20 The Moran index with a level of significance of 0.05 was used to evaluate if the rates represent distributions with a tendency toward grouping, dispersion or randomization. GeoDa software was used for the spatial analysis and smoothed mortality rates calculation (GeoDa Center for Geospatial Analysis and Computation, Arizona State University, Tempe, AZ, USA). Additional cartographic representations were created to showcase this analysis.
Ethical considerations
The study did not require approval of an ethics committee since it was an analysis of secondary aggregate data that were obtained from a public domain and freely accessible.
Results
During 2000–2016, 958 people died from MM in Ecuador, 52.7% (n = 505) were males and 47.2% females (n = 453). Reported deaths showed a mean age of 69 years (±15.9) in males and 69 years (±17.2) in females. The characteristics of deaths from MM are shown in Table 1.
Characteristics of deaths from malignant melanoma in Ecuador, 2000–2016.

Time trends
Mortality from MM, in absolute numbers, increased at a national level from 31 deaths in 2000 to 102 in 2016. Between these years, crude mortality rates increased from 0.2 to 0.6 per 100,000 population, presenting a significant increasing trend at a national level (AAPC: 4.8%; 95% CI: 2.6–7.0). ASMR presented a significant increase from 0.3 to 0.6 per 100,000 population (AAPC: 2.9%; 95% CI: 0.5–5.4) over the 17-year study period (Figure 1).
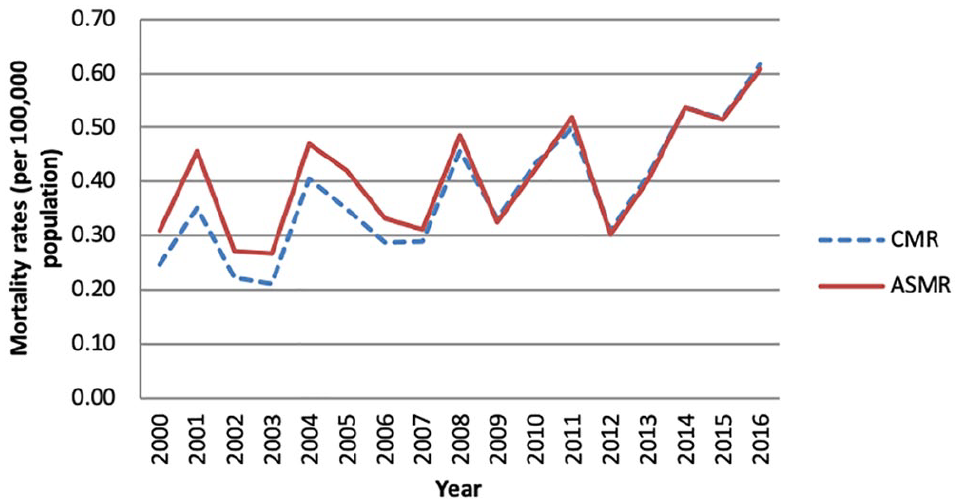
Trends of the crude mortality rate (CMR) and the age-standardized mortality rate (ASMR) per 100,000 population for malignant melanoma in Ecuador, 2000–2016.
Crude mortality rates in males and females increased between 2000 and 2016 from 0.2 to 0.8; and 0.3 to 0.5 per 100,000 population, respectively. ASMR among men increased from 0.3 in 2000 to 0.8 per 100,000 population in 2016, in women ASMR increased from 0.3 to 0.4 per 100,000 population, in the same period, the joinpoint analysis for crude mortality and ASMR for MM can be seen in Table 2 and Figure 2.
Joinpoint analysis of the crude mortality rates and the age-standardized malignant melanoma mortality rates by sex in Ecuador, 2000–2016.

CMR: crude mortality rates; ASMR: age-standardized mortality rates; APC: annual percent change; CI: confidence interval.
The annual percent change is significantly different from 0 (two-sided, p < 0.05).

Joinpoint Analysis by sex: (a) crude mortality rate (CMR) per 100,000 population for malignant melanoma in Ecuador, 2000–2016 and (b) age-standardized mortality rate (ASMR) per 100,000 population for malignant melanoma in Ecuador, 2000–2016.
Spatial analysis
In our spatial analysis, we identified two statistically significant clusters for high occurrence of MM deaths, from 2011 to 2016. The most likely cluster (primary cluster) included 19 cantons located among four provinces (Carchi, Imbabura, Pichincha, and Sucumbíos), totaling 198 deaths. Relative risk (RR) was 2.8 (LLR: 55.4, p < 0.0001), with an annual mortality rate of 1.0 per 100,000 population.
The secondary high-risk cluster included 10 cantons in one province (Azuay). Fifty people died from MM in this cluster, the RR was 2.5 (LLR: 14.8; p < 0.0001) and the annual mortality rate was 1.1 per 100,000 population (Figure 3).
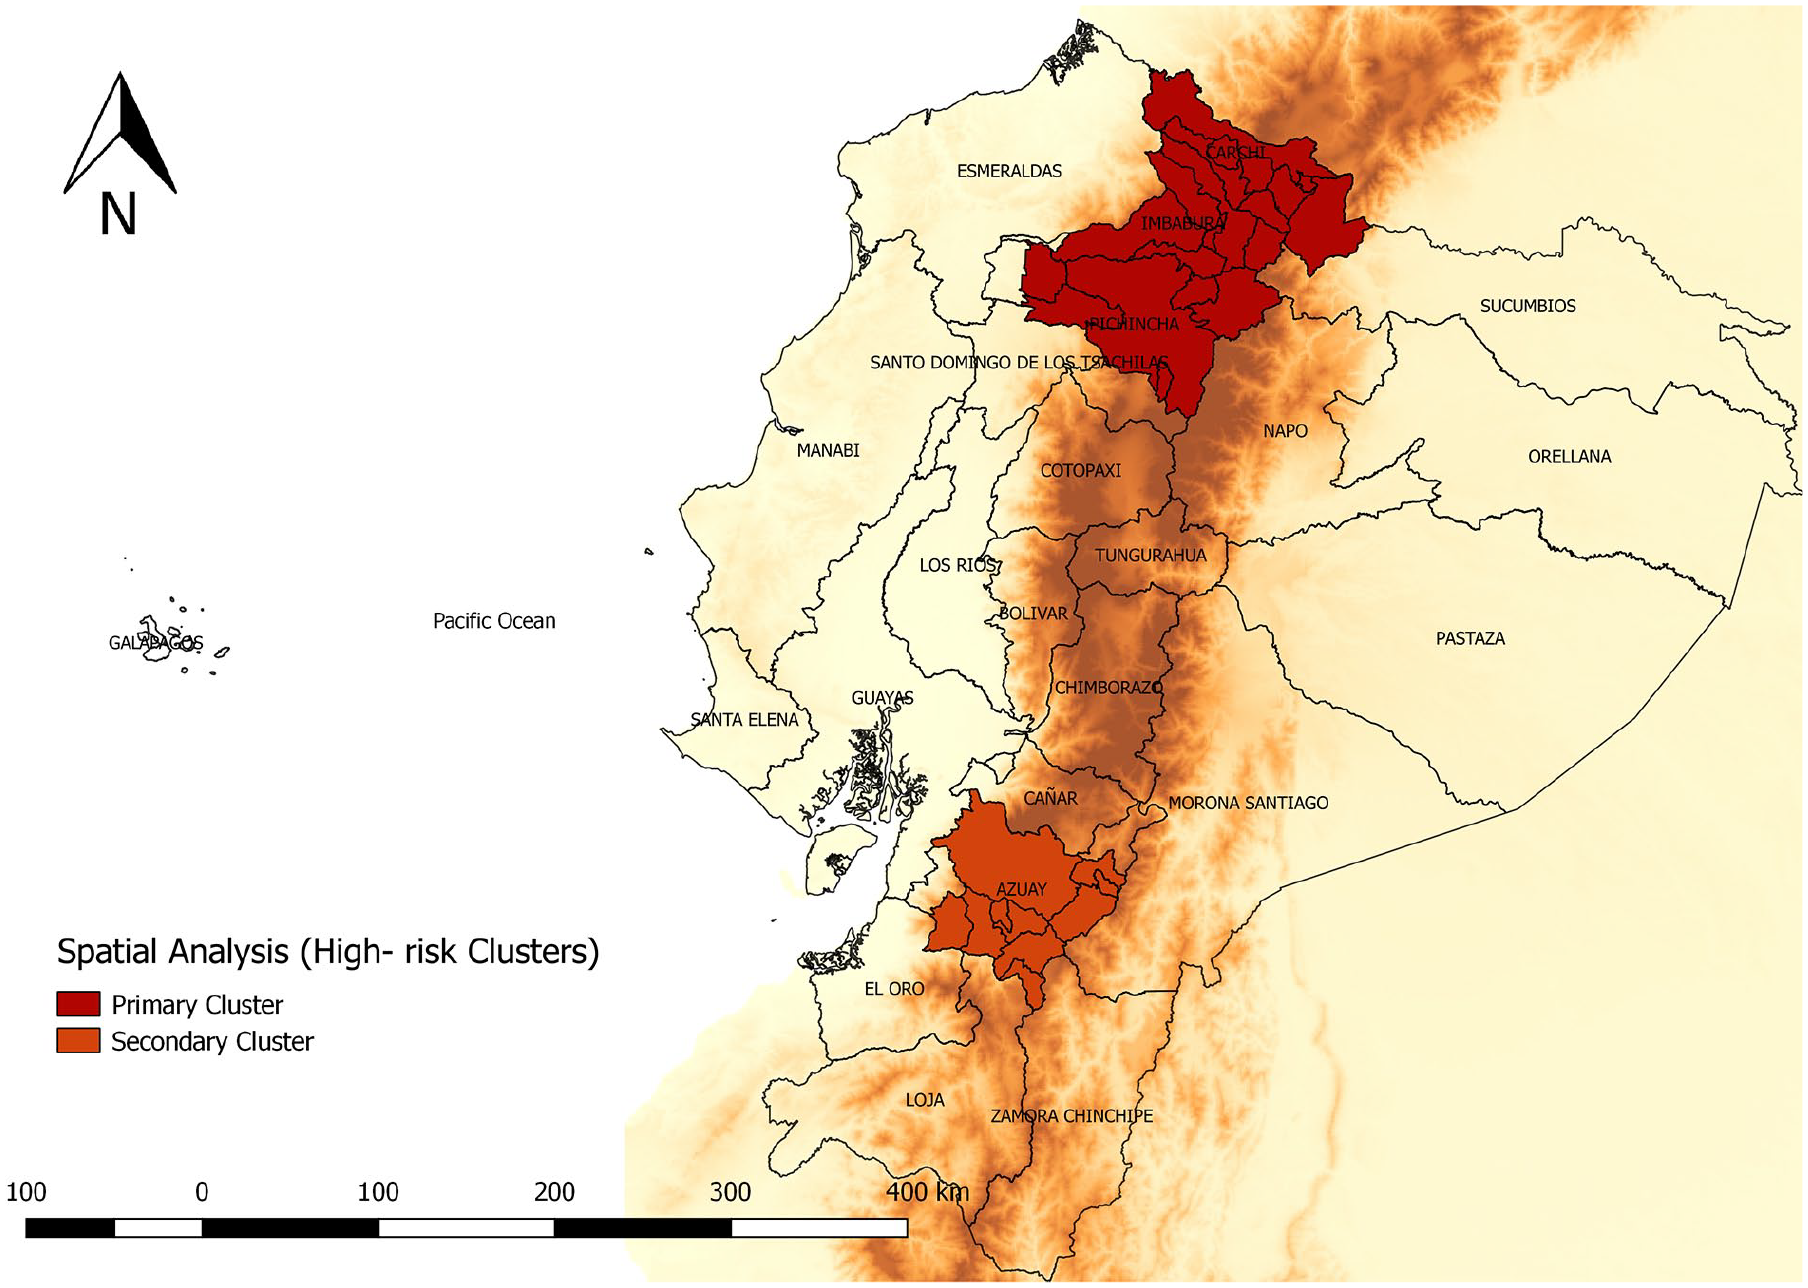
Spatial analysis of malignant melanoma mortality by cantons in Ecuador, 2011–2016.
Spatial autocorrelation
Average annual crude cantonal mortality rates ranged from 0.0 to 25.9 deaths per 100,000 population, and the average annual smoothed mortality rates ranged from 0.8 to 6.2 deaths per 100,000 population. The Global Moran I index for the study period shows a positive spatial autocorrelation (0.3; p = 0.001). We identified a high-risk cluster (high/high) for MM mortality, which includes 19 cantons in seven provinces (Carchi, Chimborazo, Imbabura, Pichincha, Azuay, Cañar, and Loja). Clusters with low rates (Low/Low) include 24 cantons in seven provinces (Esmeraldas, Guayas, Los Rios, Manabí, Santa Elena, Bolivar, and Orellana; Figure 4).

Local Index of Spatial Association (LISA) cluster analysis of malignant melanoma mortality by cantons in Ecuador, 2011–2016.
Discussion
During the study period, mortality rates for MM increased, both in men and women. The average age of affected men and women were equal. The highest percentages of deaths for MM were concentrated in the age group from the age of 60 onward.
We identified two high-risk spatial clusters of mortality. The primary cluster was mainly located (18 out of 19 cantons) in the Highlands region; Carchi, Imbabura, and Pichincha provinces; the remaining canton is located in the Amazon province Sucumbíos. The secondary high mortality cluster contained 10 cantons within the Highlands region in Azuay. The Global Moran I index for the study period shows a positive spatial autocorrelation for MM, the high-risk clusters were located in the Highlands region.
As in previous articles, 4 , 22 in our study mortality rates for MM were higher in men compared to women. This may be due to different factors such as worse sun protection behaviors and reduced skin screening, as well as biological differences in tumors. 4 , 23
The mortality rate for MM has increased at a much slower pace and has remained stable over the past 10 years. 24 In South America, Argentina, Uruguay, and Chile reported the highest ASMR for MM mortality in males (1.2, 1.2, and 1.0 per 100,000 population, respectively); and females (0.7, 0.6, and 0.7 per 100,000 population, respectively) for the period 2003–2007. 25 According to the International Agency for Research on Cancer (IARC), Paraguay, Colombia, and Ecuador are the countries in the region that have reported a growing trend of MM mortality during the 2000–2015 period. 26
UV radiation is the main modifiable risk factor for the development of MM, since UV radiation can be reflected, scattered, and dampened by atmospheric particles, ambient UV dose varies according to the amount of atmosphere it must pass through, making UV doses higher nearest the Equator, and at higher altitudes. 9 , 27 Rigel et al. 28 conclude in their study that regions located at high altitudes should present an increase in the incidence of melanoma. Aceituno-Madera et al. 29 reported a tendency toward increased prevalence of MM at higher altitude, with higher prevalence observed beyond 700 m above sea level. In our study, the highest concentration of deaths was located in provinces nearest to the Equator and in the Highlands region; however, more studies are needed to evaluate more risk factors to confirm this possible positive melanoma-altitude and latitude association.
The cantons located in the Coast region reported the lowest mortality rates mortality, these cantons are located in the lowlands, and provinces such as Esmeraldas concentrate 43.9% of the Afro-descendant population. 30
In Ecuador, there were no specific policies or strategies for MM in practice during the period 2001–2016; however, in 2017 the “National Strategy for Comprehensive Cancer Care” was implemented, whose goal is to reduce all cancer mortality (non-specific) by 25% in the country by the year 2025, 31 established according to the “Goals of the Action Plan for the Prevention and Control of Noncommunicable Diseases” of PAHO and WHO 2013–2019. 32 One of the recommendations within the strategy guidelines is to “Prevent and reduce excessive exposure to ultraviolet radiation,” which specifically targets MM. This includes (1) developing specific legislative projects that regulate exposure to UV radiation among high-risk work populations, (2) developing bills to regulate advertising on tanning sunbeds so that warnings about health risks are clear, (3) promoting and coordinating the implementation and participatory evaluation of information, education, and communication strategies against excessive exposure to UV radiation, and (4) promoting the monitoring of UV radiation and the potential harmful effects on health. 31 However, the results or benefits that have reported these strategies have not yet been published.
Early and accurate detection of MM improves the survival, disease-, and treatment-related morbidity. 33 American Academy of Dermatology (AAD) 34 and the Skin Cancer Foundation 35 recommends a head-to-toe self-examination every month.
A recent systematic review and meta-analysis of four randomized controlled trials (RCTs) and a quasi-experimental study indicate that some interventions can enhance skin self-examination (SSE) activity and so are more likely to aid early detection of skin cancer; however, the actual clinical impact remains unclear. 36 A quasi-experimental study found that statistically significant changes were observed for sunscreen use, SSE, planning, and talk about skin cancer in intervention schools but not the control. 37 Although, most skin cancers are self-diagnosed, 38 , 39 more studies are required to prove the effect of SSE on melanoma incidence and stage at presentation. 40
The prognosis of patients with MM varies depending on the stage of the cancer, the age, the general health, the state of the immune system, and how well the neoplasm responds to treatment, demonstrating that the survival rates are higher for younger people with a diagnosis at an earlier stage of cancer. 41 , 42 The Surveillance, Epidemiology, and End Results (SEER) reported to the period 2009–2015 that the 5-year overall survival rate for melanoma was 91.8%: 98.4% for local melanoma and 62.4% for regional melanoma. 43 Reyes et al. 44 reported in Colombia that melanoma-specific 5-year survival was 79.3%, with worst survival for melanomas localized on subungual areas (55.6%), while the overall survival in patients with acral lentiginous melanoma (ALM) was 54% at 5 years after diagnosis. 45
The main strength of this study was the use of the jointpoint regression model for the description of MM mortality trends; this analysis allows us to detect statistically significant changes from 2000 to 2016, which avoids the pre-specification of periods by the researcher. Furthermore, Kulldorf’s spatial analysis identifies the distribution of the disease in time and space, evaluating the statistical significance of clusters in high-risk, low-risk, and all-risk categories; it also offers early detection of epidemics. 46 We can highlight that there are very few studies on MM mortality in the country, this being the first to perform a spatial analysis of a national database in the 2000–2016 period.
According to the Institute of Metrics and Health Evaluation of the University of Washington (IHME), the data quality rating of the INEC registry for the period 1980–2016 were four over five stars, as reported in the Global Burden of Disease 2016 study, allowing us the assumption that the “percent well certified” of the data used in this study is acceptable. 3
This article faced some limitations with respect to the study design, it is not possible to establish a causal relationship between the observed trends and clinical factors, or to associate clusters with factors related to each geographical area. The lack of national databases with cases reported and their demographic and clinic characteristics prevent knowing the real burden of these diseases as well as their prognosis. Regarding the type of registration, according to ICD-10 coding, we believe that there could be potential problems in the reliability, which could introduce attribution bias, as reported in other studies. 47
Conclusion
Our findings show that mortality due to MM significantly increased over the 17-year study period in Ecuador. The spatial analysis indicates the presence of high occurrence clusters throughout seven provinces of the country located in the Highlands region: Carchi, Chimborazo, Imbabura, Pichincha, Azuay, Cañar, and Loja. These findings can be useful for decision makers when planning strategies focused on education of the population, improving early detection systems, as well as an adequate management, treatment, and follow-up of the patient with MM.
Factors associated to this geographic pattern should be studied in order to create and implement policies oriented to diminish, or at least stabilize, this trend.
Footnotes
Authors’ note
Each of the authors confirms that this manuscript has not been previously published. In addition, all of the authors have approved the contents of this paper and have agreed to the SAGE Open Medicine’s submission policies.
Data Availability
Declaration of conflicting interests
The author(s) declared no potential conflicts of interest with respect to the research, authorship, and/or publication of this article.
Ethical approval
The study did not require approval of an ethics committee, since it was an analysis of secondary aggregate data (anonymized) that was obtained from a public domain and freely accessible.
Funding
The author(s) disclosed receipt of the following financial support for the research, authorship, and/or publication of this article: This work was supported by Universidad UTE.