
Abstract
Objectives:
To compare the accuracy of averaged scores from the original Norbeck Social Support Questionnaire (NSSQ)and averaged scores from each of three new NSSQ versions (NSSQ-R.aid, NSSQ-R.n/a, and NSSQ-R.format). These three new versions of the widely used NSSQ were developed to address three previously identified concerns regarding score accuracy: the Aid subscale’s examples of aid, lack of an n/a response option, and the network nomination/rating procedure. Missing data rates were also assessed.
Methods:
A convenience sample (N = 223) completed one of the four NSSQ versions. Score accuracy (restriction) was assessed by size of correlation between averaged scores (averaged score/network size) and network size, with low correlations indicating less score restriction and higher score accuracy. Fisher’s r-to-z transformations assessed the significance of the difference between all correlations from the three versions. Missing data rates were assessed using chi-square tests of independence.
Results:
The cumulative effects of removing the aid examples and use of the n/a response option improved score accuracy; averaged Aid scores from the NSSQ-R.n/a were statistically significantly less restricted than corresponding scores on the original NSSQ. The final version (NSSQ-R.format) actually resulted in statistically significant decreased score accuracy for averaged Affect scores. There were no statistically significant differences in missing data rates among versions.
Conclusion:
Averaged scores from the NSSQ-R.n/a should be used. Future research should focus on the use of situation-specific Aid items.
The Norbeck Social Support Questionnaire (NSSQ) 1 continues to be widely used in nursing and social science research to plan and evaluate interventions to enhance health-related social support networks. This is likely because the NSSQ measures one’s network size and structure as well as social support from this network. However, almost since its inception, concerns have been raised regarding two issues: accuracy measuring support from networks of varying sizes2–4 and presence of large measurement error in the Aid subscale. 5
Gigliotti and Samuels 4 demonstrated that averaging support scores (support score/network size) improved support score accuracy for all subscales, but that the Aid subscale remained problematic. To more fully understand the reasons for this, Gigliotti et al. 6 conducted cognitive interviews with participants as they completed the NSSQ. These participants voiced three general concerns: (1) they misunderstood the examples in the Aid subscale, (2) the lack of a “not applicable” (n/a) response option forced them to rate all network nominees, and (3) the network nomination and support rating process was not transparent. To investigate the effects that these three concerns had on score accuracy, we created three new versions that reflect three incremental revisions to the original NSSQ. We addressed the first concern (misunderstanding the Aid examples) by removing those examples from the Aid subscale (NSSQ.R-aid). Then, retaining this change, we added an n/a response option (NSSQ.R-n/a). Finally, retaining these two changes, we revised the nomination and rating format (NSSQ-R.format). The purpose of this article is to report the results of these three changes on NSSQ score accuracy.
Background and conceptual framework
The NSSQ 1 is based on Kahn’s 7 conceptualization of three social support functions: Affect, Affirmation, and Aid. Each function is measured by the NSSQ with a two-item subscale (see Table 1). Gigliotti’s 5 psychometric analysis supported its conformation to this intended domain structure (see Figure 1). In addition to measuring these three domains of support, the NSSQ also measures the size of one’s network and the types of relationships that comprise it (spouse, family, friends, etc.). Using a two-stage approach, respondents are first asked to list up to 24 network members and identify their relationships to them. After this network nomination stage is completed, respondents are instructed to turn a series of half-pages and rate each network member on each support item in Table 1. Original response categories were: (0) “not at all,” (1) “a little,” (2) “moderately,” (3) “quite a bit,” and (4) “a great deal.” Ratings for all network members are then summed to produce Affect, Affirmation, and Aid subscale scores.
NSSQ original support items and revised aid items.

NSSQ: Norbeck Social Support Questionnaire.

Confirmatory factor analysis results. 5
House et al. 2 quickly pointed out that, because respondents can nominate from 1 to 24 network members, increased network size generally results in increased subscale support scores and this confounds support ratings with network size. To remove the influence of network size, many investigators divide summed subscale support scores by network size to produce averaged Affect, Affirmation, and Aid scores. Although, as detailed in the following, averaging is not without its own problems, 3 Gigliotti and Samuels 4 demonstrated that averaged scores were more efficient measures of the subscales and this investigation concentrates on how the above-noted concerns raised by cognitive interviewees affect these averaged subscale scores.
Respondents’ concerns
Aid examples
Results of Gigliotti’s 5 confirmatory factor analysis (CFA) are shown in Figure 1. Standardized residuals, to the far left of the figure, indicate the error or variance in those items not accounted for by the tested theoretical model. With large residuals of .11 and .20, the Aid subscale is most affected by error. A large part of this error may be attributable to the given examples of aid. Notably, Gigliotti et al. 6 reported that all seven cognitive interviewees focused on the examples of aid (see Table 1). They did not seem to understand that the Aid items were meant to assess any type of immediate or long-term aid and these were examples of such.
Because of this, participants roughly averaged amounts of aid given based on the aid examples. For Aid 1, network members who could provide both money and a ride received higher ratings than those who could provide either money or a ride but not both. Likewise, interviewees interpreted help if “confined to bed for several weeks” (Aid 2) as physical help and, if a network member could not provide physical assistance, ratings were low despite the fact that these network members may be able to provide other means of long-term assistance such as money. We began our revisions by removing the aid examples (NSSQ-R.aid). See revised Aid subscale questions in Table 1.
Response options
All cognitive interviewees were reluctant to rate network nominees lowly for some items. Gigliotti et al. 6 concluded that this was likely due to a social desirability response option bias. That is, having identified a network member as being important to them, as per the network nomination instructions, it was difficult to then rate them “a little” or “not at all” without feeling like a “bad” (p. 71) person. A good example of this is a network nominee such as one’s employer or child who would not be expected to be a confidante (Affirm 2) or provide tangible aid. Yet, a rating of “not at all” seemed harsh to interviewees. Therefore, for the second revision, we added a “not applicable” response option (NSSQ-R.n/a). This conforms to the feedback from all of Gigliotti and colleagues’ interviewees who agreed that this would allow them to drop a network member for an item in a socially acceptable way.
Network nomination
Critically, during the NSSQ network nomination process, support items are concealed and—unless a respondent turns the half pages and reads the items and response choices—they do not know that they will subsequently rate each nominee on a series of support items. After network nomination is completed, the respondent is instructed to turn the page and the first two items are revealed. Gigliotti and Samuels 4 reported the mode network size for their pooled data (N = 611) was 8 and the majority (61.3%) of respondents nominated 5–12 network members with only 17.7% nominating >15. The distribution of the pooled data was positively and statistically significantly skewed (Fisher’s skewness = 7.37).
We reasoned that concealment of the support items, and thus the support context, resulted in erroneous nomination of too many network members. This could explain Norbeck et al.’s 8 test–retest results where respondents nominated fewer network members on the retest (t = 2.26, p = .03; M = 12.57 vs M = 11.36). Perhaps, once respondents understood the type of support being rated, they nominated a smaller network of supporters. Gigliotti et al. 6 reported that none of their seven participants understood why they were nominating network members. After completing the ratings, one said, “If there were not 24 spaces I would have omitted 2, no maybe 3, maybe 4” (p. 70). For the final revision, we changed the format (NSSQ-R.format) so that respondents rate each network nominee on all items before nominating and rating the next supporter (see Figure 2).

Revised format (NSSQ-R.format).
Effects on score accuracy
Each of these concerns can reduce score accuracy and their effects likely work in tandem so that individual effects cannot be easily teased out. For example, a participant may list many supporters because he does not know that he will need to rate these supporters. Then, when rating each supporter, he may not want to give a low rating even if the item does not pertain to that supporter and/or he may misunderstand the Aid items. These tandem effects likely result in score restriction and increased participant burden. Then, the effects of score restriction and participant burden likely lower the results of statistical tests. We now detail these effects and present our hypotheses and research question concerning how the three revisions should improve the accuracy of NSSQ scores.
Score restriction
As noted, averaged rather than raw support scores are used to remove the influence of network size. That is, because support ratings from network nominees are summed, larger networks generally result in higher support scores. If high support is a good thing, then participants with smaller, yet highly supportive, networks are at a disadvantage. Although averaging (support score/network size) should remove the influence of network size, because the average (mean) is influenced by each data point and is sensitive to extreme values, averaged scores are subject to score restriction. Score restriction can be tested with a bivariate correlation between the averaged score (support score/network size) and network size. Although a zero correlation is optimal, lower absolute correlations indicate less influence of network size on averaged scores. A negative correlation means that score restriction is present and averaged scores decreased as network size increased.
Effects of aid examples on score restriction
Norbeck 3 was first to caution that averaging could result in score restriction. For example, Respondent A nominates seven network members and rates all highly 4 on a two-item subscale. Respondent B nominates 14 network members and rates 7 highly 4 but varies the ratings of the other 7. Although both have seven highly supportive network members and B has seven others, B’s averaged subscore (e.g. 91/14 = 6.5) will be lower than A’s (e.g. 56/7 = 8). Gigliotti and Samuels 4 found that averaging resulted in some score restriction for all subscale scores. However, only averaged Aid subscale scores showed statistically significant score restriction. We hypothesize that the specific examples of aid result in lowered summed Aid ratings (numerators) especially in large networks (denominators) and is one reason that averaged Aid scores are restricted. That is, the numerators (support scores) cannot keep pace with the denominators (network size):
Hypothesis 1. Averaged Aid scores from the NSSQ-R.aid will be statistically significantly less correlated with network size than corresponding scores from the NSSQ.
Effects of an n/a option on score restriction
Rarely can all network members give all types of support but, at present, all network nominees must be rated on all items. There is no way to temporarily drop a nominee. Thus, for example, a low rating for one’s young child who would not be expected to provide aid is weighted the same as a low rating for one’s spouse who would be expected to provide aid but did not. In the case of the child’s low rating, the inability to choose to not rate them means that the summed support score is lowered (numerator) but the network size (denominator) remains the same and thus the averaged score is falsely lowered. This happens frequently when participants nominate many network members and will result in score restriction, as in Norbeck’s 3 example above. As noted previously though, score restriction is most problematic in the Aid subscale. Inclusion of the n/a option should decrease network size for each respective item:
Hypothesis 2A. Averaged Aid scores from the NSSQ-R.n/a will be statistically significantly less correlated with network size than corresponding scores from the NSSQ-R.aid and original NSSQ.
Hypothesis 2B. We expect that adding an n/a option will have the greatest effect on averaged Aid subscores; nonetheless, this n/a option may also affect averaged Affect and Affirmation scores. Therefore, we will also investigate whether averaged Affect and Affirmation scores from the NSSQ-R.n/a are statistically significantly less correlated with network size than corresponding scores from the NSSQ-R.aid and original NSSQ.
Effects of network nomination on score restriction
Gigliotti et al. 6 concluded that the current network nomination process causes respondents to nominate network members that they would not have nominated if they had known the types of support to be rated, or indeed that support was to be rated at all. Although the n/a option, if present, can be used to temporarily drop these network members, it is also likely that some inaccurately low or high ratings will still be given; this would also likely result in score restriction. The more transparent network nomination process of the changed format (NSSQ-R.format) should result in more accurate network nomination and decrease score restriction beyond the effects of the NSSQ-R.n/a:
Hypothesis 3. Averaged Affect, Affirmation, and Aid scores from the NSSQ-R.format will be statistically significantly less correlated with network size than corresponding scores from the NSSQ-R.n/a.
Participant burden
In previous works,9–11 many respondents completed the network nomination phase but did not complete the subsequent support ratings phase. Gigliotti et al. 6 reported that their participants were surprised to learn that they had to rate each network nominee and one participant said they felt “duped” (p. 70). We hypothesized that participant burden is greatest when large networks are erroneously nominated and that this results in missing data. This also prompted the changed format (see Figure 2) so that each network member is rated before nominating the next member. In a small pilot study (N = 43), we found a statistically significant between-format difference (χ2 = 9.24, degrees of freedom (df) = 1, p = .002) in missing data rates. Of the 20 pilot study participants returning the original NSSQ, 7 had missing data on one or more support items, and 3 of these 7 nominated network members but did not rate them. There were no missing data points on surveys returned by participants using the NSSQ-R.format:
Hypothesis 4. Respondents completing the NSSQ-R.format will have statistically significantly less missing subscale data than those completing the NSSQ, NSSQ-R.aid, or NSSQ-R.n/a.
Method
Measures
NSSQ
Information about what is measured by the NSSQ 1 and its format has already been provided. Psychometric work includes reports of concurrent1,8,12 and predictive validity, 8 internal consistency and stability over time, 8 test–retest reliability,8,12 and absence of social desirability bias. 1 In addition, Gigliotti 5 conducted a CFA establishing construct validity and Gigliotti and Samuels 4 demonstrated that averaged scores provided more accurate measures of Affect, Affirmation, and Aid than did raw scores.
NSSQ-R.aid
This version follows the same format as the original NSSQ but the two Aid items are revised to remove examples (see Table 1).
NSSQ-R.n/a
This version retains the changes to NSSQ-R.aid and adds the (n/a) response. This results in six response options: “n/a,” “not at all,” “a little,” “moderately,” “quite a bit,” and “a great deal.” To calculate each participant’s averaged scores on this version, scores for each item are summed and then divided by network number minus the number rated as n/a. Item scores are then combined to form averaged dimension (Affect, etc.) scores. For example, Affect 1 scores of 4, 3, 2, 1, and n/a, and Affect 2 scores of 3, 2, 1, 1, and 0 are scored as Affect 1: 10/4 = 2.5 and Affect 2: 7/5 = 1.4. The total averaged Affect score is 2.5 + 1.4 = 3.9.
NSSQ-R.format
The above changes to Aid questions and the addition of the n/a response option were retained in this version. The procedure for network nomination and recording subsequent support ratings was changed (see Figure 2). Specifically, each network member is nominated and rated on all items before nominating and rating the next network member; 24 opportunities to nominate a supporter were given as in all other versions.
Demographic data
The following seven demographic data were collected for each participant: gender, age, marital status, education, employment, total family income, and ethnic/racial background.
Sample
This was a convenience sample of community-dwelling adults ⩾18 years of age. We strove to sample well the participants’ characteristics predicted to affect the factors of interest; therefore, we recruited participants at various family life stages (i.e. non-parents, parents, and grandparents) to increase the variabilities in both network size and composition. We invited participation from graduate, undergraduate, and continuing education students, faculty and staff at a large public university in the northeast United States. In addition, the investigators and the research assistants (RAs) working on this project recruited acquaintances to participate. Surveys were distributed to 560 people.
Data collection
After human subjects’ approval was obtained from the authors’ university, participation was invited in classrooms, meetings, and in varied community settings. All survey packets consisted of pencil-and-paper surveys arranged in the following order: cover sheet, introduction letter, demographic data sheet, and one of the four versions of the NSSQ. No permutations of measurement order were done due to the need for the fixed layout of the scannable version (NSSQ-R.format). Survey packet cover sheets were marked to denote version and packets were alternately stacked (NSSQ, NSSQ-R.aid, NSSQ-R.n/a, and NSSQ-R.format) to be distributed sequentially. Surveys were completed anonymously at a time convenient to the participant and returned in a prepaid envelope to the principal investigator. Participation was regarded as tacit consent.
For classroom distribution, one of the investigators introduced the study, invited participation, and instructed students to take a survey packet if they wished to participate. All were asked to take the packet that was next on top because they were in version order. The investigator and instructor then left the room. Distribution to staff and faculty generally occurred in a group setting, such as a meeting or a shared office space, and the same procedure was followed as above. When data were not collected in a group setting, the study was explained to potential participants and they were invited to participate. In these instances, anonymity of data was stressed and the version next in the distribution sequence was given to them.
Data management
Number of each survey version distributed and returned was tracked carefully. NSSQ subscale data from versions using the original format (NSSQ, NSSQ-R.aid, NSSQ-R.n/a) were recorded on the NSSQ worksheet 3 and Affect, Affirmation, and Aid variables were calculated. Data from the NSSQ, NSSQ-R.aid, and NSSQ-R.n/a were then entered into SPSS version 23, 13 and averaged Affect, averaged Affirmation, and averaged Aid scores were calculated. For averaged NSSQ-R.n/a scores, denominators were appropriately reduced as previously described if network nominees were designated as n/a. Data from the NSSQ-R.format were scanned into EXCEL using REMARK OMR software 14 and converted to an SPSS file. SPSS syntax was developed to form Affect, Affirmation, and Aid variables and their averaged counterparts.
Data analysis
Although all were directional hypotheses, we used more conservative two-tailed significance tests for all but the z tests comparing correlational differences of averaged scores with network size. With regard to the z tests, given their expected directional nature and the focus of this article, one-tailed tests were used for these. Alpha was set at .05 and power at .80. Kolmogorov–Smirnov tests of normality were performed on all NSSQ variables. Averaged support scores were formed by dividing summed Affect, Affirmation, and Aid ratings by network size. For NSSQ-R.n/a and NSSQ-R.format, if a participant used the n/a option, the network size was reduced accordingly for each item. Tests of equality among NSSQ versions were performed on categorical demographic variables using chi-square tests of independence. Tests of equality among NSSQ versions for network size were tested using analysis of variance (ANOVA). For averaged support scores, multivariate analysis of variance (MANOVA) was used to test for among-NSSQ version differences in consideration of the high correlations among Affect, Affirmation, and Aid.
For hypotheses 1–3, Pearson r correlations between averaged scores and network size were first done. Then, because we are comparing correlations from independent samples, Fisher’s r-to-z transformations were used to test the statistical significance of the difference between two correlation coefficients, using software available at http://vassarstats.net/rsig.html. 15 Absolute correlations (no signs) were used for all z tests because hypotheses concerned the correlations’ magnitudes. For hypothesis 4, chi-square tests of independence were used to investigate among version differences in missing data rates.
Results
Response
A total of 227 people returned the surveys for an overall 40.5% response rate. Of these 227, 4 did not complete any NSSQ subscales. These four cases were eliminated from the analyses except for the missing data analysis. Concerning NSSQ variables on the remaining 223 surveys, the Affect and Affirmation subscales fared well: two participants missed only Affect, two participants missed only Affirm, and one participant missed both Affect and Affirm. The Aid subscale presented more problems: nine participants missed the Aid subscale and, of these, three missed both the Aid and Affirmation subscales.
No NSSQ subscale had >5% missing data, and respondents with partial missing data were excluded analysis by analysis to preserve variance. Finally, regarding demographic data, four participants did not provide any demographics, two participants missed gender, two participants missed employment status, six participants missed income, and one participant missed ethnicity. There were no patterns to these missing demographic data and demographics were not integral to hypotheses; thus, these respondents were included in all analyses.
Sample characteristics
As shown in Table 2, participants were largely female (90.8%), approximately half (48.9%) were aged 29 years or younger, half (51.4%) were single, and 60.7% were White. As expected, given the sampling frame, most were well educated and somewhat affluent with 68.9% having at least an associate degree and 40.4% reporting a family income US$>100,000; 19.4% reported that they were not working. There was only one statistically significant between-version difference on sample demographics. Employment status differed slightly with the differences being between those working greater than and less than 40 h per week.
Chi-square tests of between-version demographic differences.
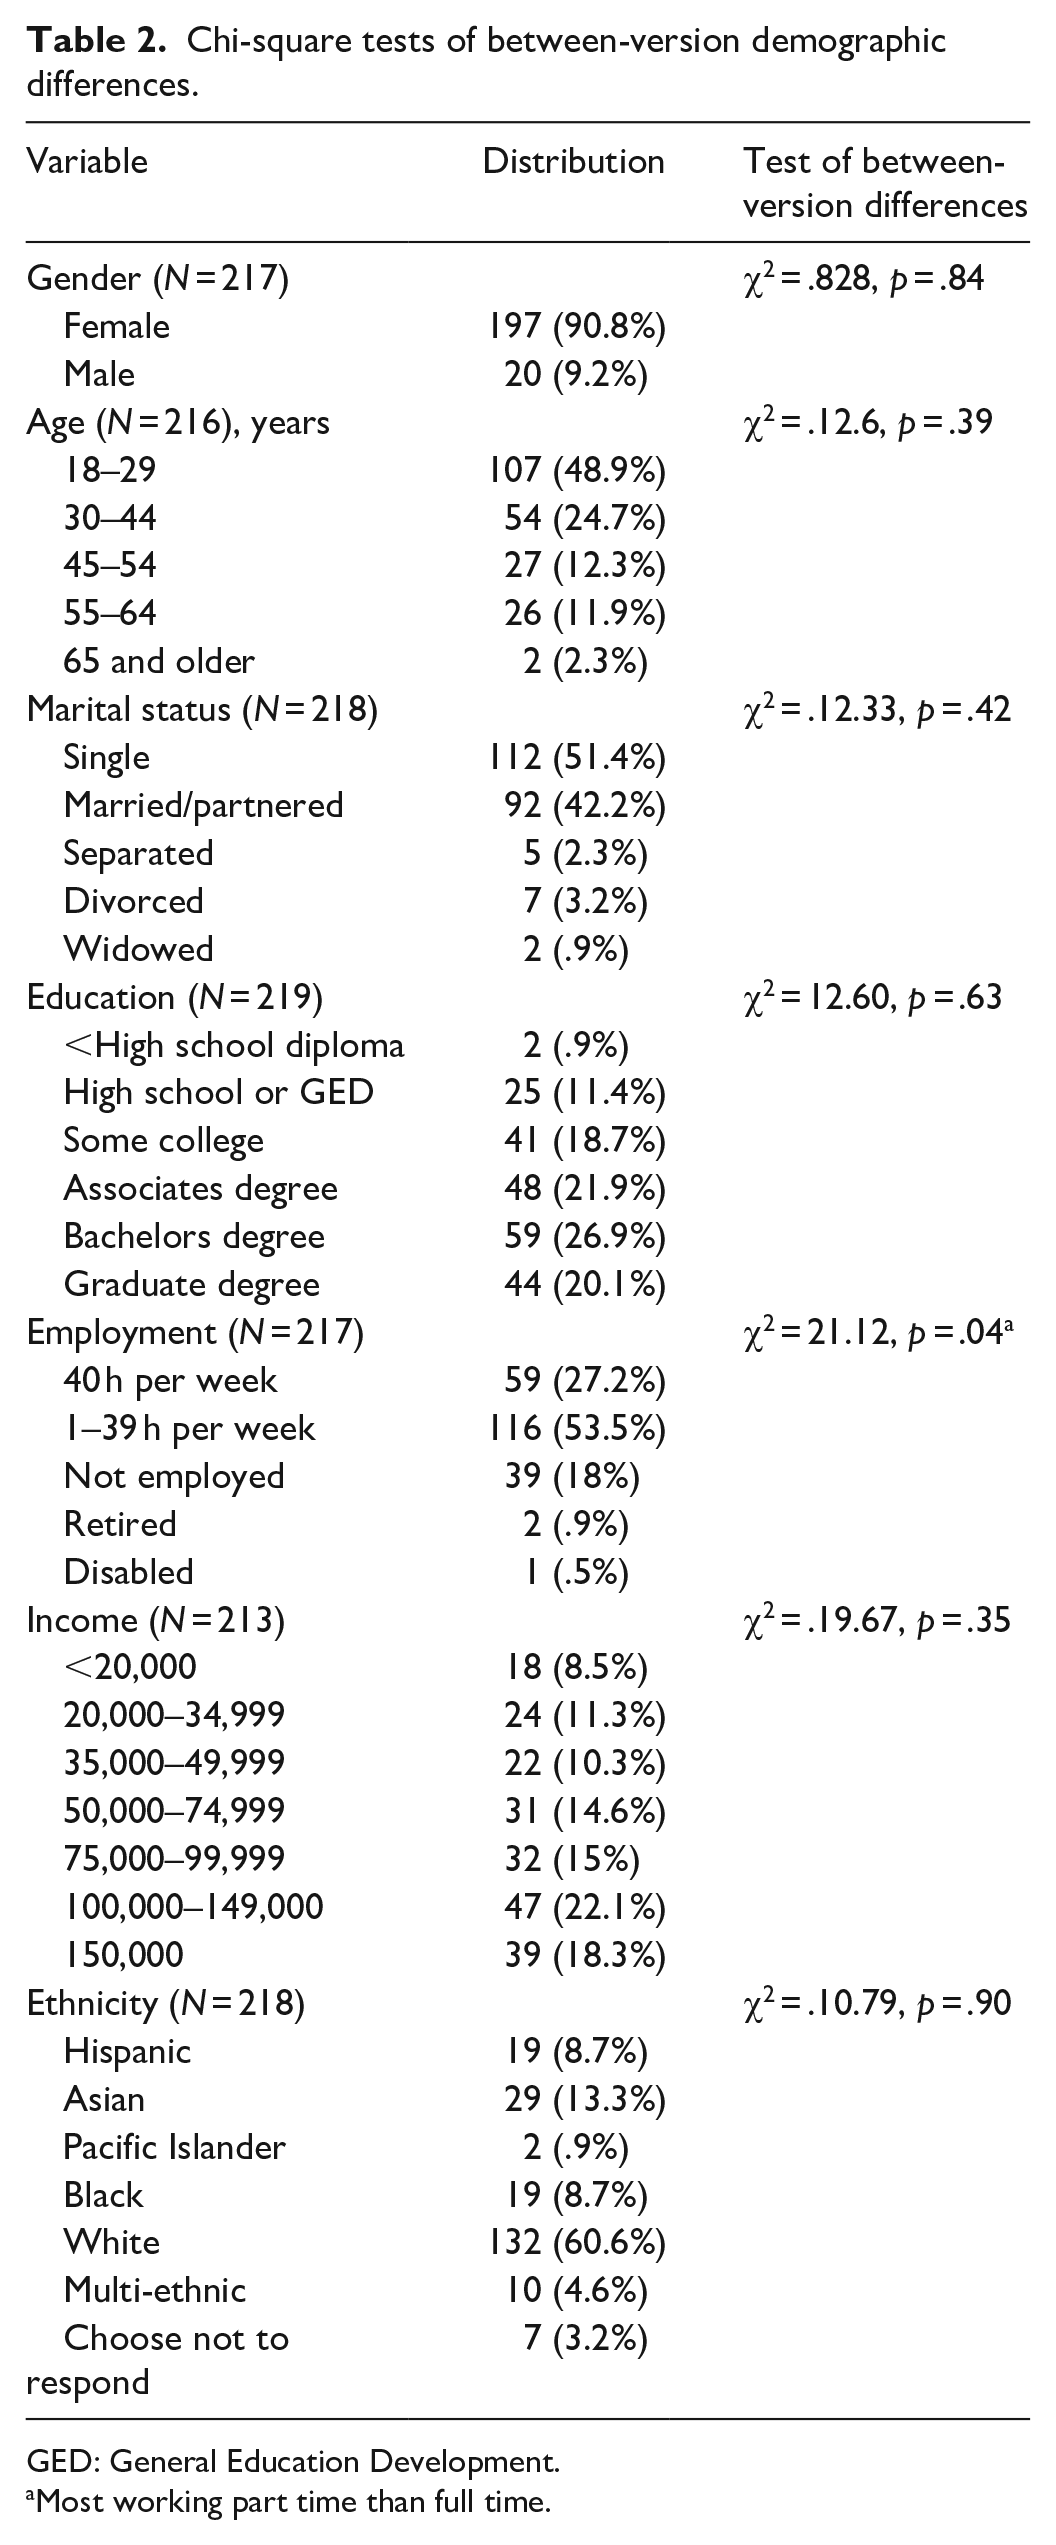
GED: General Education Development.
Most working part time than full time.
Data characteristics
Kolmogorov–Smirnov (K–S) tests of normality showed that averaged Affirmation and averaged Aid scores were normally distributed in all four versions’ samples. However, averaged Affect was statistically significantly non-normal in all but the NSSQ-R.format. Subsequent Fisher’s tests revealed both positive skew (7.33) and kurtosis (2.99) for this Affect data. Due to the mild skew and kurtosis, and because transformation would impede comparison with the other subscales, no data transformations were performed. There were statistically significant between-version differences in both network number and averaged Affect scores (see Table 3). NSSQ-R.format respondents nominated 2.81 fewer network members (p = .006) than original NSSQ participants. Also, NSSQ-R.format respondents reported more averaged Affect than respondents completing all other versions.
Between-version differences in study variables.
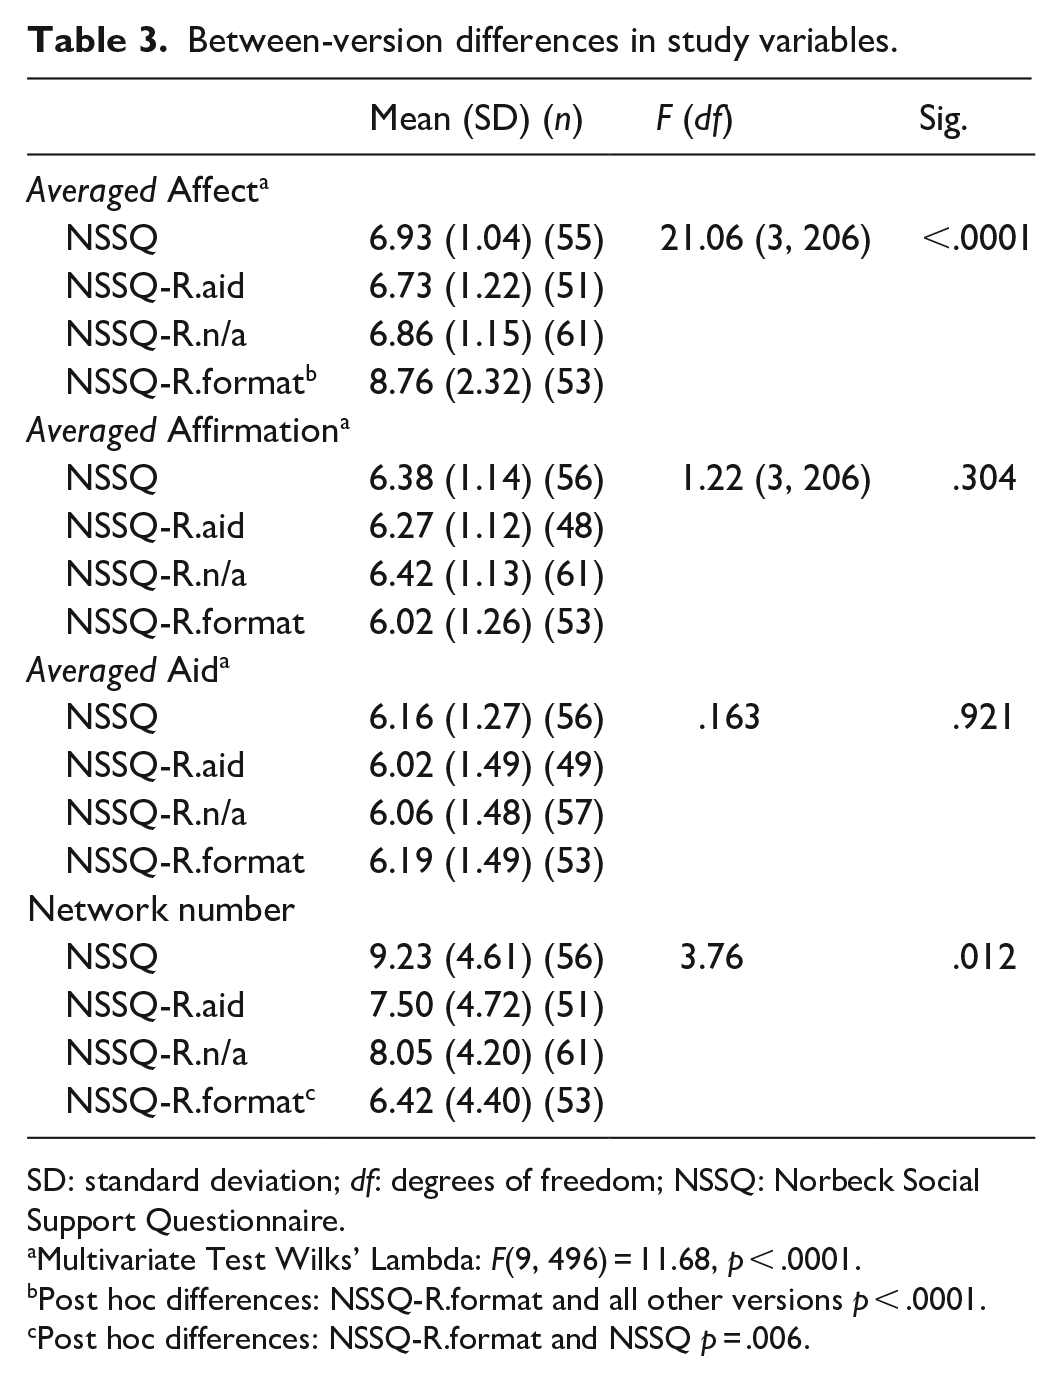
SD: standard deviation; df: degrees of freedom; NSSQ: Norbeck Social Support Questionnaire.
Multivariate Test Wilks’ Lambda: F(9, 496) = 11.68, p < .0001.
Post hoc differences: NSSQ-R.format and all other versions p < .0001.
Post hoc differences: NSSQ-R.format and NSSQ p = .006.
Tests of hypotheses
Results of Pearson r correlations of network size with the averaged support subscale scores from the four NSSQ versions are shown in Table 4. Table 5 shows the z test results of statistical significance of the differences between these correlations.
Correlations between averaged support scores and network size.

NSSQ: Norbeck Social Support Questionnaire.
z tests for significance of the difference between the correlation coefficients: each version’s NSSQ variable and network size.

NSSQ: Norbeck Social Support Questionnaire.
particular z scores were statistically significant < .05.
Hypothesis 1
Removing the aid examples did decrease averaged Aid’s score restriction (NSSQ-R.aid (r = –.270, p = .06)) from its former level (original NSSQ (r = –.334, p = .01)). However, this decrease in correlation was not statistically significant (z = .34, p = .74).
Hypothesis 2A
It was expected that the next incremental revision (NSSQ-R.n/a) would further ameliorate core restriction for averaged Aid scores. This was expected due to the NSSQ-R.n/a respondent’s ability to temporarily drop a network member and decrease the denominator when appropriate. In fact, for averaged Aid, the “n/a” option did result in an additional attenuation of score restriction (r = –.016, p = .90) when compared with averaged Aid scores’ correlation with network size (r = –.270, p = .06) from the first revision (NSSQ-R.aid) but again this correlational decrease was not statistically significantly different (z = 1.29, p = .10). However, when comparing averaged Aid’s performance on the NSSQ-R.n/a with the original NSSQ, the cumulative effect of both the removal of the aid examples and addition of the “n/a” option made the attenuation in score restriction even more pronounced (r = –.334, p = .01 to r = –.016, p = .90) and is indeed a statistically significant correlational decrease (z = 1.71, p = .04).
Hypothesis 2B
Regarding averaged Affect and Affirmation scores, the influence of network size on averaged Affect scores showed some score restriction (r = –.183, p = .18) on the original NSSQ but this turned to a positive correlation of roughly the same magnitude (r = .175, p = .22) on the NSSQ-R.aid. Remarkably, almost no score restriction or inflation was present for averaged Affect scores on the NSSQ-R.n/a (r = .018, p = .89). Again though, these correlational differences were not statistically significant (see Table 5). Finally, for averaged Affirmation, correlations of averaged Affirmation with network size among all three versions were also equivocal (see Table 5). Specifically, the original NSSQ averaged Affirmation scores showed slight score restriction (r = –.087, p = .52) and then slight score inflation (r = .068, p = .65) on the NSSQ-R.aid and finally slight score restriction again on the NSSQ-R.n/a (r = –.124, p = .34).
Hypothesis 3
The revised network nomination process of the NSSQ-R.format coupled with the previous revisions, removing Aid examples and adding the “n/a” option, was expected to reduce score restriction over and above improvements expected from NSSQ-R.n/a. Remarkably, all three averaged scores from the NSSQ-R.format showed notably greater score restriction than corresponding NSSQ-R.n/a scores (see Table 4). Score restriction of averaged Aid was worse (r = – .253, p = .07) compared with the NSSQ-R.n/a (r = –.014, p = .92) as was score restriction of averaged Affirmation (r = –.191, p = .17) compared with the NSSQ-R.n/a (r = –.128, p = .32). However, these correlational differences were again not statistically significant (averaged Affirmation (z = –.33, p = .37) and averaged Aid (z = –1.25, p = .11)). The most surprising comparison was averaged Affect scores from the NSSQ-R.format with very high score restriction (r = –.629, p < .0001) in contrast with corresponding scores from the NSSQ-R.n/a (r = .021, p = .88). This correlational difference was statistically significant (z = –3.74, p = .0001).
Hypothesis 4
It was expected that the more transparent network nomination process used in the revised format (NSSQ-R.format; version 4) would result in less missing data. This hypothesis was also not supported. Although the NSSQ-R.format had no missing data and the other three versions had some missing data, the differences between versions were not statistically significant for total missing data (χ2 = 15.07, df = 9, p = .089). This same pattern occurred in each subscale: Affect (χ2 = 3.81, df = 3, p = .282), Affirmation (χ2 = 6.08, df = 3, p = .108), and Aid (χ2 = 5.24, df = 3, p = .155).
Additional analyses
Given these results, we concentrated further analyses on the NSSQ-R.n/a. Importantly, only 9 of the 57 NSSQ-R.n/a respondents (15.7%) used the “n/a” option: 5 of these 9 only used the “n/a” option for the aid items, 1 respondent used “n/a” for both Aid and Affirmation items, 2 respondents used “n/a” for Affect only, and 1 used “n/a” for Affirmation only. We calculated the achieved effect size of z tests comparing the original NSSQ and NSSQ-R.n/a and found q = .206 (small) for averaged Affect correlational differences; q = .041 (none) for averaged Affirmation correlational differences; and q = .333 (small to moderate) for averaged Aid correlational differences. Post hoc power analyses, using G3Power 16 for these three correlational differences with expected alpha at .05, and sample sizes of 54 (NSSQ), and 57 (NSSQ-R.n/a) were .28 for averaged Affect, .07 for averaged Affirm, and .52 for averaged Aid scores.
Discussion
We begin our discussion with the original NSSQ. This study’s results concerning score restriction for the original NSSQ averaged subscale scores are quite similar to the results from all three samples reported by Gigliotti and Samuels. 4 In this study, as well as in the three former samples, the original NSSQ shows low and non-statistically significant negative correlations of averaged Affect and Affirmation scores with network size. As well, for the original NSSQ, all four samples showed larger and statistically significant negative correlations between averaged Aid scores and network size.
We turn our attention now to our first revision (NSSQ-R.aid) and its effect on averaged Aid scores. Removal of the examples of tangible aid did result in slight reduction in averaged Aid score restriction, although the NSSQ-R.aid’s correlation between averaged Aid and network size was not statistically significantly different from the corresponding correlations from the original NSSQ. The addition of the “n/a” option on the third revision (NSSQ-R.n/a) also appears to incrementally improve score accuracy over the NSSQ-R.aid for averaged Aid scores but again this was not a statistically significant improvement. Although this change was not statistically significant, when comparing correlations of averaged Aid scores and network size from the original NSSQ with these same scores from the NSSQ-R.n/a, we can see the cumulative effects of the two revisions. NSSQ-R.n/a averaged Aid correlations with network size showed a statistically significant decrease in score restriction when compared with corresponding correlations on the original NSSQ.
Regarding averaged Affect and Affirmation, NSSQ-R.n/a averaged Affect scores also appear to show improved accuracy from both the original NSSQ and NSSQ-R.aid, although these improvements were not statistically significant. Averaged Affirmation’s results were essentially the same among versions. It is likely that, because averaged Affect and Affirmation were very slightly affected by score restriction from the start, they did not have much room for improvement. In contrast, averaged Aid has consistently shown moderate score restriction and could stand to benefit most from the revisions.
As noted, on the NSSQ-R.n/a, the “n/a” option was used nine times: six times for the Aid subscale, two times for Affect, and one time for Affirmation. Moreover, if a participant used the “n/a” option, multiple network members were rated n/a. In the Aid subscale, one participant rated 12 network members “n/a” and another rated seven members n/a. For the NSSQ-R.n/a version, score restriction is very low for all three averaged subscores.
What then happened to the NSSQ-R.format? We expected this final version to improve upon results from the NSSQ-R.n/a because it incorporated the two former revisions and added a more transparent network nomination process. Instead, there was no improvement. Score restriction for the NSSQ-R.format’s averaged Affirmation items was comparable with that of the NSSQ-R.n/a and score restriction for averaged Aid and averaged Affect was far higher than on the NSSQ-R.n/a. In addition, the NSSQ-R.format’s averaged Aid score restriction was comparable with the first revision (NSSQ-R.aid), despite the presence of the “n/a” option which the NSSQ-R.aid version lacked.
However, the truly remarkable result was not just the presence but the actual magnitude of averaged Affect’s score restriction on the NSSQ-R.format. In Gigliotti and Samuels’ 4 work and on all other versions in this study, score restriction—when present for averaged Affect—is fairly low and is highly reflective of the influence of respondents who nominate large networks. This is not the case with the NSSQ-R.format’s averaged Affect scores. Notably, score restriction did not occur only when network size was high but rather occurred at all network sizes. We therefore suspect that Affect ratings just could not keep pace with network number whether they listed 4 or 14 supporters. This is even more interesting because the MANOVA results (see Table 3) show that averaged Affect scores from NSSQ-R.format respondents were statistically significantly higher than averaged Affect scores from all other versions.
Trying to understand this, we considered that, unlike the respondents who completed the other three versions, NSSQ-R.format respondents nominated and rated the first network member on all support items before nominating and rating subsequent network members. Thus, they knew the types of support they were being asked to rate and likely nominated accordingly. For example, a respondent may not have nominated some family members at all if they had not already seen the questions about immediate and long-term aid. However, they had read the questions already when rating the first nominee and, realizing that these family members could provide aid, they nominated them. Because they likely could not be rated n/a for Affect, because the n/a connotation is that affection is not expected, they received moderate (2 or 3) but not high (4) ratings. This occurred with many respondents. Thus, while we expected that the new format would provide transparency, we did not consider that the entire rating procedure would be different once a respondent had nominated and rated one network member on all questions. This likely influenced all subsequent nominations and ratings. Moreover, the changed format did not make a statistically significant improvement in missing data rates.
It is worth nothing here that the respondents’ demographic characteristics were equal across the NSSQ response formats and that we attempted to recruit participants so that their demographic characteristics resembled those factors of the general population that might affect response ratings (viz., generational stage—parent, grandparent, etc.—and network size/composition). However, we did not attempt to control other demographic characteristics such as gender and educational attainment; the sample was more female and educated than the general public. Although it is unlikely that educational attainment—equal across groups—would affect understanding the NSSQ’s instructions, we can be less sure whether the response tendencies we found here would differ among a more heavily male group of respondents.
Limitations
We identify four primary limitations to this study. First, respondents only completed one version of the NSSQ and thus we do not know how the same respondent’s scores would be influenced by each change. However, this was necessary because, as demonstrated by Norbeck et al.’s 8 test–retest results, knowledge of the nomination and rating process influences subsequent network nomination. Thus, it was important that respondents were naïve to the procedure and this was also apparent on our final version (NSSQ-R.format) where respondents nominated and rated one member before continuing the nomination/rating process.
The second limitation was the small subsample sizes. Given the small effect sizes for the z tests of correlational differences, post hoc power analyses show that the sample sizes should have been in the 140–150 range instead of the existing 46–57 range. Although we did consider increasing sample sizes, we could not ethically justify this. That is, with a 40.7% response rate and four versions, this would have meant distributing surveys to 1120 (1680 total) more potential participants. In addition, after reviewing our data collection experiences, we also recognized that our low response rate was likely because improved score accuracy holds little social meaning for most participants. Thus, any specified indirect benefit to these participants would be exaggerated.
The third limitation is that, to the best of our knowledge, none of our respondents were in need of intensive aid (e.g. were infirmed). In any event, to increase response rates and a balanced design, we did not ask about what types of assistance they currently or previously had. We did find a slight difference in the employment status of some participants, but this was not related to any other patterns in the data, including response to aid items. We nonetheless cannot discern if and how respondents who have experienced various levels of need for aid would differ from those who consider aid as an abstract hypothetical.
The fourth and final primary limitation is that, with the exception of the NSSQ-R.aid, the other versions incorporated previous revisions. Thus, we do not know how score accuracy would have been affected if the “n/a” option was the only change and aid examples left in or if the format changed but the aid examples and original response options were left intact. The decision to investigate incremental differences in score accuracy was based on the knowledge of previous work and the hypothesized tandem effects previously noted. We had also expected the aforementioned small sample sizes and more versions would have precluded this investigation altogether.
Conclusion and recommendations
We recommend use of the NSSQ-R.n/a. With Norbeck’s permission, the NSSQ and all psychometric work can be found at http://eileengigliotti.com/. 17 The NSSQ-R.n/a along with the revised scoring sheet and the SPSS syntax for “n/a” score conversion can also be found on that site. We also recommend that future researchers follow Norbeck’s 3 suggestions regarding exploration of use of situation-specific questions, especially for the aid items. Gigliotti 18 provides psychometric evidence that situation-specific NSSQ items are valid and reliable and offers guidance regarding their use. This avenue holds promise for additionally improved score accuracy.
Implications for research
The NSSQ-R.n/a produced the most accurate scores. Removal of the Aid examples is warranted not only by results of this study but also because their removal makes these items usable in multiple contexts. As Gigliotti and Samuels 4 note, without examples, participants are free to interpret short- and long-term aid as they see fit and as is relevant for the particular research context or measured population. Without specific examples, a young parent may interpret aid as childcare while an older person may think of assistance with shopping. Also, this version’s addition of the “n/a” option provides a socially acceptable means to “drop” a network member when that network member cannot or would not be expected to provide that type of support. Examples could be aid from one’s child or affection from one’s employer. Our sample was predominately female as well, so further research could consider, for example, whether aid examples are interpreted differently by one’s gender, lifestyle, and so on.
Finally, the NSSQ-R.n/a uses the original format where the participant lists their network supporters before turning the pages and rating these supporters and this was found to be superior to the revised format’s (NSSQ-R.format) nomination process, shown in Figure 2. This study’s results show that the revised format’s nomination/rating method highly influences the nomination process. Specifically, it appears that after participants read the support items, some participants chose to nominate only those supporters who could provide all three types of support. Importantly, this does not reflect reality. We all have supporters who may be able to give only one or two types of support. Making provision of all three types of support a criterion for nomination, as some seemed to do, resulted in severe score restriction for averaged Affect items. Although use of the original nominating format may result in some missing data because participants did not know the extent of their involvement, this study’s results did not show a statistically significant difference in missing data rates among versions.
Footnotes
Declaration of conflicting interests
The author(s) declared no potential conflicts of interest with respect to the research, authorship, and/or publication of this article.
Ethical approval
Ethical approval for this study was obtained from the City University of New York (CUNY) 2015-0536.
Funding
The author(s) disclosed receipt of the following financial support for the research, authorship, and/or publication of this article: This work was supported by the Professional Staff Congress (PSC) of The City University of New York (CUNY) (PSC-14).
Informed consent
Informed consent was not sought for this study because of sensitive nature of questions regarding social support. Participants were informed verbally and in the introduction letter that participation was regarded as tacit consent. Institutional review board (IRB) approval was given for collection of anonymous data.