
Abstract
Objectives:
FitnessGram is commonly used to measure physical fitness and improve physical activity and health in youth. However, little is known about its use for informing physical activity and health promotion policy within schools and school districts, especially from the perspective of key decision-makers like principals. Therefore, this study examined physical education teachers’ and principals’ perceptions of FitnessGram use and its relationship with school and district efforts to promote physical activity.
Methods:
Principal and physical education teacher surveys were developed, converted to an online format, and then emailed along with a project description and instructions to all Delaware public and charter school physical education teachers (N = 183) and principals (N = 193) with a valid email.
Results:
Completed surveys were received from 35.5% of the teachers and 21.2% of the principals. All teachers and 95.1% of the principals reported their school used FitnessGram the past academic year. FitnessGram was significantly more likely to be used if FitnessGram results better aligned with school/district policies (r = 0.39) and were considered important in the school’s decision-making process (r = 0.53). Significantly more principals than teachers said that FitnessGram results were important in their school’s decision-making process and that FitnessGram results were used to inform policy-/decision-making.
Conclusion:
Use of FitnessGram was correlated with how well it related to school/district policy. Unfortunately, most of the physical education teachers and principals did not think FitnessGram was adequately integrated into the policy-/decision-making process.
Introduction
As of 2015, one out of five children in the United States is obese, putting them at risk for becoming obese adults and developing diabetes, hypertension, and other adverse health problems. 1 Globally, there were 113 million more obese 5–19 year olds in 2016 than in 1975, with an additional 213 million considered overweight. 2 With physical inactivity being one of the most significant etiological factors in childhood obesity, researchers have suggested that physical education (PE) should play a more substantial role in obesity prevention, and public health organizations have asked schools to improve their efforts to counter rising rates of childhood obesity.3–6 Part of the school system’s potential to reduce obesity in children might stem from PE’s use of effective assessment and education methods related to physical fitness which have been shown to positively impact physical activity in children.3,7
The most common approach for assessing youth physical fitness in a school-based setting is the FitnessGram. 8 The goals of this type of testing are to measure health-related physical fitness and improve physical activity.3,9 Numerous PE interventions that use FitnessGram have successfully met these goals. For example, FitnessGram Friday (a PE-based intervention designed to improve FitnessGram assessment scores) resulted in significant improvements in physical fitness levels among middle-school-aged boys and girls, and the use of FitnessGram to inform school-based health promotion programs in the NFL PLAY 60 FitnessGram Partnership Project was associated with significant improvements in student aerobic capacity and body mass index (BMI).10,11 The Texas Youth Fitness Study was able to track longitudinal BMI trends from 2008 to 2009 using FitnessGram version 10 to gain knowledge concerning the health status of students, and another study suggested that statewide, school-based fitness tests have the potential to inform policies related to PE and physical activity opportunities in youth.12,13
Despite the benefits of fitness testing in general and the FitnessGram specifically, there is uncertainty regarding the long-term effects of fitness testing on physical activity and obesity rates in youth.14,15 This uncertainty primarily stems from the limited breadth (not quantity) of empirical evidence on the FitnessGram. 16 For instance, Gard and Pluim 16 pointed out that the majority of studies on FitnessGram were conducted by individuals who were involved with the direct development of FitnessGram and/or served as FitnessGram advisory board members. The resulting scope of work in this area has been narrowly focused on youth fitness and behavior outcomes rather than perceptions of PE teachers in relation to fitness testing and FitnessGram utilization.3,4,17,18 One of these studies demonstrated a significant relationship between PE teachers’ perceptions about FitnessGram and their use of FitnessGram for instructional purposes. 3 Valuable insights could be gained by extending this line of inquiry to include viewpoints about FitnessGram from principals who are key school decision-makers and extending questioning to encompass areas related to FitnessGram’s impact on school and school district policies toward physical activity and health promotion. A closer examination of the knowledge possessed by principals concerning how FitnessGram is used in the classroom and of the knowledge held by PE teachers regarding the rules/policies related to FitnessGram’s use has the potential to stimulate innovation. Innovation not only into how FitnessGram is used to benefit youth but also how it can be optimally integrated into the procedures and policies that govern health promotion in schools. Research on organizational performance clearly shows that organizations are more successful in achieving their goals when upper management (akin to school principals) and subordinates (akin to teachers) are knowledgeable about both the rules/policies governing organizational functions and what is actually occurring on a daily basis in the organization.19,20 Therefore, this study was undertaken to describe PE teachers’ and principals’ perceptions of FitnessGram use and examine relationships between these perceptions and broader school and school district efforts to promote physical activity.
Methods
Participants/procedures
The State of Delaware (DE) Department of Education records and individual school websites were used to compile a list of names and contact information for all PE teachers (N = 187) and principals (N = 216) currently employed at DE public and charter k-12 schools. All teachers and principals were sent an email containing a brief introduction, a description of the project, instructions, and a link to a questionnaire. Delivery of emails to 4 PE teachers and 23 principals failed due to invalid email accounts. Of those with valid emails, completed surveys were received from 65 PE teachers and 41 principals after a 1-month period containing reminder emails sent 1 and 3 weeks after the initial email. The corresponding response rates based on the presence of a valid email were 35.5% (65/183) for PE teachers and 21.2% (41/193) for principals. These response rates are above the rate of 20.7% achieved by Miller et al. 3 using similar methods in their study of PE teachers’ perceptions of the FitnessGram and are considered acceptable for obtaining a representative sample in survey research. 21 The research protocol was reviewed by the University’s Institutional Review Board for the protection of human subjects (IRB# 1160830-1) and given exempt status (did not require informed consent).
Questionnaire
A questionnaire was developed for this study according to commonly used procedures. 22 Content evidence validity was established using a two-stage, expert panel review. In stage one, panel members representing health behavior, exercise science, biostatistics/survey construction, public health, health policy studies, and PE pedagogy reviewed each item and proposed revisions. During stage two, panel members reached consensus on proposed revisions to maximize face and content validity. The final version contained 32 items, of which 25 were relevant to this analysis. Of them, 7 items asked for basic descriptive information (grade levels assessed with FitnessGram during the past year and past 5 years, other programs offered to promote physical activity, school and district names, PE teachers’ and principals’ estimates of the amount of minutes students were actually active in PE, and the participant’s occupation), 4 items pertained to the integration of FitnessGram with school and school district programs/policies, 10 items were related to the use of FitnessGram in PE classes (e.g. Fitness test results are used to help students setup their future fitness goals), and 4 items were about the use of FitnessGram for students with an Individualized Education Program (IEP) (e.g. FitnessGram was used to test fitness levels in students with an IEP). The questionnaire was internally consistent as evidenced by a high Cronbach’s alpha statistics for both PE teachers (α = 0.87) and principals (α = 0.90).
The questionnaire was converted to an online format using a commercially available survey development/data management program (Qualtrics, Provo, UT, USA), and a link to the questionnaire was created and included in the email. The online questionnaire contained multiple-choice and open-ended questions with built-in features allowing for automatic skip patterns and forced answers. All responses were collected using Qualtrics, converted to an exportable data format, and downloaded to a database for analysis.
Data analysis
Descriptive statistics were generated for all variables and the assumptions (normality, linearity, homoscedasticity, homogeneity of variance, multi-collinearity, and the presence of outliers) were investigated and found to be within acceptable limits for the statistical tests employed. The 10 items related to the use of FitnessGram in PE classes and the four items about the use of FitnessGram for students with an IEP included a Likert-type scale ranging from 1 = never to 7 = always. The sum of the 10 items and sum of the 4 items were used in the analyses (possible range: 10–70 and 4–28, respectively). Responses from PE teachers and principals were compared using Chi-square test for categorical variables with continuity correction if dichotomous and Student’s t-tests for continuous variables. Pearson product–moment correlation was used to examine bivariate relationships among study variables. The significance level was set at α < 0.05, and all analyses were conducted using the SPSS statistical software package (IBM SPSS Statistics for Windows, Version 23.0, Released 2015; IBM Corp., Armonk, NY, USA).
Results
All of the PE teachers and 95.1% of the principals reported that their school used the FitnessGram in the past academic year and 93.8% of the PE teachers and 85.4% of the principals said the FitnessGram was used at least 3 out of the past 5 years. Reported use during the past year (χ2(1, 106) = 1.12; p = 0.29) and past 5 years (χ2(1, 106) = 1.82; p = 0.18) did not differ between PE teachers and principals. As can be seen in Figure 1, most of the PE teachers and principals indicated that peak FitnessGram use occurred in the 4th, 7th, and 9th grades and that it was seldom used in the 1st and 2nd grades. Although this is consistent with the Delaware Department of Education (DOE) regulations requiring annual testing of and reporting on all students in grades 4th, 7th, 9th or 10th grades, it also shows that the FitnessGram was used in additional grades not included in the regulations. 23

Percentage of PE teachers who used FitnessGram and principals who said FitnessGram was used in specific grades during the past academic year.
Described in Table 1 are respondent perceptions of the integration of FitnessGram with school and school district policies/programs. Significantly, compared to principals, a smaller percentage of PE teachers indicated that FitnessGram results were important in their school’s decision-making process (χ2(1, 102) = 5.19; p = 0.02) and that their school currently uses FitnessGram results to inform PE or school-based physical activity policy and program decisions (χ2(1, 102) = 8.91; p = 0.003). Similarly, smaller percentages of PE teachers reported that their school district policies align well with FitnessGram outcomes compared to principals (50% of PE teachers and 71.1% of principals) and that their schools made PE or school-based physical activity policy program changes based on the FitnessGram results (6.9% of PE teachers and 16.0% of principals); however, these differences were not statistically significant (χ2(1, 102) = 3.51; p = 0.061 and χ2(1, 102) = 0.78; p = 0.377, respectively).
FitnessGram integration with school and school district policies/programs according to Delaware PE teachers (n = 65) and principals (n = 41).

PE: physical education.
χ2(1, 102) = 3.51; p = 0.061 (continuity correction).
χ2(1, 102) = 5.19; p = 0.023 (continuity correction).
χ2(1, 102) = 8.91; p = 0.003 (continuity correction).
χ2(1, 102) = 0.78; p = 0.377 (continuity correction).
The two summary score variables related to FitnessGram use in PE classes and FitnessGram use for students with an IEP did not differ significantly between PE teachers and principals (FitnessGram use in PE: M = 45.4, SD = 13.4 for PE teachers and M = 47.4, SD = 14.7 for principals; t = −0.72; p = 0.47 and FitnessGram use with IEPs: M = 20.4, SD = 4.8 for PE teachers and M = 18.8, SD = 5.4 for principals; t = 1.67; p = 0.10). With PE teachers and principals combined (Table 2), correlational analysis indicated that for both variables about FitnessGram use, higher summary scores (meaning greater use) were positively correlated with better alignment between FitnessGram outcomes and school and district policies (r = 0.49; p < 0.001), greater importance regarding the use of FitnessGram results in the school’s decision-making process (r = 0.56; p < 0.001), a greater number of programs/initiatives offered at the school to promote physical activity (r = 0.64; p < 0.001), the min/day students were estimated by study participants to be actually active in PE class (r = 0.31; p < 0.005), and higher grade levels (greater use in high vs middle vs elementary) (r = 0.21; p < 0.05). Finally, FitnessGram use in PE was positively correlated with FitnessGram use with children having an IEP (r = 0.64; p < 0.001).
Correlates of FitnessGram use in PE classes and in students with an IEP (Pearson r values reported in table).
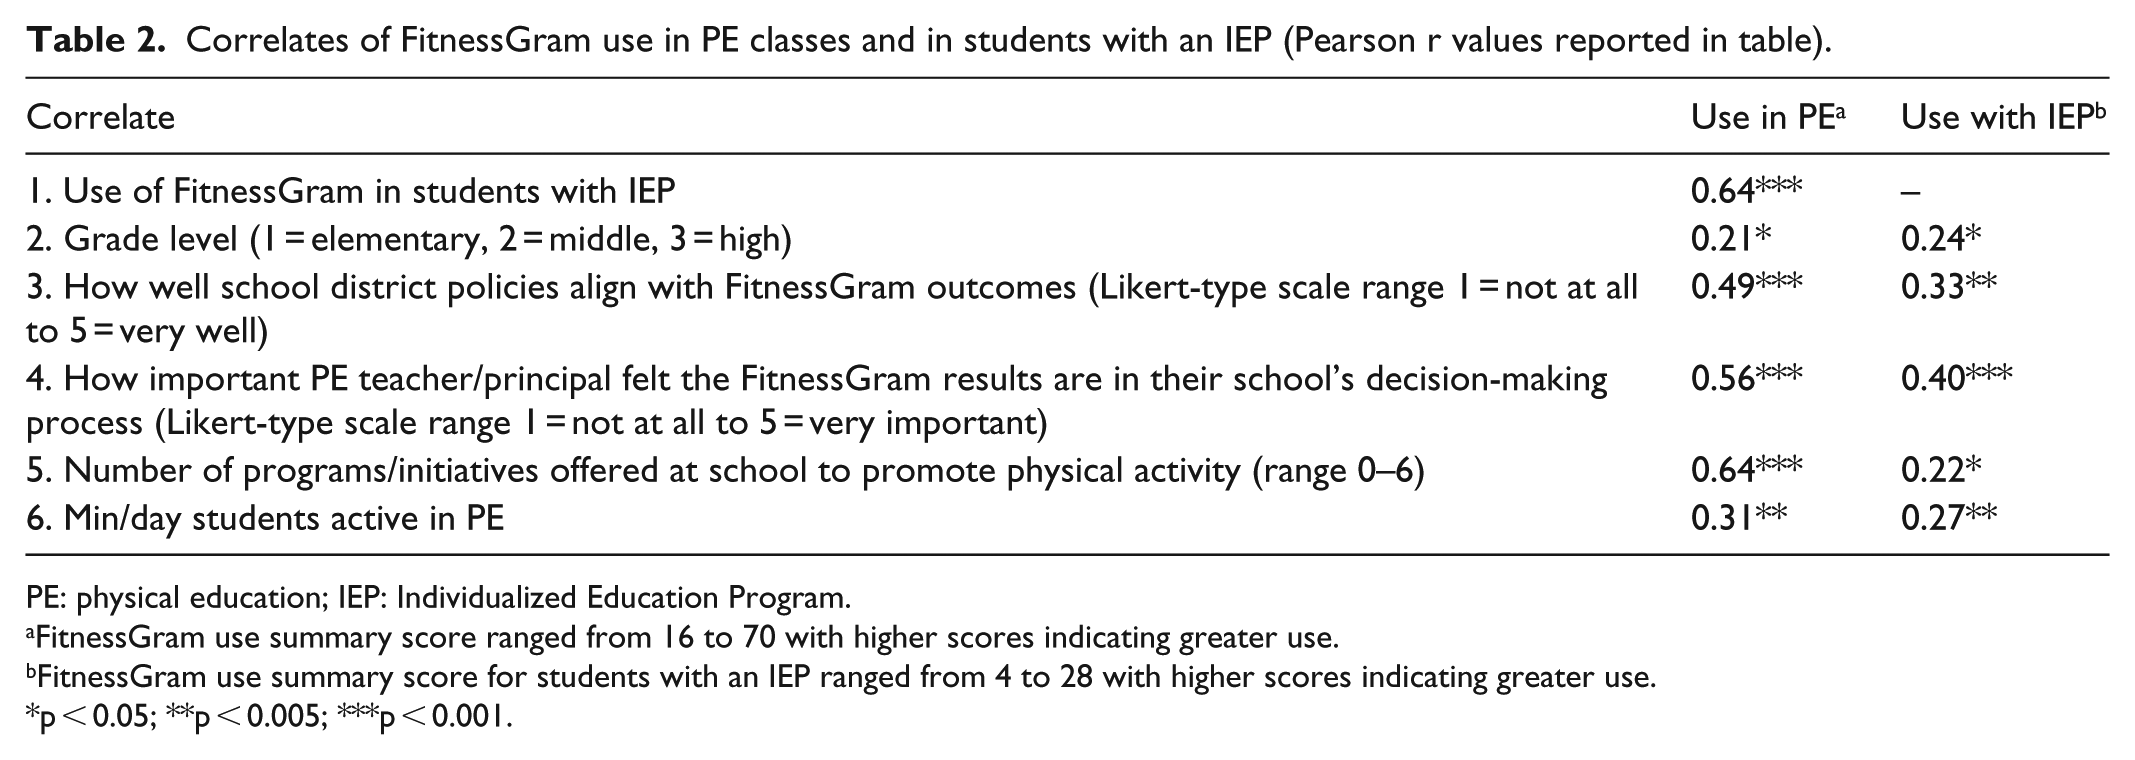
PE: physical education; IEP: Individualized Education Program.
FitnessGram use summary score ranged from 16 to 70 with higher scores indicating greater use.
FitnessGram use summary score for students with an IEP ranged from 4 to 28 with higher scores indicating greater use.
p < 0.05; **p < 0.005; ***p < 0.001.
Discussion
In this study, FitnessGram was found to be utilized in elementary, middle, and high schools in accordance with State regulations, which is consistent with findings reported previously. 24 This is encouraging because the use of FitnessGram has been shown to have a positive impact on physical fitness and fitness testing in youth.25–27 It also has been used to assess students’ physical fitness and evaluate the impact of PE programming on youth health indicators including aerobic capacity and BMI.25,28 Although the Delaware DOE requires FitnessGram data to be entered by PE teachers using the online portal, we could not locate any summary reports regarding either the test outcomes or evidence linking FitnessGram testing to health behaviors and health outcomes in Delaware students. Developing the capacity to collect, analyze, and disseminate information about FitnessGram is a significant undertaking, but one that has been successfully accomplished.18,29,30 Nevertheless, until multi-state-level evidence is consistently produced (e.g. via longitudinal surveillance), criticisms of FitnessGram and fitness testing use in youth will continue and it will remain difficult to conclusively regard FitnessGram as an integral part of population-level health promotion.
Researchers have recently increased their examination of the potential links between FitnessGram use/results and policies governing PE or broader health-related goals such as increasing physical activity or reducing obesity.31,32 In 2010, Chang et al. 33 found that FitnessGram results from Delaware public schools were useful for initiating local- and state-level physical activity policy changes. The results of this study indicate that at a micro-level (classroom/school), FitnessGram and physical activity-related policies are not well integrated, a finding similar to those of others showing discordance between state- and district-level policies and school-level policies.34,35 This disconnect requires further study, especially given new research demonstrating that FitnessGram outcomes have the potential to inform PE policy formation as well as farther reaching public health policies that govern physical activity guidelines.31,32 Moreover, the relationship between FitnessGram and policy may be reciprocal as well as more dynamic. For example, in this study, one interpretation of findings of the correlational analyses is that better integration between FitnessGram and policy-/decision-making processes results in greater use of FitnessGram, and the more FitnessGram is used, the more time students spend during PE being physically active. This is speculative, and the potential causal pathway(s) among these variables/outcomes will require additional research.
Significantly lower percentages of PE teachers than principals thought FitnessGram aligned well with school district policies or was important in their school’s decision-making process regarding PE or school-based physical activity policy and program decisions. To our knowledge, this is a novel finding given that previous research only included PE teachers and did not examine principals’ perceptions, or the role FitnessGram played in school-level physical activity policy and program decisions. It is possible that the differences represent true gaps in knowledge. Principals may know more about policy and program decisions, especially at the school and district levels, because they are closer to the process than PE teachers. Alternatively, PE teachers may have a better understanding of how school-/district-level policies play out in the classroom. In either case, both PE teachers and principals could come to see a disconnect between FitnessGram and school policies/decisions about promoting physical activity, which is what was found in this study.
This study has limitations that should be considered when interpreting the findings. First, our results were derived from self-reports which could introduce biases (e.g. recall bias), they were based on data acquired using one methodology (e.g. survey), and we did not restrict reporting on FitnessGram use to grades included in the regulations (4th and above). It may be beneficial for future researchers to obtain more objective information (e.g. official records), conduct formative research (e.g. key informant interviews), and/or to focus on primary grade use given recommendations not to focus on FitnessGram results in grades below 4th. It also may be advantageous to capture additional information that could help explain FitnessGram’s role in the broader educational system’s initiatives to promote health. For example, examining whether the links shown and not shown between FitnessGram and student fitness are factored into the utilization of FitnessGram results for informing physical activity policy and program decisions. Finally, although we achieved our goal to obtain a sample of at least 20% of the population of principals and PE teachers in Delaware, the “non-responders” could have different perspectives. Given that the survey process was anonymous, we did not have a way to compare our sample with those not returning surveys.
Conclusion
The results of this study further support the contention that FitnessGram could be integral for helping form policies that impact health. They suggest that this potential may be attenuated because of less-than-favorable integration of FitnessGram and policy at the school/classroom levels. Although PE teachers and principals had differing perceptions regarding the integration of FitnessGram with school policy-/decision-making process, both said FitnessGram was not aligned well with or important in this process. It will be important for future research to examine pathways connecting FitnessGram, policy, physical activity promotion at various levels (e.g. classroom, community), and health indicators at the individual and population levels. In addition, because variances in perceptions of FitnessGram are a possibility (at least by occupation), further study is warranted to examine how differences in perceptions of FitnessGram alter how FitnessGram is used. Given today’s technology, several innovative approaches could be developed to improve how FitnessGram is used to benefit youth as well as how FitnessGram results can be used to advance school health promotion efforts. For instance, applications (i.e. “apps”) and secure data sharing platforms could be utilized to provide a variety of interested parties (e.g. principal, parent, and health care provider) relevant and up-to-date information related to FitnessGram outcomes including details on how and when it was implemented.
Footnotes
Declaration of conflicting interests
The author(s) declared no potential conflicts of interest with respect to the research, authorship, and/or publication of this article.
Funding
The author(s) disclosed receipt of the following financial support for the research, authorship, and/or publication of this article: This work was supported by the Delaware Division of Public Health.