
Abstract
Background:
Many older adults have multiple conditions and see multiple providers, which may impact their use of essential medications.
Objective:
We examined whether the number of prescribers of these medications was associated with the availability of medications, a surrogate for adherence, to manage diabetes, hypertension or dyslipidemia.
Methods:
A retrospective cohort of 383,145 older adults with diabetes, hypertension or dyslipidemia in the US Medicare program living in 10 states. The association between the number of prescribers of cardiometabolic medications in 2010 and medication availability (proportion of days with medication on hand) in 2011 was estimated via logistic regression, controlling for patient demographic characteristics and chronic conditions.
Results:
Medicare beneficiaries with diabetes, hypertension and/or dyslipidemia had an average of five chronic conditions overall, obtained 10–12 medications for all conditions and most often had one prescriber of cardiometabolic medications. In adjusted analyses, the number of prescribers was not significantly associated with availability of oral diabetes agents but having more prescribers is associated with increased medication availability in older Medicare beneficiaries with dyslipidemia or hypertension.
Conclusion:
The incremental addition of new prescribers may be clinically reasonable for complex patients but creates the potential for coordination problems and informational discontinuity over time. Health systems may want to identify complex patients with multiple prescribers to minimize care fragmentation.
Keywords
Background
The development of care models for patients with multiple chronic conditions (MCCs) is a pressing issue1,2 because MCC patients (also referred to as multimorbid patients) incur a disproportionate share of total expenditures, and clinical guidelines rarely address their needs. 3 To date, MCC-related research has focused on assessments of MCC prevalence and patterns4,5 or on the association between MCCs and quality of care, 6 cost 7 or patient outcomes. 8 Less research has focused on mechanisms by which multimorbidity is associated with adverse outcomes.
Care continuity may be such a mechanism for older adults because a typical Medicare beneficiary with MCCs sees multiple providers and the number of providers increases with the number of chronic conditions. 9 The effectiveness of care coordination among providers appears to impact patient outcomes: continuity of outpatient care for older adults enrolled in the traditional Medicare program (also referred to as Medicare fee-for-service (FFS)) has been associated with lower risk of all-cause admission,10,11 preventable admission 12 and emergency department visits.10,11 A majority of older adults take five or more medications and many take 10 or more medications, 13 so continuity of medication management and reconciliation are also likely to be critical components of care models that are effective for MCC patients. Since one-third to one-half of patients in the United States do not take their medications, 14 it is important to consider the important role of prescribing providers in managing the medication regimens of older adults.
Care continuity in the context of medication management can be understood by focusing on the subset of providers who prescribe medications. Some providers seen by a patient prescribe medications (referred to herein as “prescribers”), while other providers will simply provide clinical consultation. 15 Providers who prescribe medication may have a greater impact on the health of a complex patient than providers who do not prescribe medication because medications are essential to the effective management of chronic conditions. The number of prescribers managing a patient’s medication regimen reflects both 16 interpersonal continuity (an ongoing relationship between a patient and provider) and management continuity (coordination among providers to deliver complementary, timely services along a recommended care pathway). The number of prescribers may be more strongly correlated with intermediate outcomes (e.g. medication availability, disease control) than continuity measures based on the number of providers seen during outpatient visits because provider-based continuity measures reflect who the patient has seen but nothing about the content of the visits.
There are different trade-offs related to interpersonal and management continuity for MCC patients with a single prescriber and for patients with multiple prescribers. Patients may be more likely to receive the full set of guideline-concordant preventive care and chronic disease management from multiple prescribers that is difficult to obtain from a single (primary care) provider (PCP) or general practitioner. 17 For example, cancer survivors seeing both a PCP and an oncologist are more likely to receive vaccinations, mammograms and cancer screening than survivors only seeing a PCP or only an oncology specialist. 18 Similarly, shared care between multiple providers may improve medication availability to essential medications by mutually reinforcing care plans. On the other hand, care plans and prescription regimens from multiple prescribers may complicate medication management and contribute to medication non-use. 19 Medication mismanagement by providers may also arise due to miscommunication or reduced accountability 20 among multiple prescribers, especially prescribers in unaffiliated practices lacking informational continuity supported by electronic health records (EHRs).
Prior research on number of prescribers and medication-related outcomes has yielded mixed results. More prescribers were positively associated with refill availability to anti-psychotic medications in Medicaid patients. 21 However, more prescribers were associated with the use of potentially inappropriate medications by older adults22–24 and refill non-availability to anti-hypertensive and lipid-lowering medications in veterans. 25 The association between prescribers and medication availability has not been examined in traditional Medicare beneficiaries who are managed by prescribers commonly lacking an interoperable EHR that would facilitate care coordination and informational continuity. This study examined whether medication availability was associated with the number of prescribers in a cohort of traditional Medicare beneficiaries with common comorbid conditions (diabetes, hypertension or dyslipidemia). It is important to understand whether continuity of care in the context of medication management may serve an important building block of effective care models for older adults with MCCs.
Methods
Data and participants
In this retrospective cohort study, we used 2010–2011 Beneficiary Summary Files (BSF) and Medicare Part D files on the population of all traditional Medicare beneficiaries living in 10 states that were selected for a project linking laboratory results data to Medicare claims (Figure 1). 26 Demographic characteristics were identified from the BSF, and comorbid conditions were drawn from the Chronic Condition segment of the BSF. Part D Prescription Drug Event (PDE) files in 2010–2011 were used to identify oral medications to manage diabetes, hypertension and dyslipidemia, and the 2010 Prescriber Characteristics File was used to identify the count of prescribers of these medications. We examined these three conditions because they are the highest prevalent single, dyad and triad of conditions in the traditional Medicare population. 4

Consort figure for study cohort.
Medicare beneficiaries included for analysis were 65–80 years old on 1 January 2010; were enrolled in Parts A, B and D all of 2010 and 2011; and alive on 31 December 2011 (Figure 1). Medicare Advantage enrollees were excluded due to lack of claims. To assess management of diabetes, hypertension or dyslipidemia, we included patients who had a diagnosis for any of these three conditions on or before 30 December 2010 based on end-of-year indicators from the Chronic Condition Data Warehouse. Beneficiaries with diagnosed diabetes, hypertension or dyslipidemia without 2011 laboratory results data were excluded because glucose and lipid control were outcomes of interest in separate analyses. Beneficiaries with end-stage renal disease and less than 90 days of medication for each condition in 2010 were also excluded. Finally, we excluded beneficiaries who obtained one or more fill of cardiometabolic medications from prescribers whose specialty could not be determined from the Part D Prescriber Characteristics File. Our final analytic cohort included 383,145 traditional Medicare beneficiaries with diagnoses of diabetes (n = 100,191), hypertension (n = 299,949) and/or dyslipidemia (n = 243,598).
Outcome and explanatory variable of interest
The outcome of medication availability in 2011 was constructed from the Part D PDE file (see Appendix 1 for medications). For each day in 2011, we calculated whether each beneficiary had one or more oral cardiometabolic medications on hand from an existing fill to construct a continuous outcome of Proportion of Days Covered (PDC), which has been used in studies of medication claims data. Medications used to construct PDC were specific to the primary condition in each cohort. For example, only oral hypoglycemic agents were used to construct PDC in the diabetes cohort. Insulin was excluded because there is no validated method for constructing medication availability for insulin. A patient with oral medication available every day of the year was assigned a PDC value of 1.0, representing perfect availability. This continuous outcome was dichotomized to equal 1 if PDC was greater than or equal to 0.80 and equal to 0 otherwise, which is highly correlated with self-reported adherence. 27
The explanatory variables of interest were the total number of all prescribers of medications to manage diabetes, hypertension or dyslipidemia, lagged by 1 year from the outcome to reduce simultaneity bias. We constructed the number of unique prescribers by linking the 2010 Prescriber Characteristics File to the 2010 PDE file via the Chronic Condition Warehouse Prescriber ID variable. The number of prescribers was constructed by counting any prescriber who wrote a prescription for a cardiometabolic medication obtained for one of these three conditions. Unlike prior analyses of Medicare beneficiaries10,12 that used continuity indices reflecting concentration of visits among providers, a continuous prescriber count fully accounts for every prescriber who adds to a patient’s medication regimen including prescribers refilling medications initiated by another prescriber (whether this actually occurred could not be assessed). Moreover, this prescriber count measure has face validity and does not require exclusion of beneficiaries with too few visits. 12
Data analysis
For each of the three cohorts, we generated means and standard deviations for continuous patient characteristics and proportions of binary characteristics. Unadjusted differences in medication availability by number of prescribers (non-specific and cardiometabolic) were examined graphically. A logistic regression of binary (>80%) medication availability in 2011 was then estimated as a function of a categorical non-specific prescriber variable (two prescribers, three prescribers, four prescribers, five or more prescribers in 2010; one prescriber was the reference group) and the regression adjusted for other covariates. The regression adjusted for age, gender, race, Medicaid enrollment; 17 chronic conditions available from the Chronic Condition segment of the BSF; and state-fixed effects. The chronic conditions included acquired hypothyroidism, atrial fibrillation, anemia, asthma, benign prostatic hyperplasia, cancer (as a combination of breast, colorectal, prostate, lung and endometrial cancer), chronic kidney disease, chronic obstructive pulmonary disease (COPD), dementia/Alzheimer’s disease/related conditions, depression, heart failure, ischemic heart disease, osteoporosis, rheumatoid arthritis/osteoarthritis, and stroke. Finally, we controlled for the number of all medications obtained in 2010 because polypharmacy has been associated with numerous adverse outcomes in Medicare beneficiaries. 28 Waivers of Consent and data access as required by the 1996 Health Insurance Portability and Accountability Act were obtained for this study from the Institutional Review Board at Duke University, Durham, North Carolina. The data supporting the conclusions of this article cannot be shared due to requirements of the Data Use Agreement with the Centers for Medicare and Medicaid Services, which restrict data access only to the study team.
Results
Patient characteristics
Participants’ characteristics according to each cohort can be seen in Table 1. In the diabetes cohort, the average age was 73 years, 57% of beneficiaries were females, 76% were white race and 18% were dually enrolled in Medicaid (Table 1). Beneficiaries with diabetes had an average of 5 comorbid conditions (including diabetes) and took an average of 12.3 medications for all conditions. Almost half (48%) of beneficiaries with diabetes had a single cardiometabolic prescriber in 2010, 30% had two prescribers, 13% had three prescribers, 5% had four prescribers and 3% had five or more cardiometabolic prescribers.
Baseline (2010) characteristics of Medicare beneficiaries by condition.

COPD: chronic obstructive pulmonary disease; SD: standard deviation.
Beneficiaries in the hypertension cohort had similar demographic characteristics as beneficiaries with diabetes but had slightly fewer comorbid conditions (including hypertension) on average (4.5) and fewer medications (11.1) for all conditions. About 57% of beneficiaries with hypertension had a single cardiometabolic prescriber in 2010, 28% had two prescribers, 10% had three prescribers, 3% had four prescribers and 1% had five or more cardiometabolic prescribers.
Beneficiaries in the dyslipidemia cohort had similar demographic characteristics as beneficiaries in the other two cohorts, with similar number of comorbid conditions (4.5) and medications (10.8) for all conditions as the hypertension cohort. About 59% of beneficiaries with dyslipidemia had a single cardiometabolic prescriber in 2010, 27% had two prescribers, 10% had three prescribers, 3% had four prescribers and 1% had five or more cardiometabolic prescribers.
Number of prescribers and medication availability
In unadjusted analysis of the diabetes cohort, patients with one cardiometabolic prescriber had oral hypoglycemic agents available 56% of the year and patients with five or more cardiometabolic prescribers had oral agents available 51% of the year (Figure 2). Consistent with the unadjusted results in Table 2, the number of prescribers was not associated with the availability of oral hypoglycemic agents in adjusted analyses (see Appendix 2 for the full set of adjusted results).

Unadjusted proportion of traditional Medicare (FFS) beneficiaries with sufficient medication availability in 2011, stratified by number of unique prescribers and cardiometabolic condition.
Logistic regression results of 2011 medication availability using 2010 overall prescriber count.
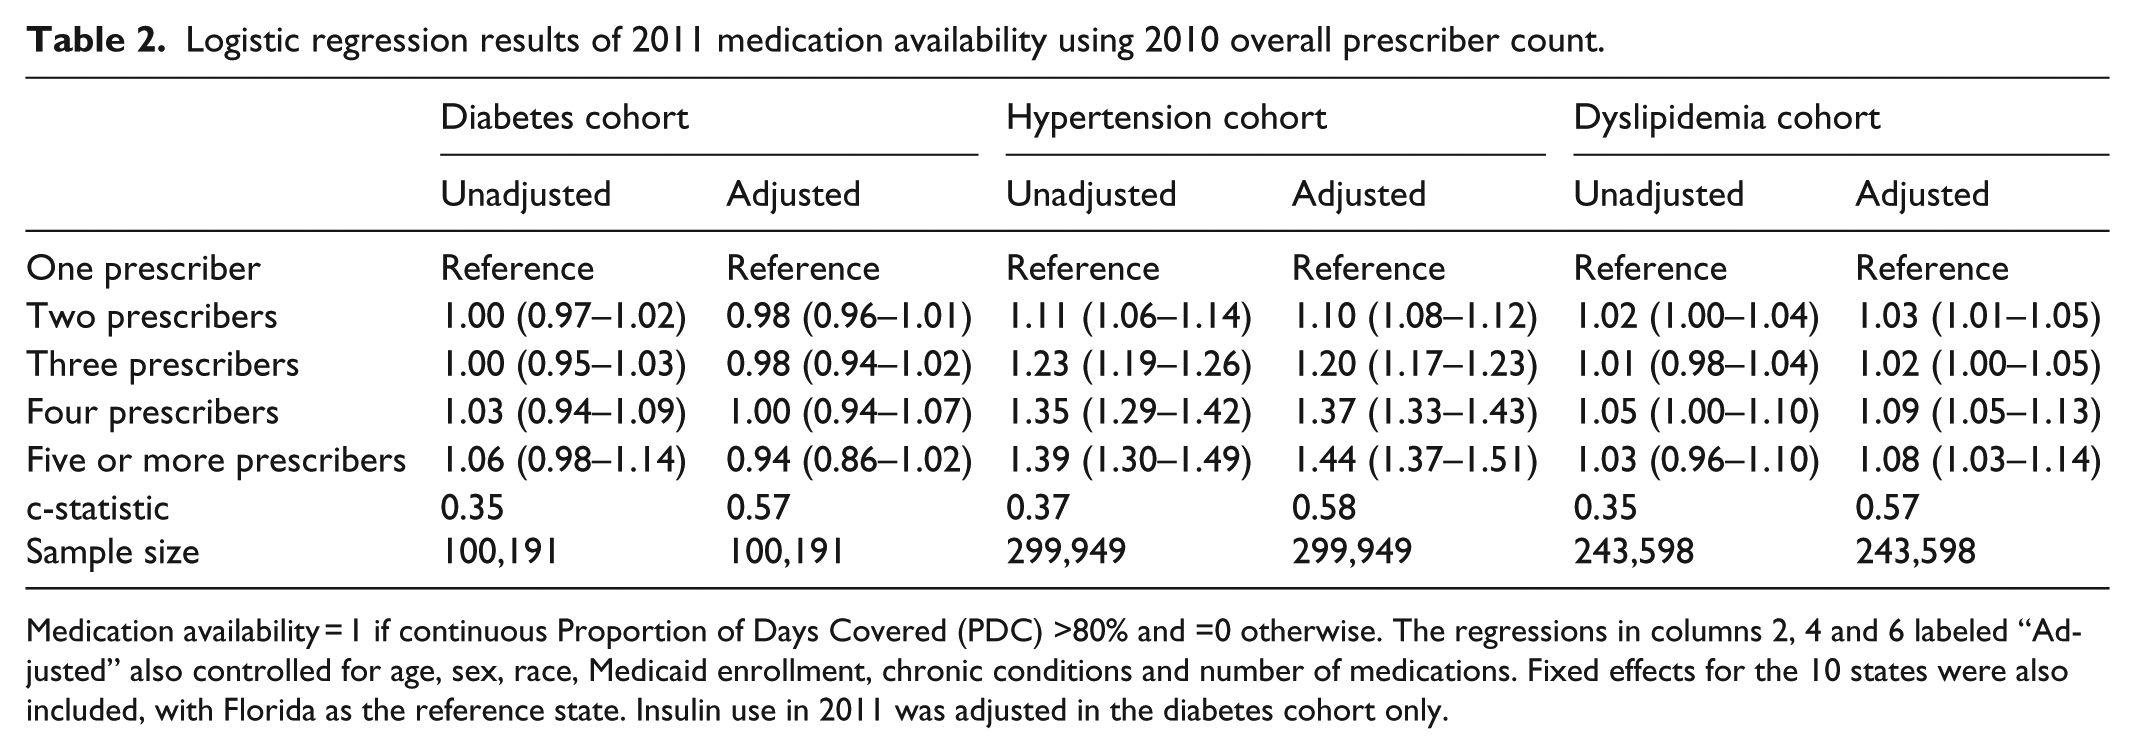
Medication availability = 1 if continuous Proportion of Days Covered (PDC) >80% and =0 otherwise. The regressions in columns 2, 4 and 6 labeled “Adjusted” also controlled for age, sex, race, Medicaid enrollment, chronic conditions and number of medications. Fixed effects for the 10 states were also included, with Florida as the reference state. Insulin use in 2011 was adjusted in the diabetes cohort only.
In the hypertension cohort, patients with one cardiometabolic prescriber had anti-hypertensive medications available 61% of the year and patients with five or more cardiometabolic prescribers had oral agents available 72% of the year (Figure 2). Unadjusted results were similar to adjusted results, which found that patients with two prescribers (odds ratio (OR) = 1.10; 95% confidence interval (CI) = 1.08–1.12), three prescribers (OR = 1.20; 95% CI = 1.17–1.23), four prescribers (OR = 1.37; 95% CI = 1.33–1.43) or five or more prescribers (OR = 1.44; 95% CI = 1.37–1.51) had higher odds of medication availability than patients with one prescriber (Table 2).
In unadjusted analysis of the dyslipidemia cohort, patients with one cardiometabolic prescriber had lipid-lowering medications available 45% of the year and patients with five or more cardiometabolic prescribers had lipid-lowering medications available 51% of the year (Figure 2). Consistent with unadjusted analyses (Table 2), adjusted analysis found that patients with two prescribers (OR = 1.03; 95% CI = 1.01–1.05), four prescribers (OR = 1.09; 95% CI = 1.05–1.13) or five or more prescribers (OR = 1.08; 95% CI = 1.03–1.14) had modestly higher odds of sufficient medication availability than patients with one prescriber.
Discussion
There is increasing recognition that evidence is urgently needed to identify care models that effectively manage older adults with MCCs. 1 Care coordination is likely to be a critical element of effective care models. However, care is often poorly coordinated for Medicare beneficiaries because traditional Medicare payment does not provide incentives for care coordination, the lack of interoperable EHRs complicate collaboration across providers and settings and no single provider is formally accountable for care coordination. This study touched on care continuity by examining whether availability of medications to manage diabetes, hypertension or dyslipidemia was associated with the number of cardiometabolic prescribers in a cohort of older adults with cardiometabolic conditions.
We found that these beneficiaries had an average of five chronic conditions and complex medication regimens. We also found a positive association between medication availability and number of prescribers in beneficiaries with hypertension and a positive but more modest association for beneficiaries with dyslipidemia. No association was found in the diabetes cohort, which is consistent with a prior analysis of number of cardiometabolic prescribers and medication availability among veterans with diabetes. 25 The differing results across disease cohorts may be due to more conservative prescribing practices of providers seeing older adults with diabetes, variation in insulin availability that was not assessed or providers’ greater comfort prescribing common medications for hypertension and dyslipidemia.
Evaluation and adjustment of beneficiaries’ complex medication regimens is diffused among multiple providers for a majority of older adults with diabetes and a plurality of older adults with hypertension or dyslipidemia. In the short term, these results suggest that having multiple prescribers enables better medication availability for beneficiaries with hypertension or dyslipidemia. The incremental addition of new prescribers may be clinically reasonable (e.g. referral to provider with complementary expertise), but the accretion of prescribers without proactive repatriation back to primary care 29 may lead to care coordination problems and informational discontinuity over time. Although these results suggest that a greater number of prescribers results in higher likelihood that a complex patient receives cardiometabolic medications, future work is needed to determine the circumstances under which additional providers improve clinical outcomes in a manner consistent with high value care. Specifically, there may be an optimal number of prescribers in which too many should be avoided to improve care coordination and informational continuity but too few may result in suboptimal clinical expertise involved in the medication management of MCC beneficiaries. Future work should examine variability over time in prescribers and whether specific combinations of prescribers of different specialties are associated with medication availability, disease control and health expenditures for older adults with MCCs. Mechanisms for greater physician collaboration 30 may be necessary to ensure effective communication and co-management for beneficiaries who maintain multiple prescribers. 20
Greater availability of cardiometabolic medications from multiple prescribers may be due to single prescribers having insufficient time to provide all guideline-recommended care and medication management, 17 such that essential medications are more available in shared care arrangements. Alternatively, older adults’ medication availability may reflect multiple providers’ duplicative prescribing of similar medications in an uncoordinated manner. These significant results are consistent with prior work in which the number of prescribers was positively associated with medication availability by Medicaid patients 21 but are inconsistent with an analysis of hypertensive veterans, which found a negative association. 25 These mixed findings are somewhat surprising since the Medicare and veteran cohorts had similar proportions of individuals with multiple prescribers. There are several possible reasons for these different results. Veterans may receive more 30-day fills than Medicare beneficiaries and the medication availability outcome was constructed differently in the two studies. Furthermore, there are important system-level differences because prescribers of patients in the traditional Medicare program lack the US Veterans Health Care System’s integrated and long-standing national EHR, which may lead to greater informational discontinuity and mismanagement of medications initiated by providers in other medical practices.
A number of limitations must be acknowledged. First, these results may not generalize beyond the traditional Medicare beneficiaries in these 10 states in 2010–2011. Second, causal inference cannot be implied because this is a cross-sectional analysis of between-person differences, and the extent of simultaneity bias and the stability in the number and types of prescribers is unknown. Future work should employ a panel design to measure within-person changes over time in prescriber continuity and medication outcomes that avoid simultaneity bias and ideally adjust for confounders via novel data linkage or survey data. Future work is also needed to examine the association between the number of prescribers and several related medication-based outcomes (e.g. potentially inappropriate medications, adverse drug events, potential overtreatment) because multiple prescribing providers who are not coordinating medication management may increase the risk of these adverse medication outcomes. Randomized trials based on interventions that reduce discontinuity of medication management are also needed to examine whether the principle of more coordinated medication management can effectively improve medication availability and disease control. Third, we were unable to observe whether providers were in the same clinical practice or shared a common EHR. Fourth, these associations may be subject to unobserved confounding because we lacked data on disease severity, income, education and insulin use of Medicare beneficiaries, and the c-statistics of 0.57–0.58 indicated modest fit in a large sample that provided significant statistical power. Patients with more conditions or more severe conditions may have more prescribers (particularly specialists 9 ), so the estimated associations are likely biased away from the null. Finally, medication availability in this analysis is a surrogate for quality of care because most older adults with diabetes, hypertension or dyslipidemia should be taking medications to manage these conditions. However, it is clinically appropriate for older adults with mild disease to attempt diet/lifestyle modifications in place of medications and for older adults with severe disease or limited life expectancy to forego guideline-recommended treatment for a particular condition based on an assessment of risk/benefit and patient preferences. 31
Conclusion
In this study, we examined the association between numbers of prescribers and medication availability and found that the number of prescribers was not significantly associated with availability of oral diabetes agents. We also found that more prescribers were associated with greater medication availability in beneficiaries with hypertension and in beneficiaries with dyslipidemia. These results suggest that care coordination interventions may want to prioritize medication reconciliation and targeted communication for older adults with multiple prescribers. Recent work suggests that such efforts are a common attribute of programs that successfully manage high-cost patients. 32 These findings also serve an important foundation to address the long-term goals of ensuring sufficient coordination between prescribers. Care models that consider continuity of care in the context of medication management may effectively optimize outcomes of MCC beneficiaries if confirmed in future work.
Footnotes
Appendix
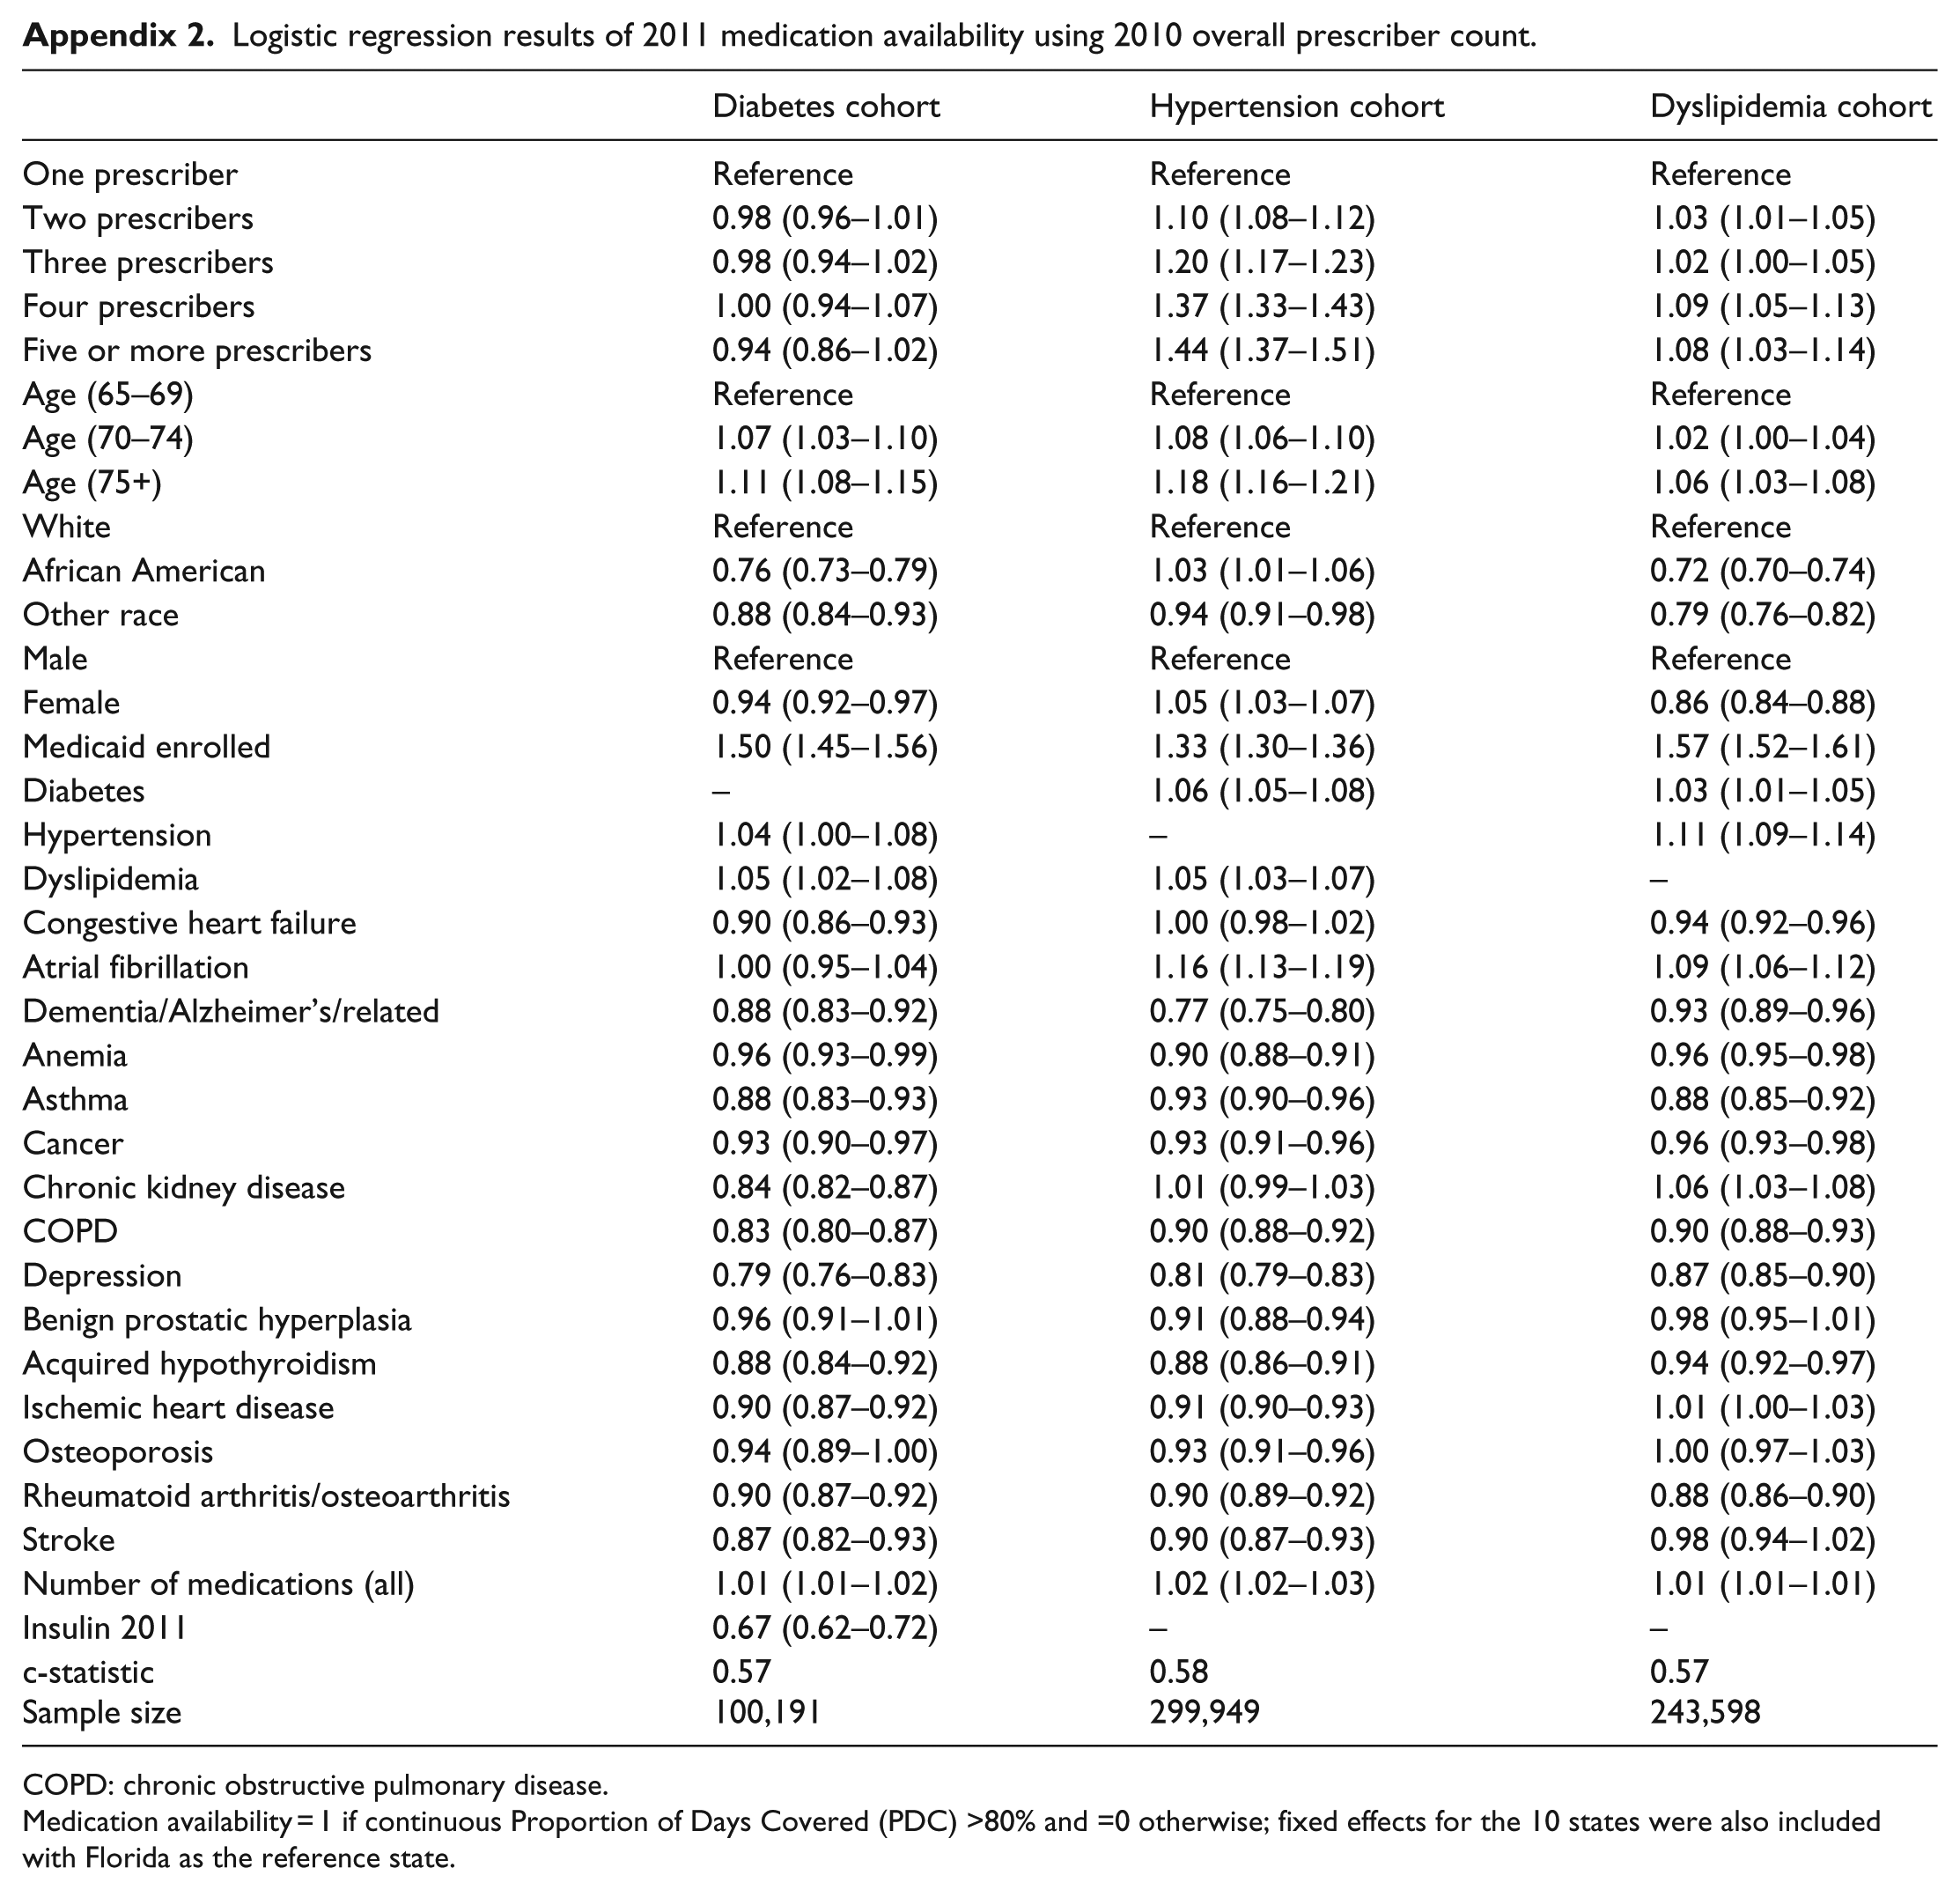
Logistic regression results of 2011 medication availability using 2010 overall prescriber count.
| Diabetes cohort | Hypertension cohort | Dyslipidemia cohort | |
|---|---|---|---|
| One prescriber | Reference | Reference | Reference |
| Two prescribers | 0.98 (0.96–1.01) | 1.10 (1.08–1.12) | 1.03 (1.01–1.05) |
| Three prescribers | 0.98 (0.94–1.02) | 1.20 (1.17–1.23) | 1.02 (1.00–1.05) |
| Four prescribers | 1.00 (0.94–1.07) | 1.37 (1.33–1.43) | 1.09 (1.05–1.13) |
| Five or more prescribers | 0.94 (0.86–1.02) | 1.44 (1.37–1.51) | 1.08 (1.03–1.14) |
| Age (65–69) | Reference | Reference | Reference |
| Age (70–74) | 1.07 (1.03–1.10) | 1.08 (1.06–1.10) | 1.02 (1.00–1.04) |
| Age (75+) | 1.11 (1.08–1.15) | 1.18 (1.16–1.21) | 1.06 (1.03–1.08) |
| White | Reference | Reference | Reference |
| African American | 0.76 (0.73–0.79) | 1.03 (1.01–1.06) | 0.72 (0.70–0.74) |
| Other race | 0.88 (0.84–0.93) | 0.94 (0.91–0.98) | 0.79 (0.76–0.82) |
| Male | Reference | Reference | Reference |
| Female | 0.94 (0.92–0.97) | 1.05 (1.03–1.07) | 0.86 (0.84–0.88) |
| Medicaid enrolled | 1.50 (1.45–1.56) | 1.33 (1.30–1.36) | 1.57 (1.52–1.61) |
| Diabetes | – | 1.06 (1.05–1.08) | 1.03 (1.01–1.05) |
| Hypertension | 1.04 (1.00–1.08) | – | 1.11 (1.09–1.14) |
| Dyslipidemia | 1.05 (1.02–1.08) | 1.05 (1.03–1.07) | – |
| Congestive heart failure | 0.90 (0.86–0.93) | 1.00 (0.98–1.02) | 0.94 (0.92–0.96) |
| Atrial fibrillation | 1.00 (0.95–1.04) | 1.16 (1.13–1.19) | 1.09 (1.06–1.12) |
| Dementia/Alzheimer’s/related | 0.88 (0.83–0.92) | 0.77 (0.75–0.80) | 0.93 (0.89–0.96) |
| Anemia | 0.96 (0.93–0.99) | 0.90 (0.88–0.91) | 0.96 (0.95–0.98) |
| Asthma | 0.88 (0.83–0.93) | 0.93 (0.90–0.96) | 0.88 (0.85–0.92) |
| Cancer | 0.93 (0.90–0.97) | 0.93 (0.91–0.96) | 0.96 (0.93–0.98) |
| Chronic kidney disease | 0.84 (0.82–0.87) | 1.01 (0.99–1.03) | 1.06 (1.03–1.08) |
| COPD | 0.83 (0.80–0.87) | 0.90 (0.88–0.92) | 0.90 (0.88–0.93) |
| Depression | 0.79 (0.76–0.83) | 0.81 (0.79–0.83) | 0.87 (0.85–0.90) |
| Benign prostatic hyperplasia | 0.96 (0.91–1.01) | 0.91 (0.88–0.94) | 0.98 (0.95–1.01) |
| Acquired hypothyroidism | 0.88 (0.84–0.92) | 0.88 (0.86–0.91) | 0.94 (0.92–0.97) |
| Ischemic heart disease | 0.90 (0.87–0.92) | 0.91 (0.90–0.93) | 1.01 (1.00–1.03) |
| Osteoporosis | 0.94 (0.89–1.00) | 0.93 (0.91–0.96) | 1.00 (0.97–1.03) |
| Rheumatoid arthritis/osteoarthritis | 0.90 (0.87–0.92) | 0.90 (0.89–0.92) | 0.88 (0.86–0.90) |
| Stroke | 0.87 (0.82–0.93) | 0.90 (0.87–0.93) | 0.98 (0.94–1.02) |
| Number of medications (all) | 1.01 (1.01–1.02) | 1.02 (1.02–1.03) | 1.01 (1.01–1.01) |
| Insulin 2011 | 0.67 (0.62–0.72) | – | – |
| c-statistic Sample size |
0.57 100,191 |
0.58 299,949 |
0.57 243,598 |
COPD: chronic obstructive pulmonary disease.
Medication availability = 1 if continuous Proportion of Days Covered (PDC) >80% and =0 otherwise; fixed effects for the 10 states were also included with Florida as the reference state.
Acknowledgements
This work was presented at the 2015 meetings of AcademyHealth, AHRQ Research Conference and the International Health Economics Association.
Declaration of conflicting interests
The author(s) declared the following potential conflicts of interest with respect to the research, authorship, and/or publication of this article: M.L.M. reported receiving institutional grants from the Department of Veterans of Affairs, the Agency for Healthcare Research and Quality and an institutional contract from the Centers for Medicare and Medicaid Services and ownership of Amgen stock due to his spouse’s employment. C.I.V. reported receiving institutional grants from the Department of Veterans of Affairs. L.H.C. reported receiving institutional grants from GlaxoSmithKline, Boston Scientific and Gilead. V.W. reported receiving institutional grants from the Department of Veterans of Affairs and the National Institute of Diabetes and Digestive Disorders. All other authors have no conflicts of interest to disclose.
Funding
The author(s) disclosed receipt of the following financial support for the research, authorship, and/or publication of this article: This project was supported by support from the Agency for Healthcare Research and Quality (AHRQ, R01HS023085) and the Centers for Medicare and Medicaid Services. M.L.M. is also supported by a Research Career Scientist award from the Department of Veterans Affairs (RCS 10–391). This work was also supported by the Office of Research and Development, Health Services Research and Development Service, Department of Veterans Affairs.