
Abstract
Background:
The detection of the Adamkiewicz artery and the anterior spinal artery has been associated with the ability to prevent adverse spinal cord outcomes after aortic surgical procedures. Yet, to our knowledge, no previous studies have attempted to use modern predictive models to identify the most important variables in determining artery detectability.
Aims:
To develop a model to predict the odds of visualizing the Adamkiewicz artery or anterior spinal artery in patients undergoing computerized tomographic angiography.
Methods:
We conducted a prospective, cross-sectional study. Outcomes of interest were the non-detection of the Adamkiewicz artery and anterior spinal artery, and their corresponding level of origin. Axial images were inspected in high definition in search of two dense spots characterizing the Adamkiewicz artery and anterior spinal artery. A multiplanar three-dimensional reconstruction was then performed using the OsiriX® software.
Results:
A total of 110 participants were part of this analysis. When evaluating risks for the Adamkiewicz artery being undetectable, significant factors could be classified into three broad categories: risk factors for arterial disease, established arterial disease, and obesity. Factors in the former category included metabolic syndrome, hypertension, and smoking status, while factors in the arterial disease included descending aortic aneurysm, mural thrombi, aortic aneurysm without a dissection, and aortic disease in general. In relation to anterior spinal artery not being detectable, significant risk factors included hypertension, smoking status, and metabolic syndrome, while those associated with arterial disease involved aortic disease and arterial thrombi. When evaluating the importance of individual clinical factors, the presence of higher body mass index was the single most important risk factor.
Conclusion:
Arterial disease, established arterial disease, and increased body mass index are risk factors in the detection of Adamkiewicz artery and anterior spinal artery. Specific diagnostic protocols should be in place for patients with these underlying conditions, thus enhancing the likelihood of detection when the Adamkiewicz artery is indeed present.
Introduction
Iatrogenic lesions to the Adamkiewicz artery (AKA) during aortic surgical procedures have been reported to lead to spinal cord lesions in up to 12% of all cases.1,2 Yet, despite reports regarding its anatomy2–4 and prevalence among different populations, to our knowledge, no previous studies have used modern predictive models allowing clinicians to determine the likelihood of an artery not being identified.
The AKA and anterior spinal artery (ASA) are routinely scanned prior to intra-thoracic aortic surgical procedures. These arteries are often missed during pre-procedure exams despite a detection rate of up to 100% in some populations.5,6 For example, in a study evaluating 555 participants from different populations, a detection rate around 80% was reported, with a thoracic level being the most common. 7 Levels of origin are disputed, however, with other reports describing lower lumbar levels also being frequent. 4 When it comes to the ASA, however, this artery has been identified in a number of populations, its trajectory being well described as continuous along the spinal cord. 6 Success in tracing the entire continuity of this artery through imaging techniques varies, however, with success rates around only 30% in most cases. 8 The ASA diameter has also been described to vary considerably among the general population; 9 this factor likely influences the corresponding detection rate.
A host of factors have been associated with the ability to detect the AKA and ASA during computerized tomographic angiographic (CTA) exams. For example, the use of intravenous contrast has been associated with decreased detection rates when compared to intra-arterial techniques. 10 However, even when an intra-arterial route is chosen, the dose and speed of the injection have also been shown to affect detection rates, with low doses and injection speed being associated with lower detection rates.5,11 In addition, patients’ anterior–posterior diameter is an important factor with obese patients absorbing more radiation and therefore introducing more noise to the image. 12 Related to this factor, a high tube voltage has been shown to weaken attenuation by an intra-vascular contrast material, leading to poor contrast, and therefore reducing vascular detection. 13 Despite a knowledge of individual risk factors, their inclusion in predictive models providing a more accurate prediction has not been pursued by previous authors.
The objective of this study was therefore to develop a model to predict the odds of visualizing the AKA or ASA in patients undergoing CTA.
Methods
Study design
We conducted a prospective, cross-sectional study to predict risk factors in the non-detection of the AKA and the ASA in patients undergoing CTA. This study is described in accordance with the STROBE (STrengthening the Reporting of OBservational studies in Epidemiology) guidelines. 14
Ethics
Our study was approved by the Institutional Review Board of the School of Medicine at the University of São Paulo, Brazil. Informed consent was offered to all potential participants and subsequently signed prior to any study protocol being implemented. The trial was registered under no. RBR-326MSC at Registro Brasileiro de Ensaios Clínicos (ReBEC, http://www.ensaiosclinicos.gov.br/, last accessed September 2016).
Setting
Data were collected at the Radiology Department of the Heart Institute (InCor) at the University of São Paulo, Brazil. Participant accrual occurred between October 2011 and July 2012.
Participants
We included all consecutive patients undergoing a CTA as a pre-operative evaluation for a thoracic aortic surgical intervention and understand the difference of identification between diseased and non-diseased aortas. We excluded patients younger than 25 years of age to maintain group homogeneity in relation to their underlying conditions. No patients with prior aortic surgery were included. All imaging studies were performed on a 320-row detector CT scanner with 120 kV and 450 mA adaption and automated radiation-reduction software. The latter included Adaptive Iterative Dose Reduction, Target CTA, and SUREExposure™. The trigger threshold level was set at 150 Hounsfield Unit.
Our sample size calculation established that a minimum of 37 individuals would be required in each group (for a total sample of 74 individuals) in order to detect a 30% difference between the following proportions: group A = 94% and group B = 64%. Assumptions included a test that would detect differences in both directions, with a significance level of 5% and a statistical power of 90%.
Outcomes
Outcomes of interest were the non-detection of the AKA and ASA, and their corresponding level of origin. AKA is the major arterial supply and anastomosis with the ASA feeding the lower thoracic, lumbar, and sacral spinal cord. It has a variable origin and most commonly arises from a left posterior intercostal artery at the level of the 9th to 12th intercostal artery, originating from the aorta. The ASA is an artery coursing along the anterior sulcus of the spinal cord, supplying the 2/3 anterior aspect of the spinal cord. It is supplied not only by the vertebral arteries but also by the deep cervical artery for the cervical spinal cord, the artery of Von Haller at the thoracic level and the AKA at the lower thoracic/lumbar level.15–17 Outcome variables were obtained from the interpretation of the CTA images. All patients received a non-ionic contrast with volumes varying from 26 to 160 mL, the volume being proportional to each patient’s body weight. The contrast was administered intravenously at a 5 mL/s. Each image was independently reviewed by two observers, the first author (A.C.M.A.) and the second author (J.R.P.F.). In cases of disagreement, a second image was identified until agreement was reached. An AKA or ASA was deemed detectable when its path could be identified as (a) originating from the aorta and (b) having a linear image resembling a hairpin. Specifically, axial images were inspected in high definition in search of two dense spots characterizing the ASA, as well as the AKA. A multiplanar three-dimensional (3D) reconstruction was then performed using the OsiriX software, which consists of the simultaneous visualization of three oblique planes mutually convergent at 90° on three windows. Manual rotation then allowed for the evaluation of the entire cord. A video illustrating this technique is available at http://vascular.pro/aka.html. The point where the axes cross (“mark”) was placed on the spinal cord at the level of the last thoracic vertebra, and a sagittal image appeared in the upper left window. We obtained an almost coronal or para-coronal oblique view in the largest window by performing the following maneuvers: adjusting the axis position and tilting on the longitudinal direction to encompass most of the spinal cord in the upper left window, changing the section thickness using a maximum intensity projection (MIP) algorithm, and “windowing.” In addition, tilting the axes angle and scrolling the images along the anterior–posterior direction enabled rapid scanning of the full spinal cord (Figure 1).

Examples of AKA and ASA images.
Predictors
Our main predictors were body mass index; risk factors of arterial diseases including smoking status, diabetes mellitus, hypertension, and dyslipidemia; and metabolic syndrome and arterial diseases including descending aortic aneurysm, aortic dissection, mural thrombosis, aortic aneurysm with no dissection, thrombosis with neither aneurysm nor dissection, and other aortic diseases. Predictors were collected during an interview prior to the CTA exam.
Potential confounders
Potential confounders were selected on the basis of evidence from previous literature combined with clinical judgment. 18 Specifically, we selected age, gender, and race.
Statistical methods
Our exploratory analysis started by evaluating distributions, frequencies, and percentages for each of the numeric and categorical variables. Categorical variables were evaluated for near-zero variation. 19 Extensive graphical displays were used for both univariate analysis and bivariate associations, accompanied by broader tests such as Maximal Information Coefficient 20 and Nonnegative Matrix Factorization 21 algorithms for numeric variables. Missing data were explored using a combination of graphical displays involving univariate, bivariate, and multivariate methods. Imputation was performed using a k-nearest neighbors algorithm (n = 5). 22
Our modeling strategy consisted of a series of generalized linear models with a binomial distribution family to evaluate the association between undetectable AKA and ASA as outcomes and risk factors for arterial conditions, as well as arterial conditions themselves. These models were adjusted for age, race, gender, and image quality. In order to reach the most parsimonious model, we used backward deletion based on a series of likelihood-ratio tests comparing nested models.
We also performed an analysis using a series of regression tree models for hierarchical clustering 23 to identify the most common associations and hierarchical patterns among risk factors. Tree regression pruning was based on the following algorithm: at each pair of nodes from a common parent, we assessed the error based on the testing data, specifically evaluating whether its sum of squares would decrease if the two nodes were removed. In case of a positive answer, nodes were removed, otherwise they were left intact. In order to avoid overfitting, we used a cost-complexity pruning strategy using the weakest link-pruning strategy by successively collapsing the internal node that produces the smallest per-node increase in the cost-complexity criterion. 24 Although tree regression models represent the best cut-points for values predicting outcomes, in contrast with linear regression models, their results cannot be represented in a single equation. However, they have a graphical representation which we present along with our result interpretation. All analyses were performed using the R language 25 and the following packages: ggplot2 26 and rmarkdown. 27
Results
A total of 110 participants were included in this analysis. Patients were on average 61 years, mostly male (54.5%), with an average body mass index of 27. Most (66%) presented hypertension, nearly half (45%) were smokers, and approximately half of them had signs of arterial disease (Table 1).
Baseline characteristics of patient sample.

AKA: Adamkiewicz artery; ASA: anterior spinal artery; BMI: body mass index.
When evaluating non-adjusted risks for the AKA not being detectable, significant factors could be classified into two broad categories: risk factors for arterial disease and established arterial disease. Factors in the former category included metabolic syndrome, hypertension, and smoking status, while factors in the latter category included descending aortic aneurysm, mural thrombi, aortic aneurysm without a dissection, and aortic disease in general (Table 2).
Unadjusted risks of the AKA not being detectable.

AKA: Adamkiewicz artery; OR: odds ratio; CI: confidence interval.
When evaluating unadjusted risk factors for the ASA not being detectable, they were again clustered around risk factors for arterial disease, as well as established arterial disease. Significant factors among the former category included hypertension, smoking status, and metabolic syndrome, while those associated with established arterial disease involved aortic disease and arterial thrombi (Table 3).
Unadjusted risks of the ASA not being detectable.

ASA: anterior spinal artery; OR: odds ratio; CI: confidence interval.
We then attempted to validate our results by running a tree regression model with pruning, identifying the main factors leading to the AKA and ASA not being detectable. In both models, the most important risk factor was the presence of aortic disease, followed by body mass index greater than 26. 26% of our patients, with both aortic disease and a high body mass index (>26), were more likely associated with the non-detection of ASA and AKA (Figures 2 and 3). Our models were tested for overfit and saturation by varying the pruning rates, as well as using pre-pruning based on significance tests in order to lead to an unbiased tree selection. After varying pruning parameters by 10%, our tree structure remained stable with a maximum variation of 2.6% in our estimates.
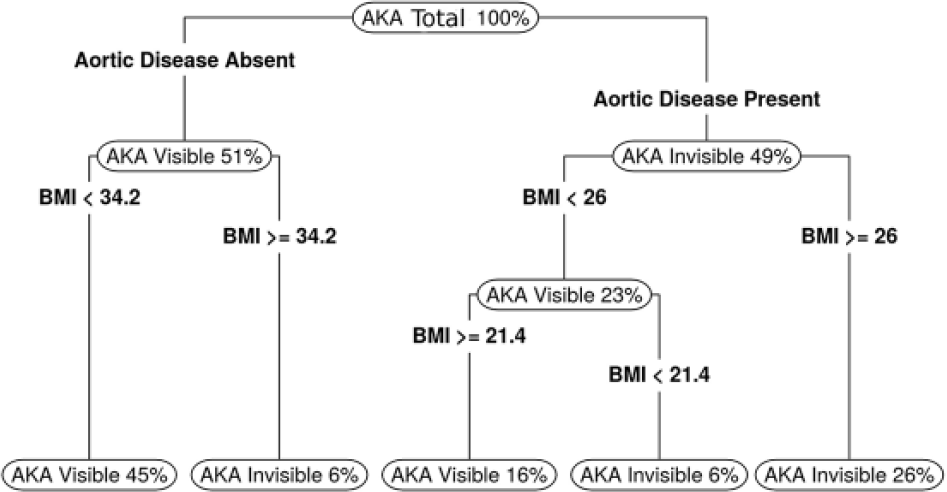
Tree regression results for AKA not being detectable.

Tree regression results for ASA not being detectable.
Discussion
To our knowledge, this is the first predictive, tree regression model designed to allow clinicians to determine the likelihood of an artery not being identified on the CTA. When evaluating risks for the AKA not being detectable, significant factors could be classified into two broad categories: risk factors for arterial disease and established arterial disease. Factors in the former category included metabolic syndrome, hypertension, and smoking status, while factors in the latter category included descending aortic aneurysm, mural thrombi, aortic aneurysm without a dissection, and aortic disease in general. In relation to ASA not being detectable, factors were again clustered around risk factors for arterial disease, as well as established arterial disease. Significant factors among the former category included hypertension, smoking status, and metabolic syndrome, while those associated with established arterial disease involved aortic disease and arterial thrombi. Finally, when evaluating the importance of individual clinical factors, the presence of arterial disease and higher body mass index were consistent predictors of the non-detection of both AKA and ASA, body mass index likely being associated with a reduction in x-ray penetration.
Conventional spinal digital subtraction angiography (DSA) is a gold standard for visualization of the AKA.28,29 Despite DSA being very sensitive in spatial detection of the AKA, CTA has a precision similar to the one achieved through magnetic resonance angiography, making CTA a clinically acceptable standard.12,28,30,31 In face of these results, CTA is considered adequate for the pre-operative evaluation of the Adamkiewicz and anterior spinal arteries. The detection of small vessels on computerized tomography scans depend on the ability to maintain a good contrast material in the lumen of these vessels, ultimately differentiating them from their surroundings.10,11 In our study, the relationship between arterial disease risk factors and arterial detectability could be explained by the association of these risk factors with atherosclerotic lesions.32,33 Such lesions may reduce the amount of contrast reaching smaller vessels, leading to a lower amount of contrast in the target vessels, and ultimately reducing vascular detection. This finding suggests the need to use an increased amount of contrast in patients with atherosclerosis, although future studies should test the safety of this measure prior to its application.
In alignment with our findings, patient size has been demonstrated to affect radiologic image quality and, therefore the ability to detect anatomical structures. Since computerized tomographic visibility depends on the amount of photons passing through the patient and then captured by the detectors, body mass index can affect detectability. While detection rates are improved among small and slim patients, large patients tend to absorb more photons and therefore generate more image noise. 12 Efforts to improve image quality in large patients are not without problems, however. For example, the use of high x-ray beam energy levels to adequately penetrate the body is frequently accompanied by a decrease in differential attenuation. As a consequence, the contrast between soft tissues and materials with high atomic numbers is reduced, including elements such as iodine and bone tissue. In addition, increased tube current decreases noise and improves contrast-to-noise ratio, although this approach is unfortunately limited in that it can also increase radiation exposure.34–37
Despite filling an important gap in the literature, our study does have limitations. First, we did not perform a longitudinal follow-up of our patients in order to verify whether the lack of visibility did indeed have clinical implications. Finally, given that our sample was not randomly drawn from a larger patient population, its external validity can be questioned. Although future studies should certainly aim at larger and more representative samples, our sample is by no means atypical for its setting, making our conclusions valid for similar populations around the globe.
Conclusion
Arterial disease and increased body mass index decrease x-ray penetration and the visibility of both the AKA and ASA. Given that the AKA is associated with an increased rate of adverse spinal cord outcomes, future guidelines should account for these populations and perhaps establish protocols where contrast or radiation levels are increased for specific patient subgroups. The safety of these protocols should be carefully evaluated.
Footnotes
Acknowledgements
A.C.M.A. contributed to conception and design; analysis and interpretation of data; drafting and reviewing of the manuscript; and final approval of the manuscript. J.R.P.F. contributed to conception and design; analysis and interpretation of data; reviewing of the manuscript; and final approval of the manuscript. N.A.G.S. contributed to conception and design; analysis and interpretation of data; reviewing of the manuscript; and final approval of the manuscript. The trial was registered at Registro Brasileiro de Ensaios Clínicos (ReBEC; RBR-326MSC).
Declaration of conflicting interests
The author(s) declared no potential conflicts of interest with respect to the research, authorship, and/or publication of this article.
Ethical approval
Ethical approval for this study was obtained from the Institutional Review Board of the School of Medicine at the University of São Paulo, Brazil (0089/10), and Sistema Nacional de Informações em Ética e Saúde (SINEP) da Comissão Nacional de Ética em Pesquisa (CONEP; 0088.0.015.000-10)*.
Funding
The author(s) received no financial support for the research, authorship, and/or publication of this article.
Informed consent
Written informed consent was obtained from all subjects before the study.
References
Supplementary Material
Please find the following supplemental material available below.
For Open Access articles published under a Creative Commons License, all supplemental material carries the same license as the article it is associated with.
For non-Open Access articles published, all supplemental material carries a non-exclusive license, and permission requests for re-use of supplemental material or any part of supplemental material shall be sent directly to the copyright owner as specified in the copyright notice associated with the article.