
Abstract
Procrastination is an increasingly prevalent phenomenon. Although research suggests smartphones might be involved, little is known about the momentary association between different patterns of smartphone use and procrastination. In a preregistered study, 221 students (Mage = 20, 55% female) self-reported procrastination five times a day for 30 days (i.e., experience sampling method) while their smartphone use was continuously monitored (i.e., passive logging). Using dynamic structural equation modeling on 27,151 observations, we estimated momentary within-person associations between procrastination and (a) total smartphone use and use of specific application categories (social media, messaging, browsers, games, and video streaming), (b) notifications, and (c) smartphone use fragmentation. Procrastination was positively albeit weakly associated with all aforementioned patterns, and associations varied from person to person. Collectively, our findings suggest these popular devices potentially encourage dilatory behavior.
Introduction
Procrastination refers to the irrational, voluntary delay to starting or completing an intended course of action (Steel, 2007). Examples of such dilatory behavior and its adverse consequences abound (Steel, 2007; Steel & Klingsieck, 2016). For example, people procrastinate when they delay doing their taxes, even though this will cause them to rush, and potentially make errors and overpay (Kasper, 2004). Procrastination occurs, for example, when people intend to make a doctor’s appointment but jeopardize their physical health by failing to do so (Steel, 2011). Procrastination also commonly rears its head when students delay studying, even though they will face greater workload and stress as a result (Steel, 2007; Tice & Baumeister, 1997).
The prevalence of chronic procrastination has soared in the past decades (Steel, 2007) and is projected to climb even further in the next (Steel, 2011). One potential explanation for this trend might be the meteoric rise in the availability of smartphones (Rozental & Carlbring, 2014; Steel, 2011). Smartphones are conducive to procrastination because people are more likely to procrastinate when temptations are proximal (Duckworth et al., 2016; Steel, 2011; Steel et al., 2018). Because people keep a smartphone close by, they can easily succumb to the temptation of pursuing the device’s plentiful social and informational rewards rather than the task they intended to perform (Oulasvirta et al., 2012).
Supporting this explanation, several studies have established a link between smartphone use and procrastination. To date, most studies have used a cross-sectional self-report survey design to demonstrate that individuals who excessively use their smartphones also tend to procrastinate more (e.g., Im & Jang, 2017; Rozgonjuk et al., 2018; Yang et al., 2019). While these studies are valuable in revealing between-person associations between smartphone use and procrastination, they have at least two limitations.
The first limitation is that self-report studies rely on the assumption that people are capable of assessing their smartphone behavior accurately. This assumption is unwarranted, however, as self-reported smartphone use correlates poorly with actual smartphone use (Davidson et al., 2020). This lack of accuracy means that self-reports are unsuitable for capturing different facets of smartphone use that may be particularly relevant to procrastination. For instance, as people fail to accurately self-report total smartphone usage, it is unlikely their self-reports will reliably distinguish between the use of different applications or will be able to capture more dynamic usage patterns, such as how quickly they switch back and forth between screen and “real life” activities (smartphone use fragmentation as an indicator of smartphone multitasking, cf. Hendrickson et al., 2019). The problematic validity of self-reported smartphone use is further underlined by Sewall et al. (2019) who demonstrate that discrepancies between self-reported and passively logged smartphone use can be predicted by psychological well-being.
A second problem with cross-sectional self-report survey designs is that they model smartphone use as a predictor of procrastination at the between-person level. While establishing the between-person differences of heavy and light smartphone users is relevant to understand who is more at risk of suffering the consequences, more fundamental questions about when and how procrastination manifests itself within individuals remain largely unanswered. To our knowledge, only a recent daily diary study by Schnauber-Stockmann et al. (2018) explored the situation-specific nature of procrastinatory media use, showing that it occurs more often when motivation for behavioral control is low. To date, however, we know little about the specific forms that procrastinatory smartphone use takes, and how person-specific these manifestations of procrastination are. Answers to these questions have great societal value as they can inform about how procrastination treatment can be optimally tailored to an individual’s idiosyncratic smartphone usage patterns and linkages with procrastination.
The overarching aim of our study was to determine how momentary procrastination is associated with three different smartphone usage patterns, namely (a) received notifications, (b) fragmentation, and (c) dynamic content application use. This was investigated by examining (a) which specific smartphone usage patterns actually co-occur with procrastination within the same person and (b) how this coupling differs between individuals. To this end, our study estimated person-specific statistical models of the link between momentary (self-reported) procrastination and these smartphone usage patterns measured objectively using a dedicated logging application. The present study is the first to assess how these measures are associated, answering recent calls for methodological improvements in smartphone research, both at the measurement (Davidson et al., 2020) and statistical level (Beyens et al., 2020).
Procrastination and smartphone use
What is procrastination?
People procrastinate when they delay beginning or completing an intended course of action. Such behavior is quintessentially irritational, as it represents voluntary activities that do not maximize material (e.g., monetary) or psychological (e.g., emotional well-being) utility (Steel, 2007). Commonly, procrastination means that individuals succumb to temptations in their environment, such as the gratification of social and entertainment needs, electing their short-term rewards over the long-term benefits of tasks that are less enjoyable but require completion (Duckworth et al., 2016). For instance, a student intends to study but spends most of the week before an exam chatting to friends on messenger applications and scrolling through social media. The student then has to plow through all their study materials in the night before the exam. The day after, they are tired and stressed. Some weeks later, their grade turns out to be insufficient, requiring a resit or worse, failing their year’s requirements.
Procrastination can take on many forms, differing in aspects such as why (i.e., triggers) and how (i.e., behavioral manifestation) it occurs. With respect to the why, research suggests procrastination might be triggered by internal feeling states (e.g., fatigue; Steel, 2007), task characteristics (Steel, 2007), and temptations in our environment (e.g., smartphones; Duckworth et al., 2016). These triggers evoke different behavioral manifestations of procrastination, such as using social media (Meier et al., 2016) and binge watching television series (Merrill & Rubenking, 2019). These behavioral manifestations arguably have two modes: (a) brief bursts of task-irrelevant behaviors that intersperse intended tasks (e.g., multitasking between media and tasks; Meier et al., 2016), or (b) behaviors that displace to-be-completed tasks for an extended period (e.g., binge watching; Merrill & Rubenking, 2019).
How might smartphone use relate to procrastination?
There are different aspects of smartphone use that could potentially relate to procrastination. First, notifications might trigger smartphone use. Second, smartphone use may be a behavioral manifestation of procrastination, either reflected in a fragmented mode of usage, or in the displacement of tasks by prolonged consumption of (dynamic) smartphone content. In what follows, we discuss empirical research suggesting potential links between these aspects of smartphone use and procrastination.
Smartphones trigger procrastination
A smartphone can draw its user to look at the screen by notifying them of events, such as a received message, through popups, sounds, and vibrations. Such notifications can be useful, as they may alert smartphone users to important information. However, researchers have proposed notifications might be harmful in that they distract individuals from tasks (for a brief overview, see Johannes, Dora, et al., 2019). Given that distraction might delay task completion, it is conceivable that notifications might promote procrastination. Evidence on the distracting potential of notifications is mixed, however. It should be noted that whereas ample studies indicate notifications have an attentional cost (e.g., Stothart et al., 2015), recent experimental work suggests auditory and visual notifications are fairly benign (e.g., Johannes, Dora et al., 2019; Johannes, Veling, et al., 2019). However, this may have been because the stimuli under investigation did not contain personally relevant information such as sender name, while experimental work suggests that more personally relevant stimuli more strongly interfere with attention (Wingenfeld et al., 2006). As argued by Bayer et al. (2016), in real life, smartphone notifications are very personally relevant stimuli: they are “connection cues” that trigger the habit of digitally interacting with others. Critically, such social habits may conflict with ongoing tasks, possibly setting up users to procrastinate frequently. As such, an in situ examination may reveal the potential of notifications to trigger procrastination.
Smartphone use fragmentation as a manifestation of procrastination
When smartphone use is triggered repeatedly (e.g., by notifications) and users try to multitask between a “real life” task and smartphone use, this fragments an individual’s task-related activity, which can delay task completion. For instance, students commonly cannot resist using their smartphone every few minutes while studying (Rosen et al., 2013), potentially due to the widespread habit of smartphone checking (Bayer et al., 2016; Oulasvirta et al., 2012). Meier et al. (2016) speculate such media-induced task switching could increase how frequently individuals report media-based procrastination. As a corollary, we might expect individuals to report a greater level of procrastination when they more intensively alternate between smartphone and other activities. That is, when their use of one application tends to be followed by the use of another application more quickly (smartphone use fragmentation; Hendrickson et al., 2019).
Smartphone content consumption as a manifestation of procrastination
When people are triggered to use their smartphone, whether it be in a fragmentary mode or for a longer period, they consume dynamic content that resembles or is identical to content available on other media technologies. For instance, individuals can use social media on smartphones as well as personal computers. As research into “traditional” technologies suggests procrastination can manifest as media behavior, we might similarly expect dynamic smartphone content to lure individuals into dillydallying.
In recent years, several media behaviors have been associated with procrastination. First, studies have consistently found self-reported social media use to be positively associated with self-reported procrastination (Meier et al., 2016; Rozgonjuk et al., 2018). For instance, participants in a survey study commonly confirmed they use Facebook to procrastinate (Meier et al., 2016). Possibly, this is because people often browse through social media content without interacting with other users (Aalbers et al., 2019), a behavior similar to procrastinating on the Internet (Lavoie & Pychyl, 2001). Second, research shows that people with a greater tendency to procrastinate (i.e., unconscientious individuals) also tend to spend more time on WhatsApp (Montag et al., 2015). As social needs are an important motive for procrastination (Steel & Klingsieck, 2016) and messengers (e.g., WhatsApp, Facebook Messenger) are among the most frequently used applications (Hendrickson et al., 2019), messengers might be a common outlet for people to not do what they had intended. Third, procrastination is likely to manifest as video streaming and gaming application use, as watching television and gaming are considered common procrastination modes (Pychyl et al., 2000; Steel, 2011). Use of video streaming applications (e.g., Netflix, Hulu, Disney+) might contribute to procrastination, in particular. Binge watching series on these platforms is highly common (Flayelle et al., 2020), frequently motivated by a desire to procrastinate (Merrill & Rubenking, 2019), and often results in the postponement of other activities (De Feijter et al., 2016). Finally, ample research has linked Internet browsing to procrastination, a phenomenon known as “cyberslacking” (e.g., Lavoie & Pychyl, 2001).
Aims and hypotheses
While the overall aim of this study is to examine the link between procrastination and different smartphone use patterns, an aggregate level association will not convey much information on how person-specific the association between procrastination and smartphone use is. For instance, recent work indicates the relationship between social media use and psychological well-being might differ between individuals—that is, some individuals might potentially benefit from these platforms whereas others might experience adverse effects (Beyens et al., 2020). Knowing for how many people this association exists is an important aim of our study. A powerful approach to answering this question is to estimate the associations between momentary procrastination and smartphone usage patterns for each individual and explore the patterning of these associations. Such person-specific associations are important to report, as theoretical and empirical work suggests human subjects research to be fraught with limited group-to-individual generalizability (Fisher et al., 2018; Molenaar, 2004). Hence, associations within persons (e.g., whether the same person procrastinates more after having used the smartphone) should be separately examined from associations between persons (e.g., whether persons who score higher on smartphone use compared with others also procrastinate more than others).
Our first set of hypotheses were tested at the within-person level, to assess how a person’s own fluctuations in smartphone use are linked to fluctuations in procrastination. We expected that individuals would report a greater level of procrastination (a) after they had received more notifications (H1), (b) after their smartphone use had been more fragmented (H2), (c) after they had spent more time on smartphone applications in total (H3), and (d) spent more time on social media applications (H4a), messengers (H4b), video streaming applications (H4c), games (H4d), and browsers (H4e). Above and beyond these average within-person effects (“fixed effects”), we expected these associations to differ across individuals (H5; “random slopes”). Finally, at the between-person level, we expected that individuals with a greater level of procrastination on average would (a) receive more notifications and spend more time on smartphone applications in total (H6a), (b) use their smartphone in a more fragmented manner (H6b), and (c) spend more time on smartphone applications in total (H6c) and on all application categories (H6d–H6i; “between-person effects”).
Methods
Preregistration
This article presents results from a larger study with multiple research aims. We separately preregistered the full study (https://osf.io/6fs92/, see Online Supplementary Materials 1), and the hypotheses and data analysis for this specific paper (https://osf.io/r4jtc/, see Online Supplementary Materials 2). We declare that, at the time of writing (1 July, 2020), we only observed and analyzed variables relevant to the present study.
Participants
We recruited participants via the Tilburg University participant pool management system. A priori power analysis using Monte Carlo simulation showed that a sample of N = 200 with a compliance rate of 80% (i.e., 120 out of 150 assessments) would be sufficient to detect a very small momentary association (<0.10). We oversampled to enable the other aims of our research (i.e., machine learning).
We included 247 participants, who were required to own an Android smartphone. After removing 26 participants for whom no smartphone usage data were registered, our dataset comprised 27,151 complete observations in 221 participants with an average age of 20.87 (SD = 3.05), 122 (55%) of whom were female. On average, we analyzed t = 123 observations per person, which is sufficient for person-specific or n = 1 analyses (Voelkle et al., 2012).
Procedure
Participants followed online instructions to install an application for experience sampling (Ethica) and an application for smartphone usage logging (mobileDNA). The majority of participants attended a group information session in which a researcher explained the procedure and motivated participants to complete as many surveys as possible. A minority of students were instructed and motivated individually via a telephone call or a WhatsApp conversation. Participation credits were assigned proportionally to survey completion. Participants who completed all surveys 3 days in a row were entered into a €15 raffle.
For 30 days, Ethica notified participants five times a day at pseudo-random times between 8:30 a.m. and 10:30 p.m. to complete a brief survey on procrastination and other constructs. Participants had 50 min to complete each survey and were sent a reminder 45 min following the first notification. Participants could compensate for one expired survey per day by self-starting a survey to catch up on missed surveys. The median number of completed surveys per person was 141 (94%, M = 128.42, SD = 32.58, min = 0, max = 176).
Measures
General Procrastination Scale – Experience Sampling Method
The General Procrastination Scale – Experience Sampling Method (GPS-ESM) is based on the General Procrastination Scale-Screening, a scale that represents a pure measurement of procrastination (Klein et al., 2019). The GPS-ESM comprises three items on a 7-point Likert scale (1 “Not at all”, 4 “Moderately”, 7 “Very much”). The items were preceded by the statement “Please report to what extent the following statements applied to you since the last survey.” We presented items in the following fixed order: “I delayed before starting on work I have to do”, “I wasted time by doing other things than what I had intended to do”, and “I thought: ‘I’ll do it later’.”
We conducted a small-scale pilot study (Online Supplementary Materials 3; all materials, data, and code are openly available at OSF, https://osf.io/qvj8g/) to validate the GPS-ESM (N = 30, t = 25). Our validation work indicates the GPS-ESM has convergent and divergent validity, is not susceptible to a socially desirable response tendency, has adequate internal consistency, and is sufficiently sensitive to pick up on within-person variability.
Smartphone usage patterns
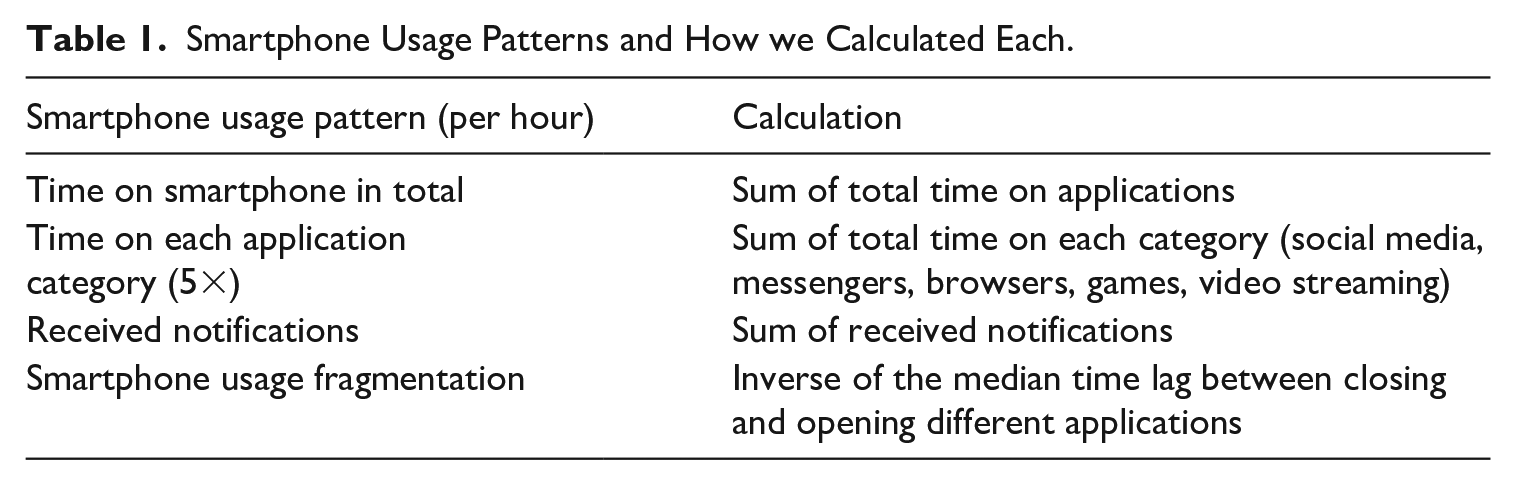
We used the smartphone logging app mobileDNA to continuously log smartphone application use and notifications from the moment participants activated the application. If participant X completed a survey at time Y and time Z, we extracted usage patterns that occurred between these timestamps (see Table 1). For instance, if a participant completed a survey at 10:00 a.m., missed one at 11:00 a.m., and completed a survey at 1:00 p.m., we took the sum of all application use durations to compute “time on smartphone in total.” We followed this procedure for time intervals within the same day and across days (e.g., last measurement of Day 1 and first measurement of Day 2). We converted all usage patterns to represent units per hour. As the night interval may be different not only in length but also in characteristics, in an additional sensitivity test, we tested whether correcting for the night interval (in which smartphone use is expected to be much lower) influenced results, and found differences in parameter estimates to be negligible. For comprehensibility, we computed fragmentation as the inverse of its preregistered metric, so larger values represented higher fragmentation.
Smartphone Usage Patterns and How we Calculated Each.
Strategy of analyses
To test H1 through H4, we estimated momentary associations between procrastination and smartphone usage patterns, using the dynamic structural equation modeling (DSEM) framework in Mplus v8 (Asparouhov et al., 2018; McNeish & Hamaker, 2019). Following McNeish and Hamaker (2019, p. 18–25,), we estimated two-level autoregressive models of procrastination with smartphone usage patterns as a time-varying covariate. We applied latent person-mean centering (for an explanation see McNeish & Hamaker, 2019). We further estimated between-subject associations between the random intercepts of procrastination and each smartphone usage pattern. See Figure 1 for a visualization of the full model. To prevent multicollinearity between predictors, we estimated a separate model for each smartphone usage pattern.
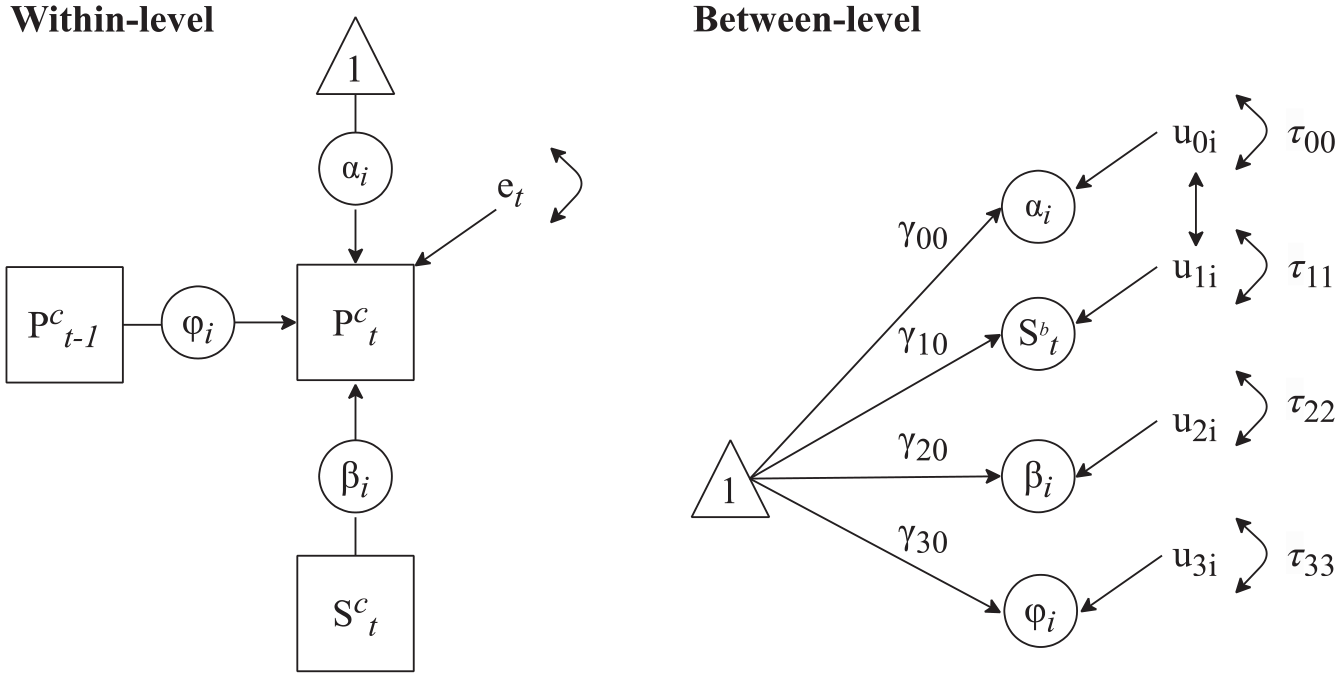
Visualization of the dynamic structural equation model estimated in this study. P stands for procrastination, S for smartphone usage pattern, t for time (i.e., the current time point), t−1 for time minus one (i.e., the previous time point), e for error. Parameters are represented by Greek lowercase letters: α i represents the intercept of procrastination in person i, βi the association between procrastination and smartphone use in person i, φi the autoregression of procrastination in person i, and τ for variance (e.g., variance in βi).
We estimated momentary associations using DSEM because it enabled us to take into account the autoregressive temporal structure of procrastination (i.e., when a person’s current procrastination level depends on their previous procrastination level) by including autoregressive parameters, while controlling for the non-equidistant measurements due to pseudo-random sampling (i.e., when one pair of measurements are 2 hrs apart and another pair 5 hrs; de Haan-Rietdijk et al., 2017), by using the TINTERVAL OPTION – here set to 3 hrs. By applying the TINTERVAL setting, we instructed Mplus to create a grid of time intervals and to assign each survey to the time point closest in time (see Online Supplementary Materials 4 for more information). We tested to what extent smartphone use between the current and previous surveys (e.g., between 11:45 a.m. and 2:00 p.m.) was associated with changes in procrastination reported in the current survey (e.g., procrastination between 11:45 a.m. and 2:00 p.m.), as we controlled for procrastination in the previous survey (e.g., procrastination between 9:00 a.m. and 11:45 a.m.).
DSEM decomposes the total variance of variables into within- and between-person variance (i.e., the nested structure of data is taken into account). Between-person variance represents the extent to which individuals differ in their stable mean of, for example, procrastination (i.e., the green horizontal lines in Figure 2), whereas within-person variance represents the extent to which procrastination fluctuates around this stable mean (i.e., total distance between each purple dot and the green line in Figure 2). Figure 2 shows that individuals with similar mean levels of procrastination (rows) can strongly differ in terms of the within-person variance of procrastination (columns). The more a variable fluctuates around the mean level of each participant, the greater the within-person variance. The more a variable’s mean level differs across individuals, the greater the between-person variance. The decomposition of the total variance into within- and between-person variance was done by latent person-mean centering the data for each person (see McNeish & Hamaker, 2019). This treatment of the data conceivably leads to more accurate estimates by removing stable, idiosyncratic response styles (i.e., tendency of a person to over- or underestimate procrastination).
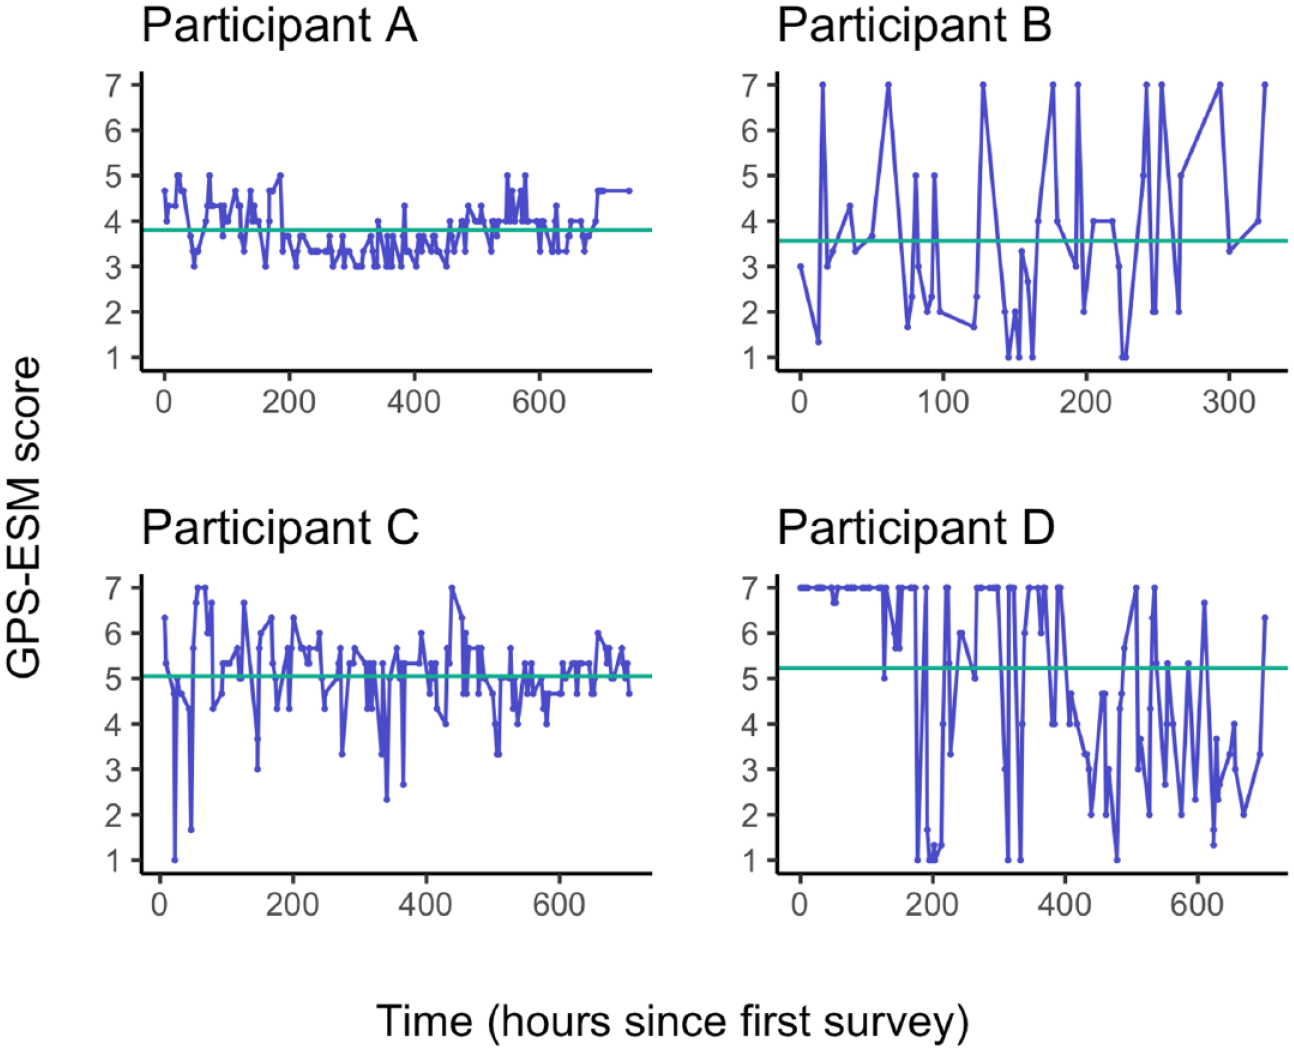
Within-person and between-person variance. Each panel depicts one participant’s level of procrastination plotted against its timestamp (actual data, not simulated). The green horizontal line represents a participant’s average level of procrastination. Participants A and B have similar average procrastination levels, which are lower than those of Participants C and D, whose average levels are also similar. Between-person variance is driven by such differences in the average procrastination levels. Within-person variance is low in Participants A and C (small fluctuations around average level), and high in Participants B and D (large fluctuations around average level).
Separating within- and between-person variance means that we estimate two “types” of associations, which are used to address different hypotheses. Within-person associations are the associations we estimate to test H1 through H4. For instance, a positive within-person association between procrastination and total smartphone use (H1) indicates that participants tended to report a greater-than-usual level of procrastination after spending more time than usual on their smartphone. To test H5, we estimated the variance between persons (or person-to-person differences) in each of the above within-person associations. That is, the extent to which people differ in how strongly procrastination and smartphone use tend to be synchronized. We used the metaviz package in R to visualize these differences as a forest plot (for a list of all software we used to create this manuscript, see Online Supplementary Materials 5). Finally, we estimated between-person associations to test H6a–H6i. They represent the extent to which a person with a high (low) mean level of procrastination also tends to have a high (low) mean level of each smartphone usage pattern compared with other individuals. For example, a positive between-person association between procrastination and total smartphone use indicates that individuals who, averaged across their participation, reported a higher level of procrastination than others, also tended to spend more time on their smartphone compared with others.
Results
Descriptives
Table 2 shows descriptive information. As all intraclass correlation values (final column) are below 0.5, this indicates that more than 50% of the variance in each variable represents fluctuations within a person. On average, students reported a relatively low level of procrastination. However, 40 out of 221 students (18.10%) reported an average procrastination level corresponding to the GPS-ESM scale value of “Moderate” or greater. Students used their smartphone for 12.44 min per hour, on average. Participants spent most time on social media applications (M = 3.58, SD = 2.47), followed by video streaming applications (M = 2.56, SD = 2.55), and messengers (M = 2.33, SD = 1.75). Assuming our participants were awake for approximately 14–16 hrs a day, this translates to a daily average of 2.90–3.32 hrs on the smartphone, and a daily average of 0.83–0.95 hrs spent on social media, 0.60–0.68 hrs spent using video streaming applications, and 0.54–0.62 hrs spent messaging. Table 3 presents the within-person and between-person zero-order correlations between all variables. At the within-person level, procrastination was positively correlated with all smartphone usage patterns. Total smartphone use most strongly correlated with social media and video streaming. Smartphone usage features were weakly associated with each other. Messenger use and notifications were most strongly correlated. At the between-person level, procrastination was positively correlated with some smartphone usage patterns and negatively with other patterns. Again, messengers and notifications were the most strongly associated smartphone usage patterns.
Descriptive Statistics.
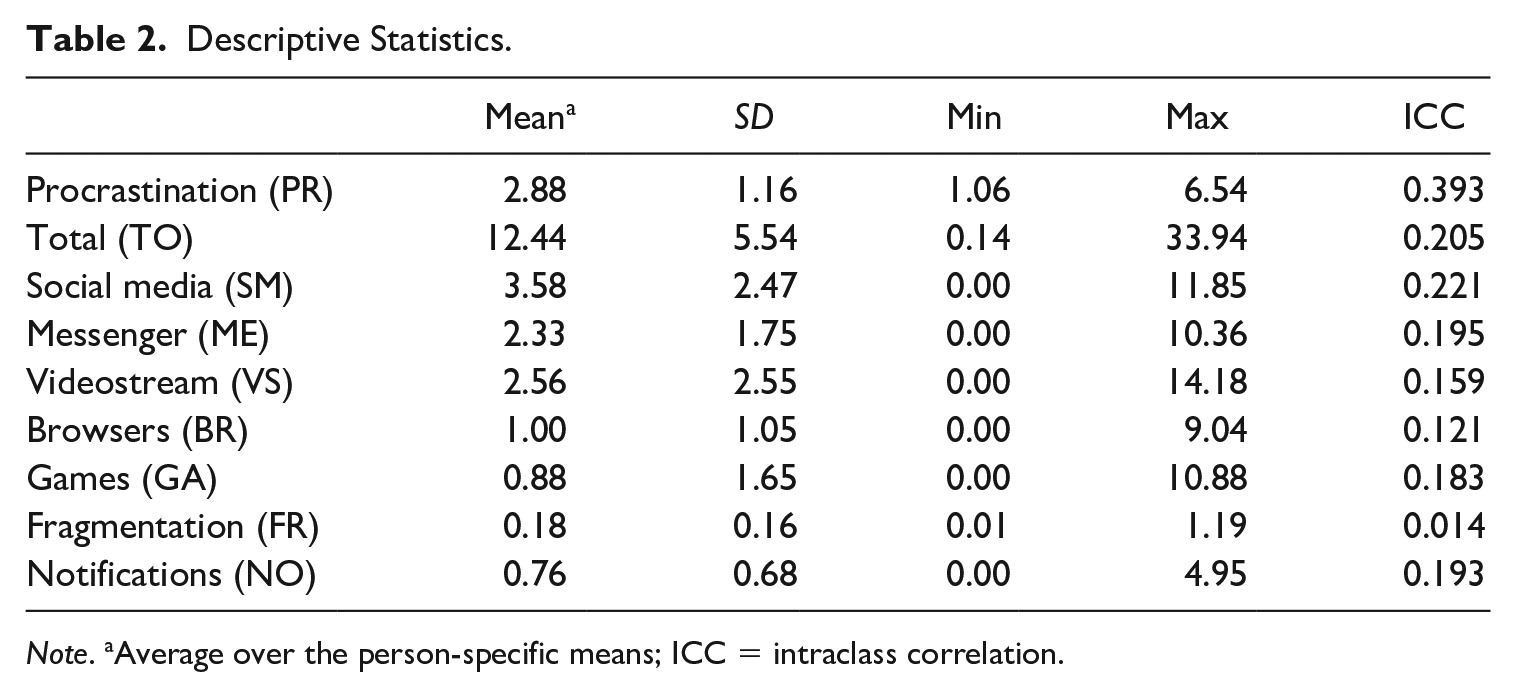
Note. aAverage over the person-specific means; ICC = intraclass correlation.
Within-Person (Below Diagonal) and Between-Person (Above Diagonal) Correlations.
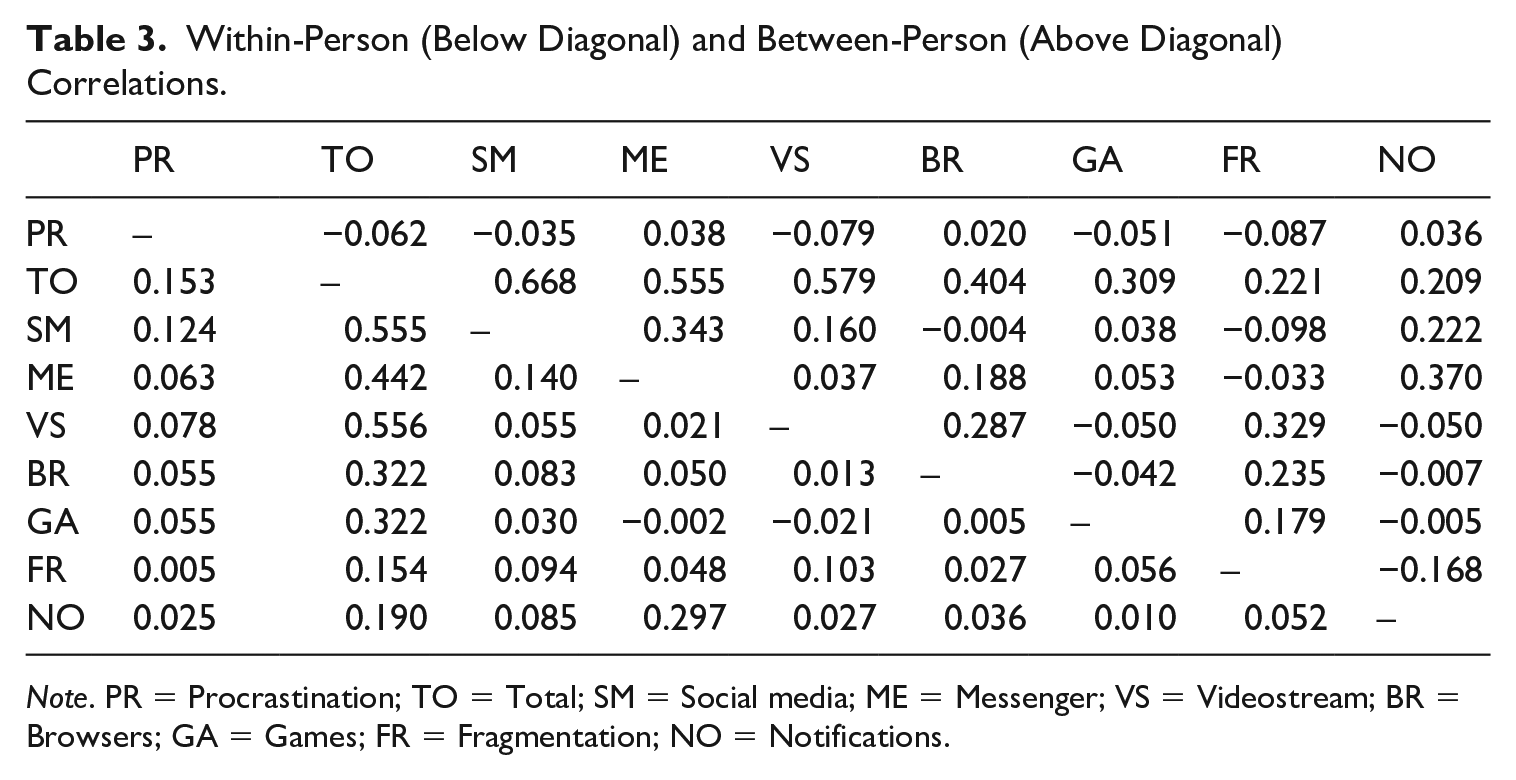
Note. PR = Procrastination; TO = Total; SM = Social media; ME = Messenger; VS = Videostream; BR = Browsers; GA = Games; FR = Fragmentation; NO = Notifications.
Within-person associations
The autoregressive effect of momentary procrastination was positive and significant in all DSEM models (Bayesian p-values < 0.05). Parameter estimates were highly similar across models and ranged between 0.37 (95% credible interval (CI) [0.36, 0.38]) and 0.38 (95% CI [0.37, 0.40]). This indicates that when participants reported procrastinating during the previous time window, they tended to also do so during the next. The converse held as well: when participants did not report procrastinating in the previous time window, they tended not to in the next.
While controlling for these autoregressive effects, we examined momentary associations between changes in procrastination and smartphone usage patterns. As shown in Figure 3 (upper panel), momentary procrastination was positively associated with all usage patterns for the average person (H1–H4). For instance, momentary procrastination was positively associated with total smartphone usage, standardized beta = 0.128, 95% CI [0.115, 0.142], p < 0.001. Thus, on average, when individuals spent more time on their smartphone, they were somewhat more likely to report a greater procrastination level in the next survey. All observed associations were statistically significant, ranging from 0.017 for fragmentation to 0.128 for total smartphone use. However, the 95% CI for the association with fragmentation ranged from 0.000 (but larger than 0) to 0.035, suggesting this association might be negligibly larger than zero at the group level. The abovementioned associations represent within-person statistics that have been aggregated across individuals.
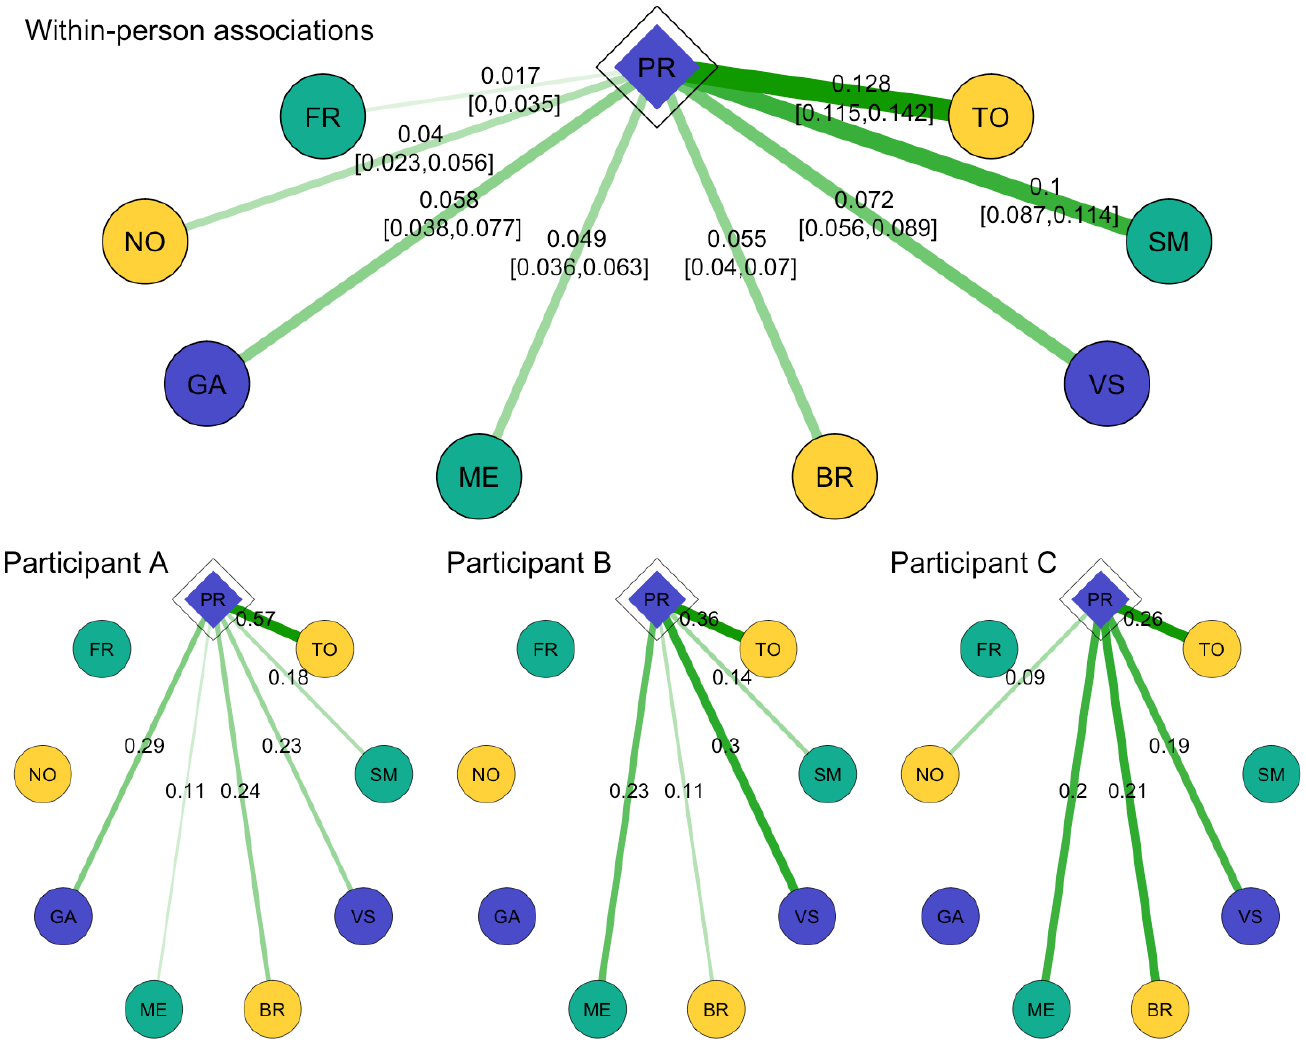
Radiance plots of within-person associations (upper panel) and person-specific associations for three individuals (bottom panels). The green lines represent associations between procrastination (diamond) and various patterns of smartphone use (circles; see Table 2 for a legend of the variable labels), with thicker lines representing stronger associations. Numerical values inside the lines denote point estimates and 95% credible intervals.
Person-to-person differences
Moreover, all aforementioned associations varied across participants (H5), indicating the link between procrastination and smartphone use was not equal for all. As illustrated with three cases in in Figure 3 (bottom panels), the patterning of effects was also different from person to person. For instance, whereas for Person A, gaming (GA) was the strongest correlate, for Person B, this was video streaming (VS), and for Person C this was browsers (BR).
Figure 4 visualizes the magnitude of person-to-person differences, by presenting all person-specific, momentary associations of procrastination with different smartphone patterns. The majority of person-specific associations were positive (93.78%), which is in line with the abovementioned group-level estimates (i.e., the black solid line). In terms of effect sizes, these ranged from β = –0.184 to β = 0.573. For 13.18% of all person-specific associations the CI did not contain zero, which highlights that this is significant at the n = 1 level of analysis. Even though some person-specific associations (6.22%) were negative, for only one of all negative person-specific associations (between procrastination and video streaming), the 95% CI excluded zero. Combined, these findings show (a) person-to-person differences exist (H5), (b) variance is mainly due to differences in the strength of the positive effect (Figure 4), and (c) individuals differ in the patterning of which aspects of smartphone use are related to procrastination (Figure 3).
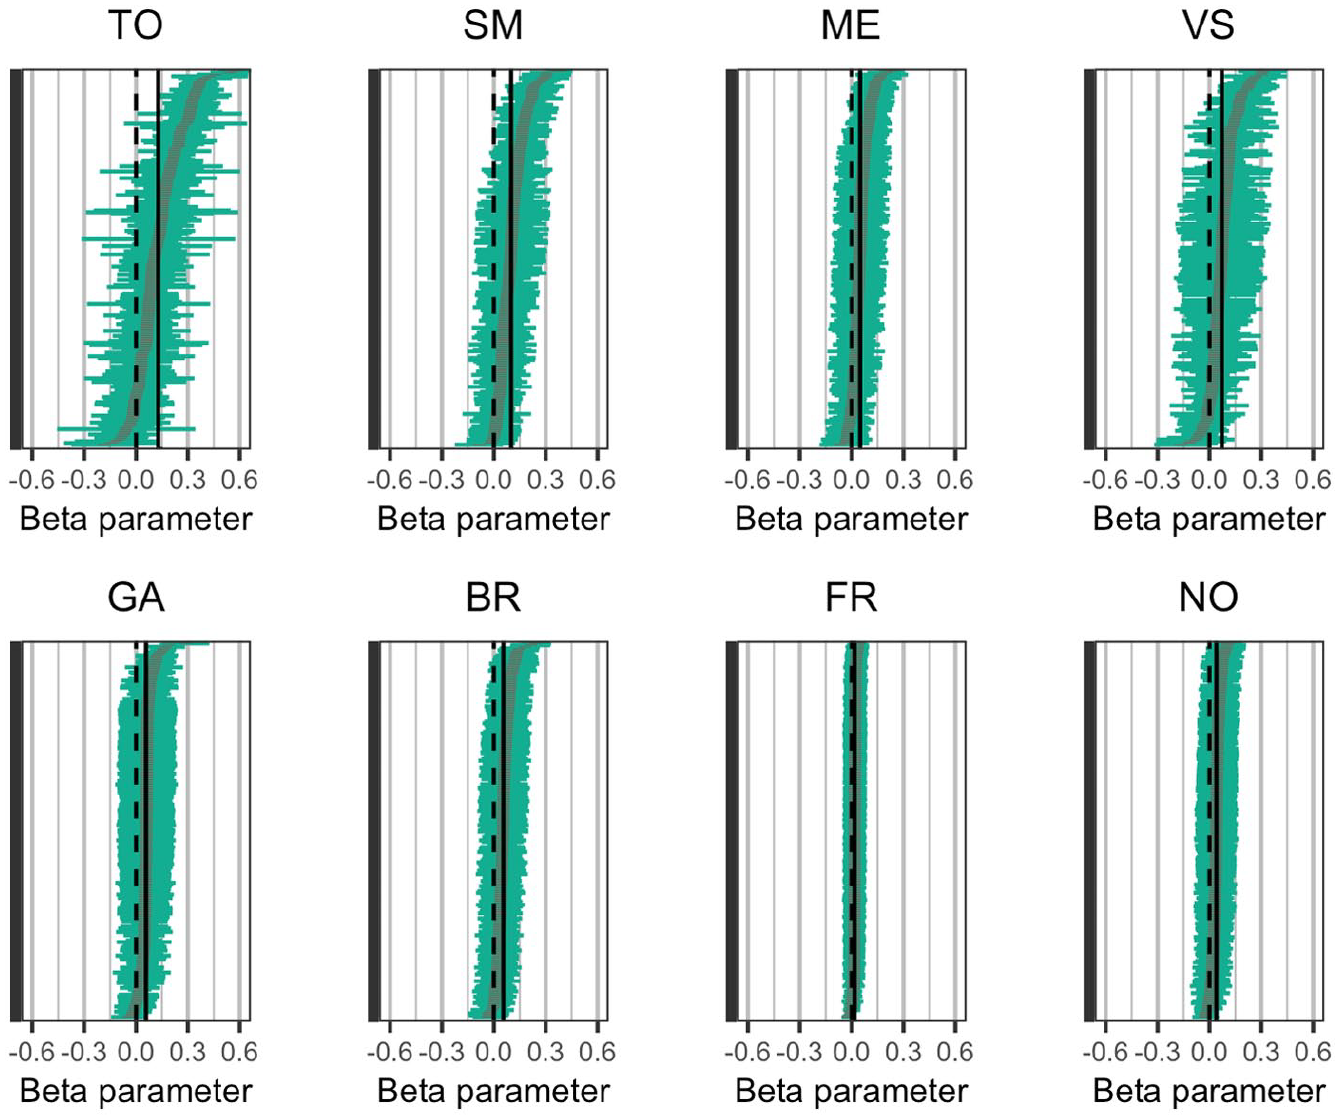
Person-specific associations between momentary procrastination and each smartphone usage pattern. Each horizontal gray line represents one person’s association between momentary procrastination and a given smartphone usage pattern. Each horizontal line represents the 95% credible interval for that specific association. Associations with 95% credible intervals containing zero (i.e., the dotted line) are considered not statistically significant. See Table 2 for a legend of the variable labels.
Between-person associations
We also estimated between-person associations between self-reported procrastination and passively logged smartphone usage patterns (H6a–H6i). That is, the extent to which individuals who report a higher average procrastination level also tended to have a higher average level of smartphone usage pattern. Associations ranged from −0.08 to 0.04, but none were statistically significant: p-values ranged between 0.13 and 0.36 and all CIs included zero.
Discussion
The first aim of this study was to empirically test the assumption that smartphone use is a momentary manifestation of procrastination. Overall, the findings support this assumption: Momentary procrastination was positively associated with passively logged smartphone usage patterns, ranging from application usage to notifications to fragmentation. That is, after spending more time on their smartphone applications, receiving more notifications, and using their smartphone in a more fragmented manner, students tended to report an increase in procrastination. Notably, these within-person associations were very weak (e.g., fragmentation: 0.017) to weak (e.g., social media: 0.10). Our second aim was to examine the person-specificity of the associations between smartphone use and procrastination. The observed person-specific associations varied weakly (e.g., fragmentation) to moderately (e.g., social media) across individuals and were relatively strong in some cases (range −0.184 to 0.573). The vast majority (93.78%) of person-specific associations was positive, suggesting a rather homogeneous impact. The remaining person-specific associations had a negative sign. Generally, however, the person-specific associations in this study should be interpreted with caution. Although with a median of 141 assessments per person, we did have substantially more assessments than recommended for drawing person-specific conclusions (i.e., 50–100; Voelkle et al., 2012), the majority of n = 1 estimates were not statistically significant. The person-to-person differences in the strength and sign of associations suggest subtle differences in how individuals use their smartphone or appraise their behavior on these devices. The third aim of the study was to test the relationship between procrastination and smartphone usage patterns at the between-person level. At this level, we found individuals’ average procrastination levels were not associated with their average level of any usage patterns.
An important question to address is whether our findings point toward smartphone use constituting, or toward smartphones promoting procrastination. In our view, the data support both. On the one hand, smartphone application use appears to constitute procrastination, as time periods in which smartphone use manifested itself overlapped with procrastination, albeit generally to a mild extent. That is, time spent on smartphone applications might reasonably be considered time that is not invested in intended actions, such as studying. This interpretation matches the consensual definition of procrastination (i.e., an irrational, voluntary delay to starting or completing an intended course of action; Steel, 2007) and sits well with research showing that both procrastination (Steel & Klingsieck, 2016) and (passively logged) smartphone use (e.g., Amez et al., 2019) are associated with poorer study outcomes.
On the other hand, the association between smartphone notifications and procrastination suggests that smartphones might potentially also promote procrastination. As the estimates were controlled for prior procrastination, they reflect within-person changes in procrastination in the interval of smartphone use. After all, notifications may promote procrastination by luring users into the consumption of an imminent short-term reward in the form of a like, message, or update. However, as our data are observational, this causal link is subject to alternative explanations. For instance, our descriptive statistics suggest that a higher number of notifications tended to co-occur with increased messenger use. Thus, when students spent more time on messengers, they tended to receive more notifications (and vice versa). A greater number of notifications might therefore simply reflect procrastinatory messenger use triggering an increase in notifications rather than notifications triggering procrastination.
An alternative (but not mutually exclusive) interpretation of our general findings could be that students appraise smartphone use to be problematic, mislabeling limited smartphone use to reflect a high level of procrastination. That is, students attach subjective labels (i.e., intensity of procrastination) to objective behavior (i.e., actual time spent on the smartphone) and these labels might be more severe than appropriate if the actual behavior is innocuous or even beneficial. Such an observation might lead to the paradigmatic question of whether procrastination is an inherently subjective experience (albeit with consistent themes, such as that of delayed behavior), rather than an objective behavior that people may perceive and interpret differently, and may therefore also misinterpret. This latter explanation of procrastination dovetails with recent scholarly work that argues smartphone users have internalized media narratives that smartphone use is commonly problematic and fail to acknowledge the positive aspects of their smartphone use (Lanette et al., 2018). For instance, students might judge their smartphone use to be a waste of time, even if it has salubrious effects, such as recovering from the wear and tear of daily life (cf. Reinecke & Hofmann, 2016), and serves other long-term aims that students might not be fully aware of, such as strengthening ties with friends (Vanden Abeele et al., 2017). If such misappraisal at least partially explains the associations observed in this study, it is our view that the culprit in the story may not always be the smartphone use itself, but the negative self-evaluations related to smartphone use. After all, when smartphone use is misappraised as procrastination, this might unnecessarily induce feelings of guilt that could contribute to a downward spiral of psychological problems causing other problems (cf. Aalbers et al., 2019). To investigate this “misappraisal” hypothesis, future studies could, for instance, test whether perfectionistic students are more likely than non-perfectionistic students to label smartphone usage patterns as procrastination (i.e., a stronger person-specific association) and experience negative affect (e.g., guilt) as a result.
An important feature of our study is the large number of assessments, making it possible to detect rather small short-term within-person associations between procrastination and smartphone usage patterns in daily life. Three factors might explain the limited association strength. First and foremost, smartphone use conceivably represents only a portion of most individuals’ total procrastination. For instance, participants might procrastinate on their laptop, by watching television, or away from their screens. Second, by taking a stringent test and modeling the autoregression of procrastination, we assessed how smartphone use predicted changes in procrastination, which potentially limits the strength of associations. It should be noted, however, that the zero-order within-person associations (i.e., not corrected for autoregression of procrastination) did not deviate much from our estimates. Hence, this analytical choice did not influence the strength of associations much. Third, procrastination self-reports conceivably not only depend on the participants’ actual procrastination, but also on their (fluctuating) motivation and ability to accurately recall and report it. Such measurement error, the extent of which we do not know, could have resulted in underestimated association strength. Finally, we have assessed short-term effects within persons in daily life. In dynamic system theories of development, such small effects may pile up and lead to larger longer-term effects. Whether this is the case when it comes to the effects of smartphone use on procrastination is yet to be determined. However, this question is an important direction for future research.
The present findings might be viewed as encouraging to the field of smartphone research, which has been criticized for its lack of rigor in the measurement domain (e.g., Davidson et al., 2020). Recent work in the field suggests previously observed associations between procrastination and smartphone use might have been (strongly) driven by questionable measurement practices, as this appears to have been the case for the association between smartphone use and psychological well-being (cf. Davidson et al., 2020; Sewall et al., 2019). However, resolving several of the methodological issues in previous work, our study shows that the association between smartphone use and procrastination is not restricted to (partial) correlations between cross-sectional surveys (Im & Jang, 2017; Rozgonjuk et al., 2018; Yang et al., 2019), but generalizes to conservatively estimated within-person associations between repeated in vivo measures of procrastination and passively logged smartphone usage data.
Our findings have implications for future research on procrastination. Although we set out to find out whether procrastination treatment could possibly be optimized by tailoring interventions to an individual’s idiosyncratic smartphone usage patterns, our data did not directly suggest that such personalized interventions are warranted. This is because person-specific associations did not vary much across our participants. Furthermore, an exclusive focus on smartphone use may not suffice, considering the generally weak associations between smartphone use and procrastination. To conceptualize the (potentially) idiographic nature of procrastination with the aim of tailoring treatment, a different, more holistic approach might be more fruitful. First, like the daily diary study by Schnauber-Stockmann et al. (2018), research should investigate person-specific associations between procrastination and multiple (media) behaviors (e.g., watching television), in addition to smartphone usage patterns. Such behaviors would ideally be passively logged or sensed (e.g., face-to-face conversations; Harari et al., 2016) rather than self-reported. Second, when assessing the idiosyncrasy of procrastination, research should take into account the profile of person-specific associations between procrastination and different behaviors and test whether separable clusters of procrastinators can be found. For instance, whereas some people might procrastinate on social media as well as messenger applications, others might do so by watching television and using gaming applications. By taking into account associations between procrastination and multiple (passively logged) behaviors, we might more completely map how an individual procrastinates.
Notwithstanding the large dataset and the combined use of the experience sampling method (ESM) and passive tracking, our findings should be interpreted in light of three limitations. First, procrastination was measured using self-report, which likely introduced measurement error that might have led to over- or underestimation of associations. Follow-up research could limit self-report inaccuracies by reducing the time window of procrastination ESM items (e.g., “In the past 15 minutes, I wasted time by doing other things than what I had intended to do.”). Second, our study assumed linear associations for all individuals in our sample. Future research could take into account non-linear associations by first applying machine learning algorithms as an exploratory data analysis step. Third, as this study was conducted in an international student sample, it is unsure how findings generalize to other populations. A next step could be test whether they apply to individuals who currently do not attend college.
To conclude, in this preregistered study, we applied DSEM analyses to a large hybrid dataset consisting of in vivo procrastination measures and passively logged smartphone usage data. The results indicate that (a) procrastination was positively associated with several smartphone usage patterns at the within-person level but not at the between-person level, and (b) that the within-person associations strongly differed in strength across individuals. For the vast majority of people, procrastination and smartphone use seem to be positively linked, although a minority might potentially experience benefits (i.e., reduced procrastination). Given the scale of our data collection and the expertise required for the present study—from developing this study to preprocessing, analyzing, and interpreting the data—we encourage interdisciplinary, multi-laboratory studies into (within-person) associations between psychological variables and passively logged smartphone use.
Supplemental Material
sj-doc-1-mmc-10.1177_2050157921993896 – Supplemental material for Caught in the moment: Are there person-specific associations between momentary procrastination and passively measured smartphone use?
Supplemental material, sj-doc-1-mmc-10.1177_2050157921993896 for Caught in the moment: Are there person-specific associations between momentary procrastination and passively measured smartphone use? by George Aalbers, Mariek M. P. vanden Abeele, Andrew T. Hendrickson, Lieven de Marez and Loes Keijsers in Mobile Media & Communication
Supplemental Material
sj-doc-2-mmc-10.1177_2050157921993896 – Supplemental material for Caught in the moment: Are there person-specific associations between momentary procrastination and passively measured smartphone use?
Supplemental material, sj-doc-2-mmc-10.1177_2050157921993896 for Caught in the moment: Are there person-specific associations between momentary procrastination and passively measured smartphone use? by George Aalbers, Mariek M. P. vanden Abeele, Andrew T. Hendrickson, Lieven de Marez and Loes Keijsers in Mobile Media & Communication
Supplemental Material
sj-doc-3-mmc-10.1177_2050157921993896 – Supplemental material for Caught in the moment: Are there person-specific associations between momentary procrastination and passively measured smartphone use?
Supplemental material, sj-doc-3-mmc-10.1177_2050157921993896 for Caught in the moment: Are there person-specific associations between momentary procrastination and passively measured smartphone use? by George Aalbers, Mariek M. P. vanden Abeele, Andrew T. Hendrickson, Lieven de Marez and Loes Keijsers in Mobile Media & Communication
Supplemental Material
sj-docx-4-mmc-10.1177_2050157921993896 – Supplemental material for Caught in the moment: Are there person-specific associations between momentary procrastination and passively measured smartphone use?
Supplemental material, sj-docx-4-mmc-10.1177_2050157921993896 for Caught in the moment: Are there person-specific associations between momentary procrastination and passively measured smartphone use? by George Aalbers, Mariek M. P. vanden Abeele, Andrew T. Hendrickson, Lieven de Marez and Loes Keijsers in Mobile Media & Communication
Supplemental Material
sj-docx-5-mmc-10.1177_2050157921993896 – Supplemental material for Caught in the moment: Are there person-specific associations between momentary procrastination and passively measured smartphone use?
Supplemental material, sj-docx-5-mmc-10.1177_2050157921993896 for Caught in the moment: Are there person-specific associations between momentary procrastination and passively measured smartphone use? by George Aalbers, Mariek M. P. vanden Abeele, Andrew T. Hendrickson, Lieven de Marez and Loes Keijsers in Mobile Media & Communication
Footnotes
Acknowledgements
The authors wish to thank Ghaith Al Seirawan, Andrei Oprea, Ethel Pruss, Marieke van der Pol, and Kyle van Gaeveren for their outstanding help during the data collection of this study. The authors further thank two anonymous reviewers for insightful comments that strongly improved the present article.
Funding
The authors disclosed receipt of the following financial support for the research, authorship, and/or publication of this article: Funding was received from the Tilburg University IMPACT program as well as a VIDI grant (NWO VIDI grant no. 452.17.011) awarded to Loes Keijsers.
Supplemental material
Supplemental material for this article is available online.
Author biographies
References
Supplementary Material
Please find the following supplemental material available below.
For Open Access articles published under a Creative Commons License, all supplemental material carries the same license as the article it is associated with.
For non-Open Access articles published, all supplemental material carries a non-exclusive license, and permission requests for re-use of supplemental material or any part of supplemental material shall be sent directly to the copyright owner as specified in the copyright notice associated with the article.