
Abstract
With digital communication increasingly shifting to mobile devices, communication research needs to explore ways to retrieve, process, and analyze digital trace data on people’s most personal devices. This study presents a new methodological approach, mobile data donations, in which smartphone usage data is collected unobtrusively with the help of mobile log data. The iOS Screen Time function is used as a test case for gathering log data with the help of screenshots. The study investigates the feasibility of the method, sample biases, and accuracy of smartphone usage self-reports on a general population sample of Dutch citizens (n=404). Importantly, it explores how mobile data donations can be used as add-ons or substitutes for conventional media exposure measures. Results indicate that (a) users’ privacy concerns and technical skills are crucial factors for the willingness to donate mobile log data and (b) there is a strong tendency for underreporting of smartphone usage duration and frequency.
Introduction
Digital communication increasingly takes place on peoples’ mobile devices, making it critical for communication research to investigate mobile usage patterns and their effects in greater detail. However, the multipurpose nature of smartphone usage and the different contexts and times of usage push traditional media consumption measurement methods to their limits. Assessing different types of mobile media usage with survey measures that rely on respondents’ self-report presents difficulties, with short-term exposure, erratic usage, and multi-tasking on mobile devices likely increasing recall biases (Schwarz & Oyeserman, 2001; Vanden Abeele et al., 2013). The usage of digital trace data to counteract these problems—although successful on PCs and tablets (see Araujo et al., 2017; Scharkow, 2016)—may be limited on smartphones (users’ most personal devices) due to privacy concerns as well as the technical skills necessary to share such data.
Data donations present a different approach. In the quest for collecting reliable digital usage data, data donations turn the conventional relationship between users and researchers upside down: rather than having researchers interfere with users’ devices and install applications to gain remote access to user data, with data donations, users provide researchers with data that have already been collected by their devices or platforms (Thorson et al., 2019). Recently, such data collection features have become integrated in the operating systems of smartphones, such as iOS Screen Time or Android’s Digital Wellbeing. These new features include information about the smartphone operation (e.g., duration of screen time or number of pickups) as well as patterns of usage and activities (e.g., most-used apps and websites). Although the primary objective of these functions is to give users control over smartphone usage and insights into their own digital health (Jiang, 2018), via mobile data donation these functions can also provide communication researchers a new set of media usage measures that are superior to existing options. Specifically, mobile data donations extend the range of available mobile log data, present a more transparent and self-administrable way of sharing data with researchers, and remove the need for installing external software, which can be complex for some users. Even more, the levels of detail often included in the data, such as most-used apps, present us with the opportunity to extend our limited knowledge about the accuracy of self-reported smartphone usage in meaningful ways.
With this in mind, the current study is designed to explore the possibilities of data donation for digital communication research. This study uses the iOS Screen Time feature as a test case and links individual self-reported two-wave panel survey data (n=404) in the Netherlands to smartphone log data donated by participants. It thereby (a) presents a new approach on how to collect and process log data of mobile phone users with the help of screenshots, (b) explores sample biases with regards to privacy risk and data protection literacy, and (c) investigates the extent to which self-reports are reliable when compared to log data for different types of smartphone behavior. Altogether, this study provides researchers with guidelines on how data donation of smartphone log data can be retrieved, processed, and analyzed, while discussing the limits of smartphone data donations for digital communication research.
Mobile data donations
The technological and social characteristics of smartphones make them a uniquely advantageous innovation for application in social science research (Raento et al., 2009). Smartphones are carried willingly by users across the globe and, importantly, they integrate a number of technological applications and sensor data that make them uniquely suited for automated observations. Their increasing usage for an ever-growing set of purposes and applications calls for communication research to shift its focus even more strongly on mobile media exposure. However, it is exactly this ubiquitous usage that makes it so challenging for researchers to study mobile media exposure—particularly when it comes to extracting in-depth insights into activities conducted and information retrieved via these devices.
Thankfully, however, smartphones are indeed smart in that they not only provide numerous usage opportunities for users, but they also log a great deal of data in this process. Features such as iOS Screen Time, the development of which was triggered in part by calls for digital wellbeing and data autonomy, now make these once inaccessible logs available to users (Ausloos, 2019; Jiang, 2018; Thorson et al., 2019). The potential for sharing these log data with researchers, coined mobile data donation, opens a window of opportunity for researchers to receive richer data in a way that is less intrusive to participants. With mobile data donation, users share (parts of) their smartphone log data that are accessible to them through existing functions of their devices or operating systems with researchers. In our case, this was done by taking screenshots of the usage details from the iOS Screen Time function and uploading them for researchers to access. Mobile data donation thereby occurs without interference of a researcher and relies on information that is that already accessible to the users on their devices; hence, the installation of external software is not necessary. Using data that have already been collected on a device can reduce reactivity biases of respondents and, from a technological point of view, facilitates a shift towards passive tracking with non-automated access.
This type of user-dependent process of data gathering has been used before in different fields, such as clinical research. But it is only recently that the donation of smartphone log data has become possible for communication science. Prior to this, we witnessed numerous attempts to understand smartphone use through other types of data access with limited success. For example, data from telecommunication operators (Boase & Ling, 2013; Schüz & Johansen, 2007) were only able to provide insights into basic functions, such as length of calls or the number of text messages. Tracking applications, installed by users, increased the depth of insights somewhat but interpretation was hindered by operating system restrictions (e.g., Kobayashi & Boase, 2012; Stier et al., 2020). Most recently, scholars have attempted to use the “app category usage” on Android phone users’ devices to assess content use (Deng et al., 2019), but even here, scholars were unable to access information such as total screen time or number of notifications or pick-ups. These “new measures” of mobile communication behavior are important, as research has shown that smartphone usage and different forms of psychological wellbeing are interrelated, such as for stress, hyperactivity, and general wellbeing (Kushlev et al., 2016; Orben, 2020; Stiglic & Viner, 2019). Recently, Sewall et al. (2020) found indications that self-reports of screen time and mobile social media use only partly capture actual behavior, thereby blurring the association with psychosocial wellbeing. Moreover, realistic measures that reflect a broad spectrum of mobile usage behaviors can inform newly introduced concepts, such as “digital wellbeing” (Vanden Abeele, 2020). Beyond informing specific research fields, logged frequencies of digital media use can function as a new baseline measure in communication research. Knowledge about the extent to which an individual engages in digital communication provides an important reference point to assess the relevance of specific behaviors, such as receiving push messages for news (Stroud et al., 2020), mobile gaming (Christensen & Prax, 2012), mobile news use (Ohme, 2020), or smartphone-checking behavior (Costera Meijer & Kormelink, 2015). Mobile data donation therefore offers an opportunity to address some of the limitations of previous methods while also overcoming the limitations of self-report. At the same time, mobile data donation does come with potential challenges: namely, compliance and sampling biases.
Challenge 1: Mobile data donation compliance
Although participants do not need to install external software, the retrieval of these data is more complicated. As of the time of this writing, no export functions for user-accessible mobile log data exist that could be legally used by a wide share of users. But the visibility of log data on people’s screens makes it possible to extract data by the widely used smartphone feature of taking screenshots. In health research, screenshot techniques have already been used successfully as a mode of data retrieval (Chiatti et al., 2018; Gower & Moreno, 2018), although in communication research its application is still sparse (but see Reeves et al., 2019). That said, existing data suggest the compliance rate may be a challenge for mobile data donation. For example, in a mobile tracking study, Keusch et al. (2019) reported a 35% hypothetical willingness to participate whereas Boase and Ling (2013) received informed consent from approximately 31% of participants to access their mobile log data. Similarly, in a study about screen time usage among 12–15-year-olds, only 13% of adolescents complied with a request to upload a screenshot of battery use (Gower & Moreno, 2018). It is clearly a priority to assess compliance when reviewing the appropriateness and feasibility of a method. Unsurprisingly, given the novelty of the feature, there are no baseline measures about compliance levels of iOS Screen Time screenshot sharing. With this in mind, we ask:
RQ1: How high is the compliance rate among respondents to donate mobile log data in the form of smartphone screenshots?
Challenge 2: Sample biases
Just as compliance is an important question for mobile data donation, so is the question about potential sample biases. In previous studies that attempted to use mobile log data, participants often had to install external software themselves, thus necessitating they had sufficient skills to complete such tasks. Although perhaps not a large burden for student samples, such a task can lead to significant initial sampling biases based on the willingness and ability to install external software when considering the general population. At the same time, as noted by Jürgens and colleagues (2019), knowingly being tracked can also lead to reactivity in responses (response bias).
Although mobile data donation may attenuate sample deviations that were found in previous studies, it is important to investigate potential sample biases of this new method. As with any other study conducted on a subpopulation, there is the degree of (1) sampling bias. From this, specific to mobile data donation, there is the degree of (2) selection bias that can result from asking participants to enable the Screen Time function on their phone and agreeing to be re-contacted for the upload. 1 Even more, responding to the request to upload mobile log data leads to a (3) non-response bias, that is introduced if data donators and non-donators differ in observable variables (see Figure 1). This study is one of the first to investigate the difference between data donators and non-donators thus assessing issues of sample bias in mobile data donation. With this context in mind, we focus on factors that directly relate to the methodological approach, namely the private nature of data and the technical skills required to share those. The assessment of biases thus not only informs research that relies on data donations to retrieve private information but also tests the extent to which this new method may create a digital divide in research if privileging digitally skilled people.
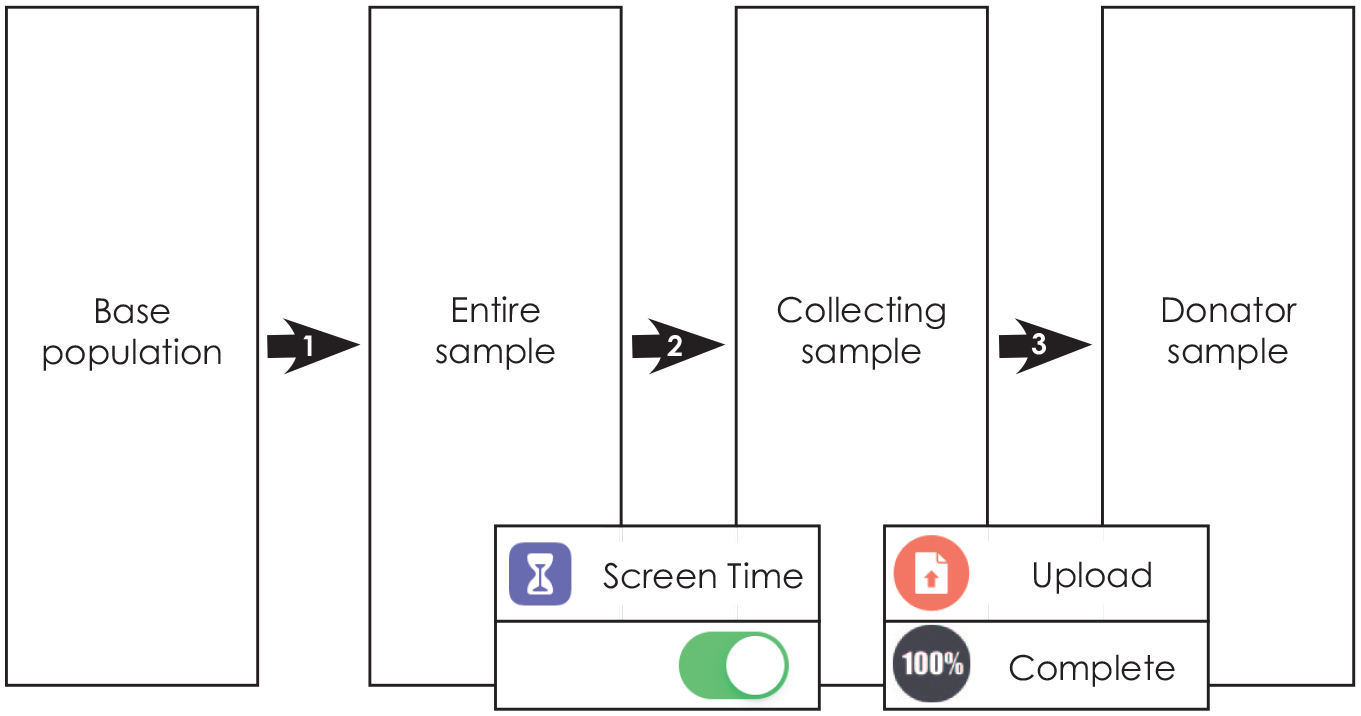
Mobile data donation sample process.
RQ2a: Do mobile data donators differ significantly from non-donators in regard to privacy and security concerns?
RQ2b: Do mobile data donators differ significantly from non-donators in their technical smartphone skills?
Opportunity: Accuracy
Although compliance and sampling biases certainly present challenges to mobile data donation, as noted at the outset, one of the attractive opportunities of mobile data donation is accuracy. Due to the constant, multipurpose usage of mobile phones, respondents face a high cognitive burden to quantify different types of individual behavior (Lee et al., 2017). And although research heavily relies on self-reports of smartphone usage in a variety of domains (e.g. Stiglic & Viner, 2019; Shih et al., 2015), self-reports of smartphone usage may be hitting a cognitive limit. A review of the literature shows that little is known about how accurately users self-report recent usage patterns (but see Vanden Abeele et al., 2013, Boase & Ling, 2013 for work on the accuracy of reporting the number and duration of mobile calls and text messages). Recently, usage behaviors such as picking up the phone or usage events such as receiving push notifications increasingly determine users’ smartphone experiences. Research on the accuracy of reporting in this field of mobile phone studies is limited and mostly addressed by the use of student samples (see Andrews et al., 2015; Ellis et al., 2019; Lee et al., 2017). Access to smartphone log data creates unique opportunities to extend research on how accurate peoples’ self-reports on their smartphone usage are, both for duration and usage events. We therefore ask:
RQ3a: How accurately can people estimate their duration of smartphone usage?
RQ3b: How accurately can people estimate smartphone usage events (notifications) and behavior (pick-ups)?
Beyond general usage metrics, the built-in screen time features of mobile operating systems provide information on frequently used apps or websites visited. Because usage of specific apps and websites is an important measure in studies aimed at understanding the content and consequences of media usage in mobile phones, it is important to evaluate how accurately users are able to report smartphone usage on a content-related level. For overarching usage categories, such as “entertainment” or “social network sites,” previous research with a student sample found over- and underestimation of the time spent with different usage categories (Lee et al., 2017), whereas Deng et al. (2019) furthermore found that people mostly overestimate the usage of different app categories. On the granular level of websites and apps used, it is yet an open question of how well people can report the content they most frequently consume or use on their smartphone. We therefore ask:
RQ3c: How accurate are self-reports of the most frequently used applications and websites on a smartphone?
Method
Design and procedure
To address the research questions, a two-wave online panel survey among Dutch-speaking iPhone users in the Netherlands was conducted in April 2019. A public opinion research company was used to recruit a sample of 404 iPhone users (American Association for Public Opinion Research (AAPOR) response rate 1 = 54%). All participants provided informed consent. Respondents were aged between 18 and 68 years old (M = 40, SD = 13.7), and 55% were female. In terms of formal education, 2% of respondents held a primary education as lowest degree, 56% a secondary, and 42% a tertiary, higher education degree. The first wave functions as a baseline measure of self-reported privacy concerns, technical skills, and (mobile) media consumption patterns. At the end of the first wave, participants who agreed to be contacted again in the second wave were instructed to turn on the Screen Time function of their iPhone, if they had not done so already. The second wave was conducted 7 days after the end of the first wave, allowing for the gathering of screen time data during a full week for all participants. At the end of the second survey, respondents were provided with a step-by-step guide on how to take and upload screenshots of the iOS Screen Time function. Participation was incentivized by a bonus system whereby respondents received points worth €2.10 for completion of the first wave and additional €4.00 for the completion of the second wave, which included the donation of their mobile log data. Respondents who took the survey on their smartphone (72%) could upload screenshots directly from their mobile device. Respondents participating on a desktop computer or other device could switch devices during the survey, so they could upload the screenshots from their smartphone (see Figure 2 for examples). Of note, the study was approved by the faculty’s Institutional Review Board under the condition that all screenshots were anonymized by the researcher before analysis. As such, screenshots were anonymized by researchers and brought into an analyzable format by a research assistant. Subsequently, screen time data were linked to survey responses of respondents.
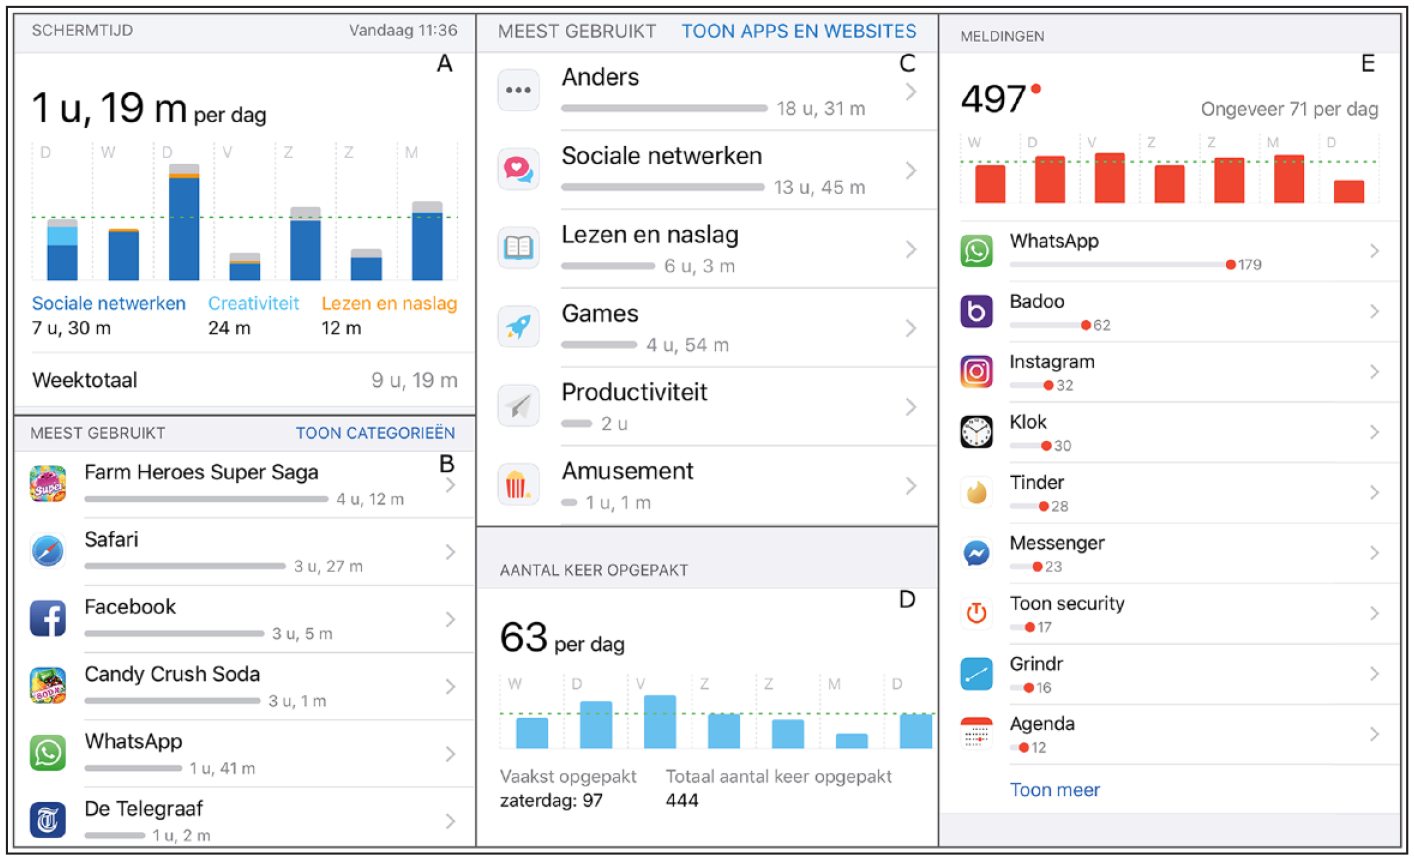
Example of screenshots.
Measures
Log data
The log data combined in screenshots included information on usage duration and frequency of usage incidents. Among usage duration measures are the total screen time as well as the time users engaged in nine different usage categories. These categories are predefined by the operating system and include social networking, productivity, or entertainment (see a full list, including usage times, in Figure 3). Furthermore, log data included weekly usage duration of the 10 most-used apps and websites. A research assistant copied the usage data from the screenshots into a spreadsheet to make them ready for analysis. This included the names of the five most-used apps and websites.
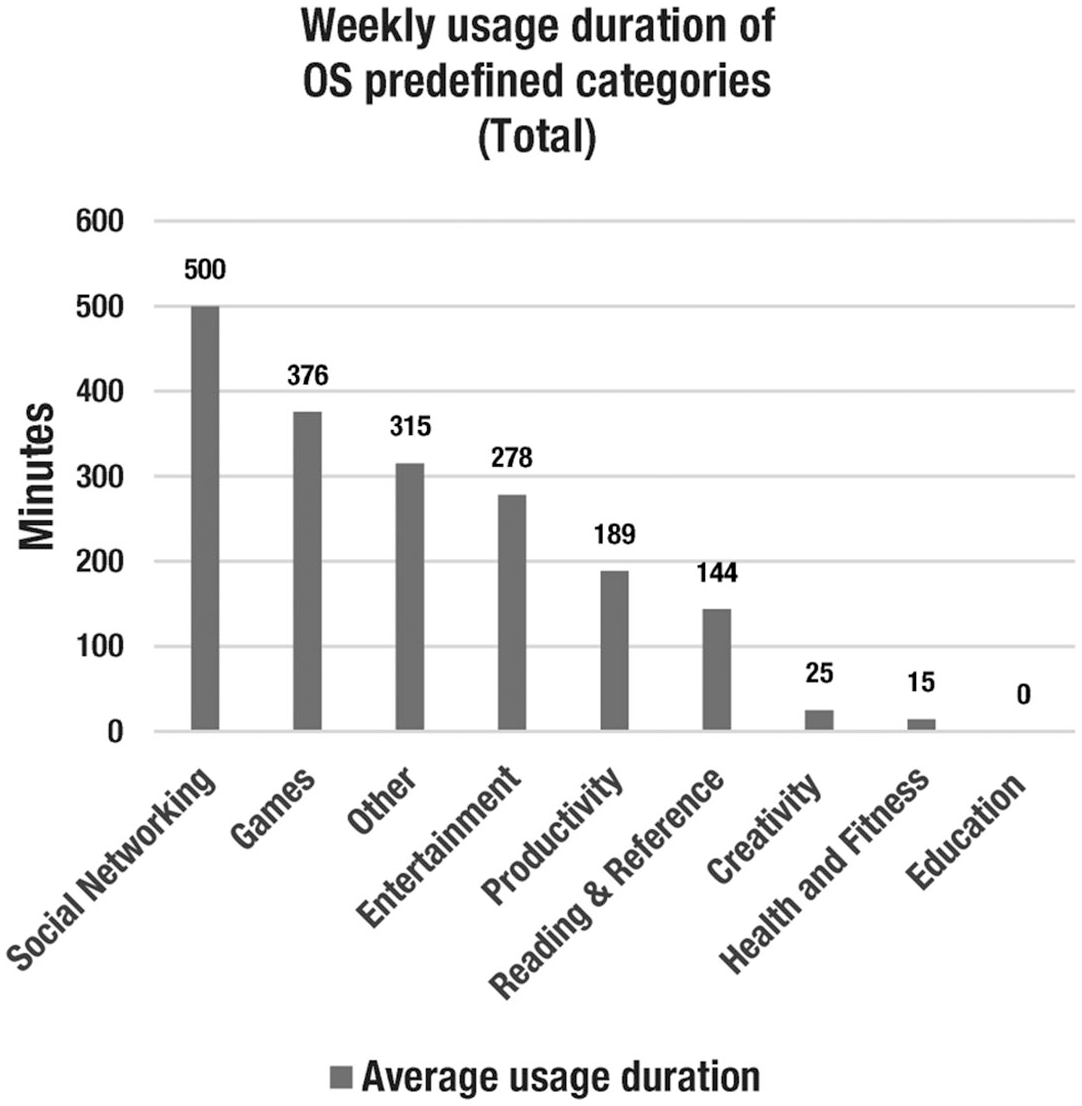
Usage metrics of OS-predefined categories.
Daily smartphone use
To be able to compare self-reports with log data, we asked respondents to estimate (a) how many minutes a day they were using their smartphone, specifically when they were actively looking at the screen (thus excluding streaming to other devices or listening to music); (b) the number of times they checked their smartphone, either by just looking at the lock screen or unlocking it for further usage; and (c) the number of push notifications they received. Participants typed their responses in minutes or frequency in a blank text field and provided these estimates for “per day.” On average, respondents reported using their smartphone actively for 136 minutes (SD = 120) per day, with responses ranging from 1 to 800 minutes. 2 When it comes to number of pick-ups, on average, respondents reported to pick up their smartphone 40 times a day (SD = 69.8), with responses ranging from 0 to 680 times. With regards to the number of push notifications, we first asked whether respondents had enabled push notifications on their smartphone; 68.5% confirmed this. These respondents estimated the number of notifications they receive on average to be around 40 per day (SD = 79), ranging from 0 to 667. Furthermore, respondents indicated the five apps and five websites they had used most on their smartphone in the last 7 days by typing the names into open text fields.
Privacy and security risk
Privacy and security concerns (M = 3.27, SD = .92, Cronbach’s α = .92) were measured by asking respondents how strongly they agree (1: totally disagree to 5: totally agree) with six statements: five statements were included from Dobber et al. (2019) and a sixth item “I worry that too much personal information can be found about me online already” was added. Given that smartphones were the focus of our study, we also assessed mobile privacy concerns and mobile privacy literacy. Mobile privacy concerns (M = 3.18, SD = .89, Cronbach’s α = .89) were assessed with five items adapted from Keith et al. (2013) (e.g., “The personal information on my smartphone is already stored by too many companies”). Mobile privacy literacy (M = 2.1, SD = .65, Cronbach’s α = .85) assessed the frequency (0: never, 4: (almost) always) with which participants performed data protection-related activities on their smartphone. It was measured with nine items based on Park and Mo Jang (2014), including “Encrypting mobile phone and/or texting messages” or “Turning off location service enablers due to privacy or security concerns.”
Technical skills
To assess technical skills related to smartphones, we developed a set of items to measure mobile phone savviness (M = 3.1, SD = .83, Cronbach’s α = .76), asking how strongly participants agreed with five statements such as “If I encounter a technical problem on my smartphone, I usually know how to fix it.” These items were developed solely for the purpose of this study given the lack of existing measures that tap into technical smartphone skills.
Analytic approach
We calculated the accuracy of self-reports for screen time use, pick-ups, and push notifications using the log data retrieved from the uploaded screenshots by the data donators in our final sample on the second wave. To assess the absolute error of reporting, following Araujo et al., (2017), we subtracted the mobile log data information from the respondents’ self-reported value for a given measure and extracted the absolute value (i.e., errormeasure = |self-reportmeasure - log datameasure|). It was considered under-reporting when log data showed higher levels of activity than what was (self-) reported by the respondents. We calculated under-reporting by subtracting the log data value from the self-reported value. Instances where respondents reported correctly (difference = 0) or overreported their activity were set to 0 for that variable. In turn, it was considered over-reporting when the log data showed lower activity levels than (self-)reported by respondents. We calculated this by subtracting the self-reported value from the log data. Instances where respondents reported correctly (difference = 0) or underreported their activity were set to 0 for that variable.
Results
Compliance
The first aim of this study was to determine how many respondents were willing to donate their mobile log data to researchers and were successful with this donation (RQ1). Of the initial sample of 404 respondents, 307 (75.8%; collecting sample) agreed at the end of the first survey to be contacted again and confirmed they had turned on the Screen Time function on their phone. Of the 307 respondents who were contacted again, 122 (retention rate 40%) finished the second wave of the survey. Of those 122 respondents, 47 shared their mobile log data successfully with the researchers by uploading their screenshots, presenting the final donator sample. The other 65 respondents either did not start an upload, uploaded incomplete or bogus content, or did not enter the correct information (e.g., their unique identifier) in the process of switching from taking the survey on a computer to uploading the screenshots on a smartphone. Overall, 11.6% of participants of the full sample ultimately donated their mobile log data to this study.
Sample biases
As described earlier, collecting mobile data donations relies on a stepwise data collection process, with respondents being able to drop out in two main steps. We therefore focus our analyses on Step 2 (see Figure 1), which can introduce selection biases, and Step 3, which can lead to non-response biases. These two steps in the sampling process that can lead to a loss of participants and thus introduce skews in the sample. To better understand what sample biases can be expected in a mobile donation study, we furthermore compare the final donator sample to the overall study population. Biases are assessed on the level of individuals’ levels of privacy concerns as well as their skills in protecting their privacy and handling their mobile phones (see Table 1 for an overview).
Biases for Different Populations in the Mobile Data Donation Process.
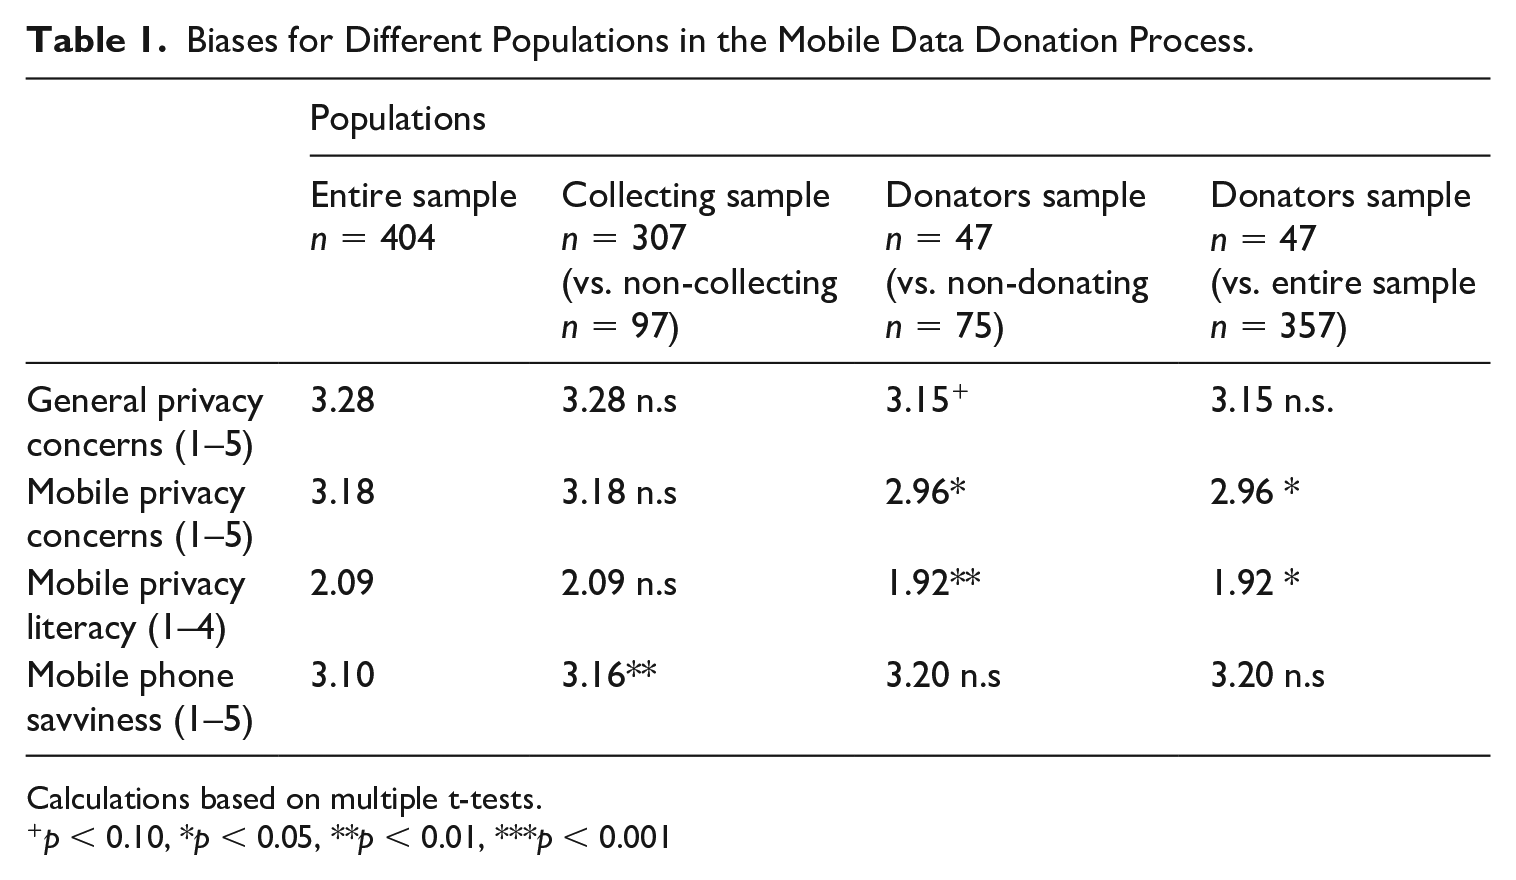
Calculations based on multiple t-tests.
p < 0.10, *p < 0.05, **p < 0.01, ***p < 0.001
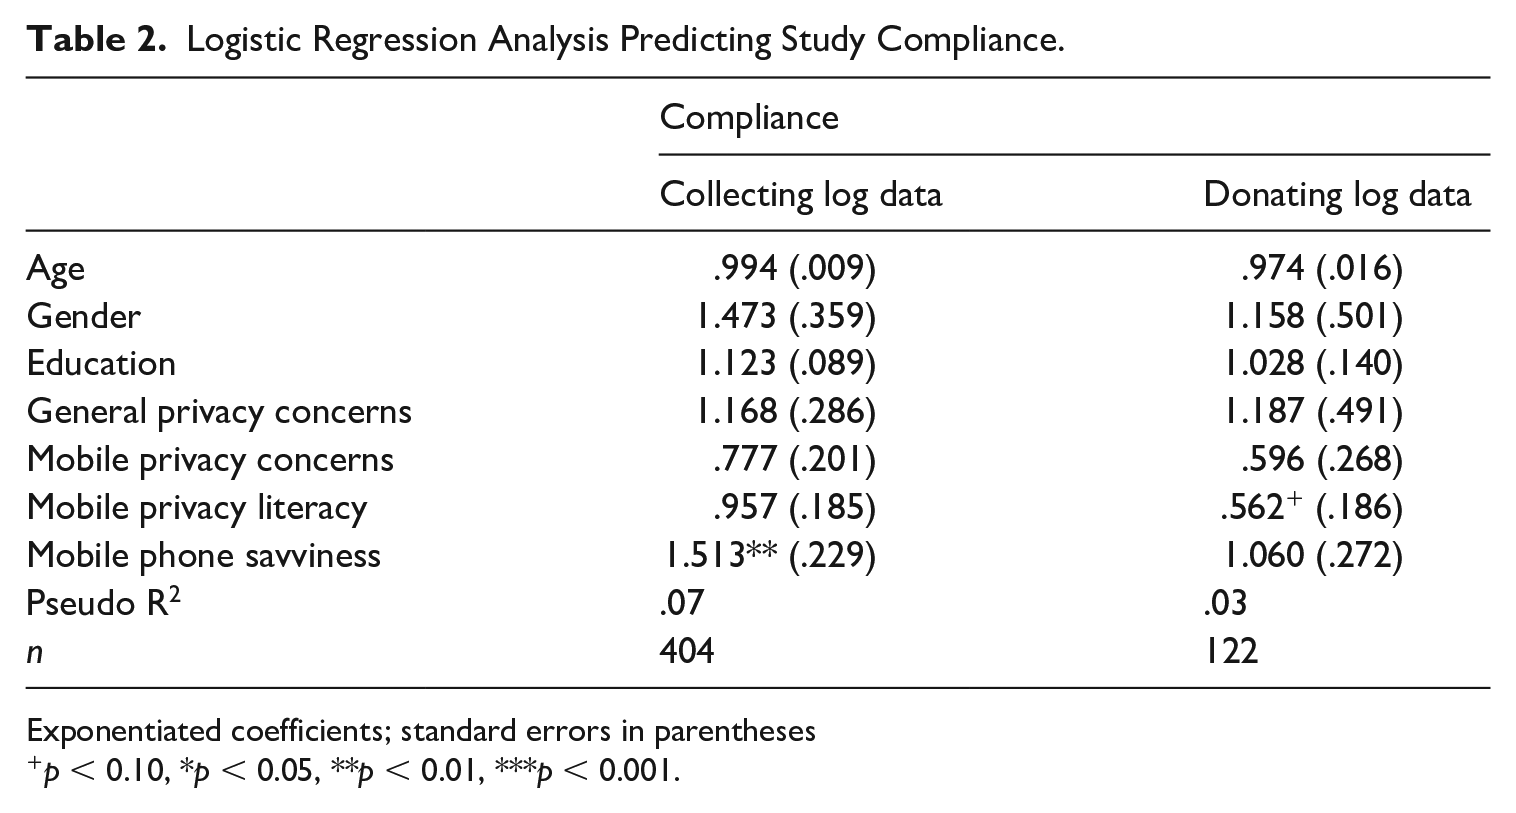
First, we look at selection biases (i.e., respondents deciding to collect data that they would later donate). Compared to the those who decided against activating their Screen Time function and being contacted for the second wave (n = 97; M = 2.90, SD = .85), people who started the collection (n = 307; M = 3.16, SD = .81, p < 0.01) reported higher levels of (perceived) technical mobile phone skills. General privacy (collecting: M = 3.28, SD = .91; non-collecting (M = 3.25, SD = .96; p = .39) or mobile privacy concerns (collecting: 3.17, SD = .87; non-collecting: M= 3.19, SD = .95, p = .56) were not significantly different between both samples, nor was participants’ perceived mobile phone literacy (collecting: M = 2.09, SD = .65; non-collecting: M = 2.08, SD = .64, p = 43). This finding is confirmed in logistic regression analysis, predicting the decision to collect data 3 (Table 2). Only mobile phone savviness was a significant predictor, even when controlling for age, gender, and education. Hence, agreeing to the collection of the data with the help of the Screen Time function was foremost associated with technical skills rather than concerns about data privacy or having the skills to protect it.
Logistic Regression Analysis Predicting Study Compliance.
Exponentiated coefficients; standard errors in parentheses
p < 0.10, *p < 0.05, **p < 0.01, ***p < 0.001.
On the level of non-response bias, in turn, we ultimately differentiate between donators (n = 47) and non-donators (n = 75). Levels of mobile privacy concern were lower for donators (donators: M = 2.96, SD = .83; non-donators: M = 3.28, SD = .85, p < .01), as was their mobile privacy literacy (donators: M = 1.92, SD = .62; non-donators: M = 2.22, SD = .69, p < 0.01). Donators (M = 3.15, SD = .84; non-donators: M = 3.38, SD = .90, p = .08) also trended towards lower levels of general privacy concerns. Levels of self-reported technical skills (donators: M = 3.2, SD = .95; non-donators: M = 3.2, SD = .79, p = 0.52) did not differ significantly. A logistic regression analysis predicting the decision to donate based on all these variables (see Table 2) suggested that mobile privacy literacy is most important.
Overall, the two-step procedure of collecting and donating log data introduced modest sample biases. When testing the influence of perceived risks and skills simultaneously, only technical skills seem to matter for the decision to start data collecting and higher self-reported levels of being able to protect privacy on mobile devices seemed to decrease the likelihood to donate mobile data. Compared to the entire sample, donators scored lower on general privacy concerns as well as concerns specifically related to mobiles, had lower levels of mobile privacy literacy yet indicated higher (perceived) mobile phone skills than non-donators (see Table 1). Not all differences reached the traditional thresholds of statistical significance, and deviances that are introduced when asking respondent to share usage data from their most personal device were rather small, answering RQ2a and b.
Accuracy
Usage, pick-ups, and push notifications
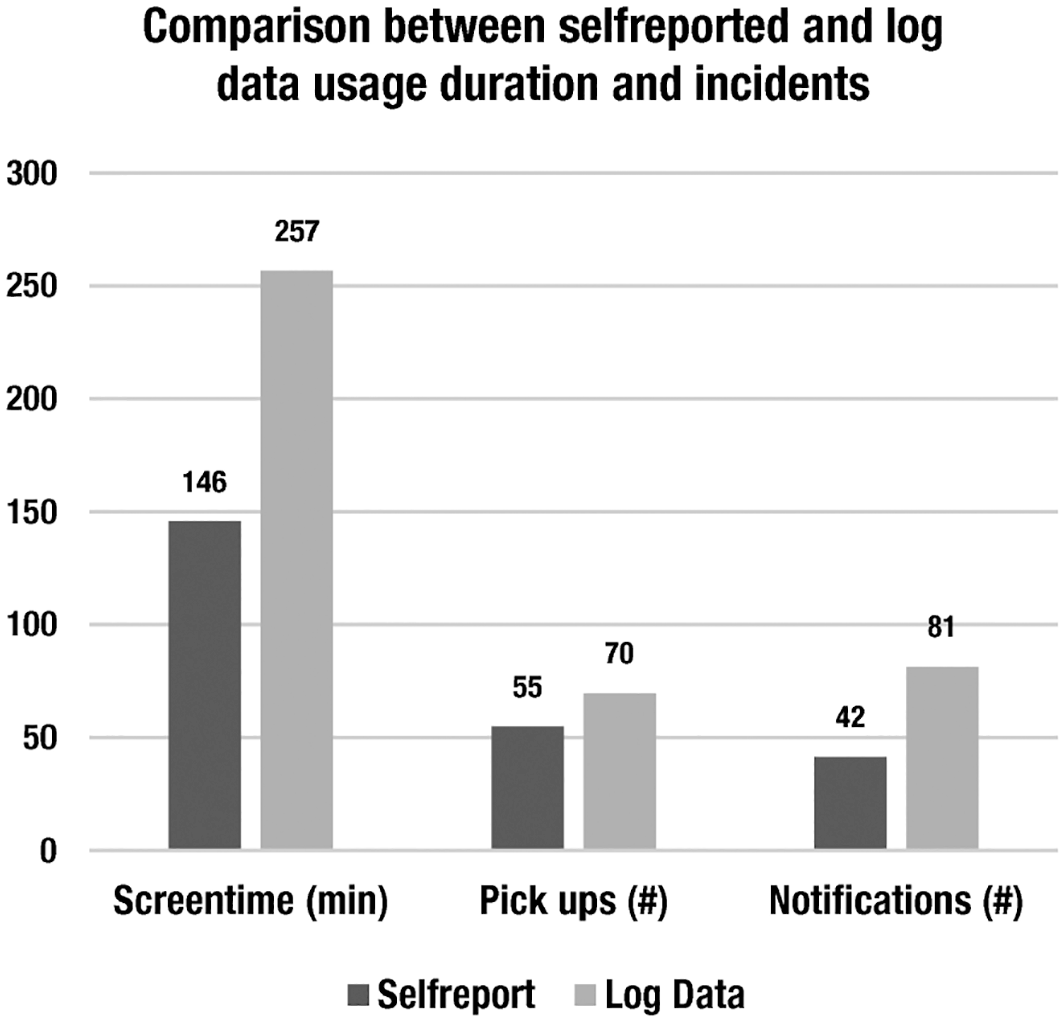
The access to self-reported as well as mobile phone usage log data allowed us to assess the accuracy of self-reports on different levels. Respondents reported an average screen time of 146 minutes, picking up their phone 55 times, and receiving a total of 42 notifications on an average day. The log data showed that, in fact, these individuals used their smartphone 257 minutes a day, picked it up about 70 times, and received around 81 notifications on their smartphone per day (Figure 4). The average absolute error of the reported screen time was 110 minutes. Of the sample, 70% underreported their screen time usage on a smartphone, on average by 125 minutes (SD = 166). In turn, 30% of the sample overreported their screen time usage, on average by 15 minutes (SD = 36). For the number of times people picked up their smartphone, the average absolute error of the reported frequency was 32 notifications, with 84% of the sample underreporting the number of pick-ups, on average by 37, and 16% of the sample overreported this number with an average of five pick-ups on an average day. Lastly, people received almost double the amount of notifications on their smartphones than they actually reported. The average absolute error was 47, whereas respondents on average underreported the number of pick-ups by 58 and overreported it by 11 (see Table 3 for total measures and errors).
Descriptives of mobile self-report and log data.
Comparison Between Self-Reported and Log Data and Error Estimates.
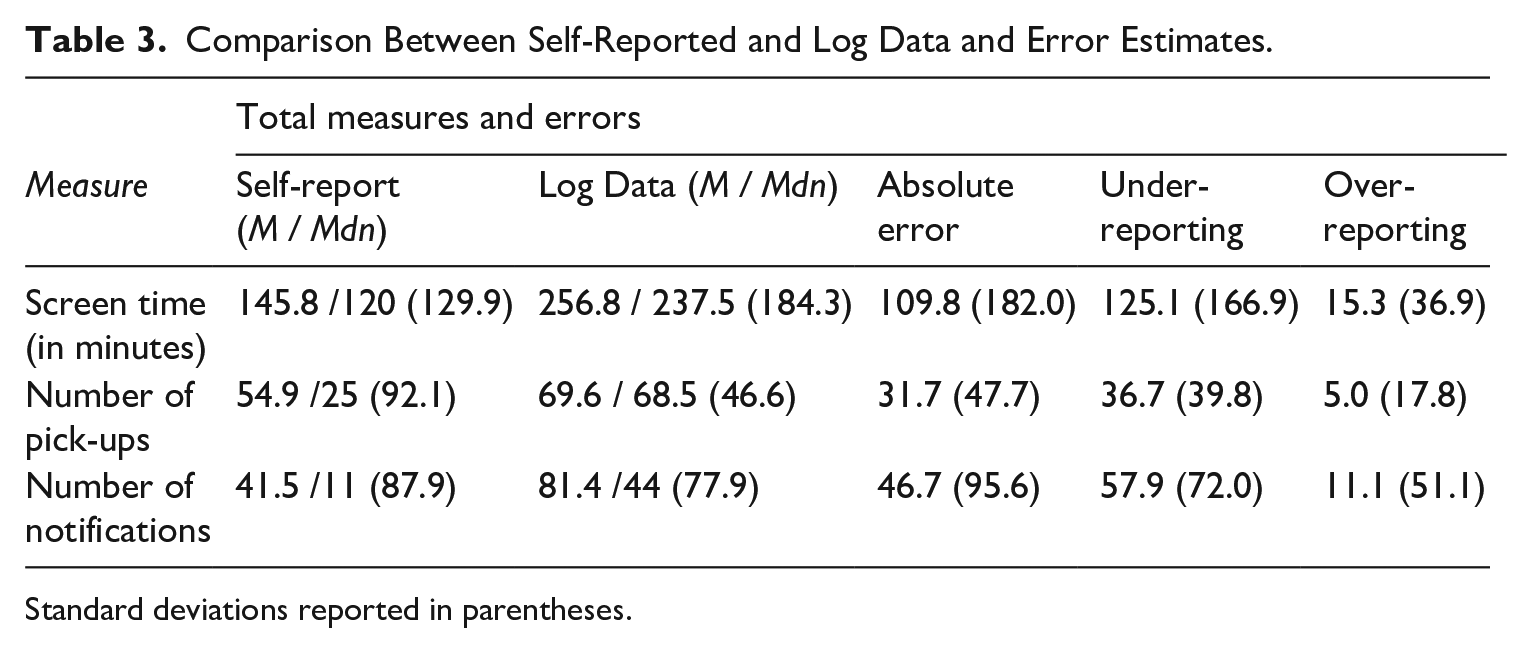
Standard deviations reported in parentheses.
The correlation between the self-reports and log data for screen time, number of pick-ups, and notifications ranged between 0.3 and 0.4 (see Table 4). This suggests low to moderate levels of convergent validity between self-reports and log data for each of the three measures. Overall, we see that across usage categories, respondents were more likely to underreport their smartphone usage, whereas the number of notifications deviates most strongly from log data, followed by the total screen time and total number of pick-ups.
Bivariate Correlations Between Self-Reports and Log Data.
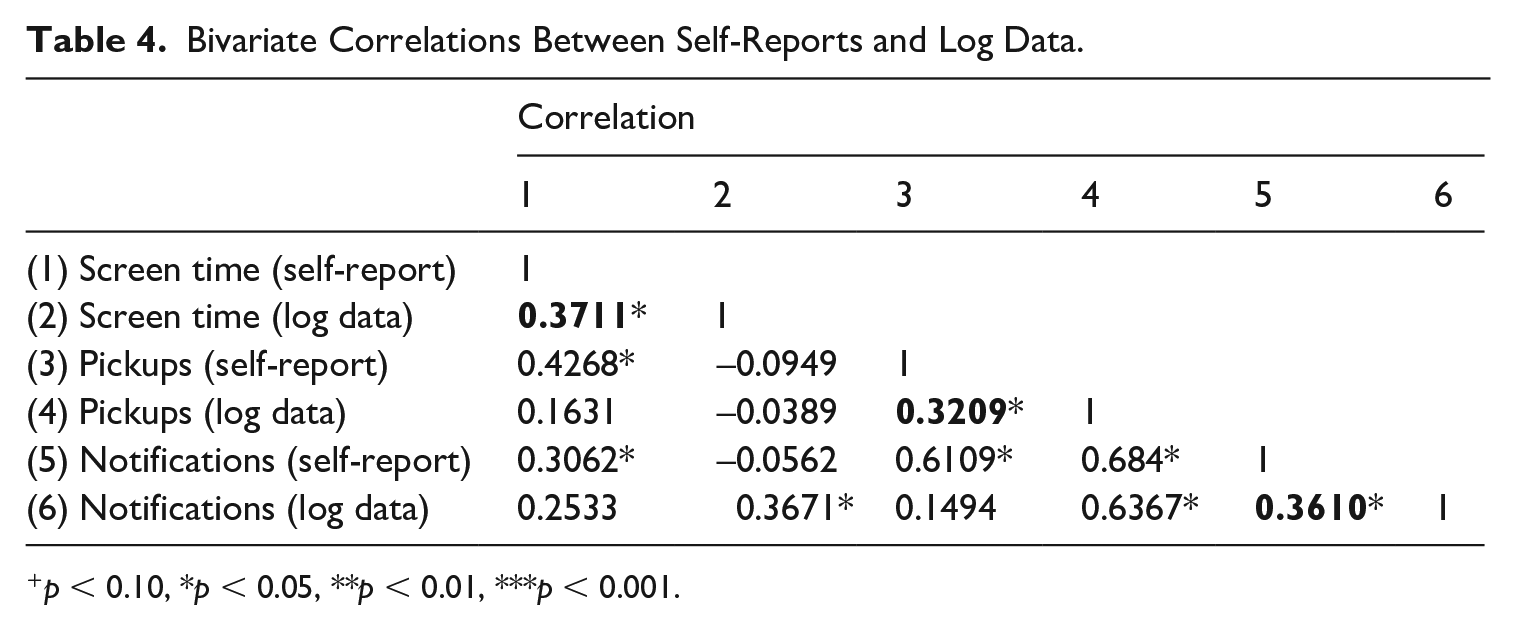
p < 0.10, *p < 0.05, **p < 0.01, ***p < 0.001.
Apps and websites
We were also interested in how accurately people could report on the most-used apps or websites on their smartphone. The answers by participants to open-ended questions were manually checked for spelling errors and abbreviations and matched to information available in the donated log data. When doing so, we did not differentiate between apps and websites used but simply analyzed whether any of the 10 given open answers matched the top 10 of the used apps and websites retrieved from the log data.
The donated log data revealed that the five most used apps and websites on respondents’ iPhones were Safari, WhatsApp, Facebook, Mail, and Instagram. They accounted for roughly one-third of all logged apps and websites used. To answer the question of how accurately people can report their usage of apps and websites, we created a summed score index of the correctly reported apps or websites (coded 0/1) divided by the number of log data that were available for each participant (as not all log data contained a full list of 10 activities). On average, respondents reported about 45% (M = .45, SD =.21, Min = 0, Max = 1) of their most frequently done activities correctly.
Discussion
The current study presents a new methodological approach that relies on data retrieval from the iOS Screen Time function with the help of screenshots. By asking people to donate their mobile log data to researchers, it offers an alternative to the tracking of smartphone usage that is restricted by the walled nature of mobile operating systems, the level of intrusion it presents to the most private device in people’s lives, and the high costs of installing external software. As one of the first studies that assesses mobile data donations, it gives insights into compliance rates and sample biases of such a method. Furthering media exposure research, we used the log data to investigate accuracy of self-reported smartphone usage.
From a sample of Dutch-speaking iPhone users, around 12% donated their log data by uploading the screenshots, whereas initial willingness was much higher with almost three-quarters of people expressing it. Although comparable research in this area is sparse, the compliance rate is similar to what Gower and Moreno (2018) found. The willingness to donate log data in our study, however, is higher than what was reported by Boase and Ling (2013) and Keusch et al. (2019). This means that if the process of data donations can be simplified further, for example by using a dedicated app, it may be possible to increase compliance rates. The finding that privacy literacy mattered most for the decision to donate can help to increase compliance in future studies by presenting the option of “selective donations” to increase users’ agency in deciding which parts of their private data will be donated.
The level of compliance as such is a less decisive issue for mobile donation studies, because upscaling the initial sample can help to increase the final study population. More important, however, is the question of whether biases in the sample arise during the different steps of data collection. By identifying three samples in a data donation process—the entire sample, the collecting sample, and the final donator sample—we find the indication that different steps in the donation procedure introduce deviances between the different populations. Donators show a somewhat higher mobile phone savviness and expressed lower perceived risk of privacy breaches and of data misuse. Furthermore, people who donated their data undertook actions to secure their mobile phone data less frequently compared to the entire sample. However, when tested simultaneously, it is mobile privacy literacy and not perceived risks per se that seems to affect the decision to donate data. Overall, sample biases seem rather marginal, although research to compare these biases against is sparse and the low explained variance of the models suggest that other variables may play a more decisive role in the decision to donate.
This finding has two important implications: first, the donations we collected contained sensitive data, for example, the heavy usage of dating apps such as Tinder or Grindr. Among the 47 donators, three had dating apps listed in the top 10 used apps. This indicates that, despite the fact that people can review their data before donating, they are willing to share sensitive content. Although we cannot say how many participants did not share data because of its sensitive nature, the transparency that data donations offer to users does not prevent them in general to share content, including that of a more private nature, with researchers. Second, perceived privacy risks and skills still seem to have some importance in the decision to donate data. This does not generally speak against the usage of mobile data donations in research fields that rely on sensitive data, but potential deviations due to perceived privacy risks need to be taken into account. In other areas, such as media exposure research, the small biases seem less problematic. However, low willingness of sharing private data may correspond to certain behaviors, for example, the usage of alternative media sources. Future research should determine what other factors prohibit or enhance the donation of data and to what extent the investigated sample biases are problematic for other fields of research.
In line with previous research on Internet (Araujo et al., 2017; Jürgens et al., 2019) and mobile phone usage (Vanden Abeele et al., 2013), we find that self-reports of smartphone usage differs strongly from the retrieved log data. People mostly underreport the duration of usage and frequency of incidents such as checking their phone or receiving push messages. This once again calls for a careful usage of popular self-reported measures, such as average screen time. Compared to previous studies that rather found overreporting of behavioral mobile phone usage measures (Boase & Ling, 2012; Vanden Abeele et al., 2013), we find strong underreporting. The higher ubiquity of smartphones in our lives can be one reason of why our findings differ from data that were collected almost 10 years ago. The fact that screen time, notifications, and pick-ups are more extensive and occur more often, compared to taking a call or sending a message, may also account for this finding. In addition, the incidental nature of checking a phone or receiving notifications may contribute to such an underestimation. By using a similar design, Sewall et al. (2020) find that MTurk users underestimate their daily iPhone usage, which corroborates our findings. Compared to their study, we find even higher levels of underestimation. Reasons for that may be the lower level of screen time in our general population sample, the use of actual log data compared to having participants copy their usage time, and letting respondents estimate minutes of usage, instead of asking for hours and minutes. Ultimately, our measures map the mundane digital media behaviors of participants, where specific activities blur with being constantly online. In this sense, our findings suggest that future digital media research may be more strongly confronted with underestimation rather than overestimation of exposure patterns.
Extending research on smartphone content reporting, we find that people are able to report almost half of their most frequently used apps and websites correctly, when asked about it in an open recall question. This finding extends research by Lee et al. (2017) and Deng et al. (2019) who found contradicting evidence on how accurately people can report what they use their smartphones for, although it corroborates findings from de Reuver and Bouwman (2015), who found that respondents can report smartphone usage categories rather accurately. Most of our users reported the “big five” apps—WhatsApp, Facebook, Instagram, Google, and Mail—which may explain the relatively high level of accurate reporting. This suggests self-reports can work well when researchers are interested in very prominently used apps and websites, such as social media platforms. Few of the participants reported the mobile web browser they use, but rather mentioned frequently used websites among the top 10 activities. Given the different functions a browser can have, future research should specify in surveys whether they want to estimate the general browser usage or ask respondents upfront to report specific websites as a way to unpack the “black box” of such activities.
Although log data seem to produce more precise measures, in other areas they are also limited. The iOS Screen Time function presents a lack of depth for content-related usage patterns. This limits the application of log data in mobile communication research. In a preliminary evaluation where we used news consumption as a test case, we found that none of the OS-predefined categories had actionable information on how often people used their smartphones to access news. When looking at the most used apps and websites, however, it is possible to receive more detailed information about the content used. An initial assessment showed that 10% of the 10 most-used apps and websites in our donator sample were related to news use, with the duration of news-related usage episodes adding up to more than 3 hours a week. These preliminary numbers illustrate that despite the restriction of pre-defined OS categories, mobile log data can provide an insight into an individual’s use of content on smartphones. This, however, requires additional (manual) coding.
Looking at this from a critical perspective, the restriction of the iOS predefined categories means we are either left with inaccurate self-reports or superficial log data. On a more positive note, however, we can argue that probing log data further allows for more detailed insights. Defining categories manually based on the most frequently used apps is an example of how to arrive at more telling measures. Furthermore, the Screen Time iOS feature provides additional information that may bring further insight into mobile device usage, such as from which apps users receive notifications most often. Although these measures are far from ready to use, they can be crucial and telling in many research contexts.
Limitations and next steps
Adopting innovative research designs also tends to bring some limitations, as is the case with the present study. As this was a first attempt, we rely on a rather small and non-representative sample of users that do not fully resemble more general population characteristics. However, compared to previous studies in this topic—which tend to rely on student samples—our sample had greater variation on age, location, and educational background. Second, the current study focuses only on iOS users, because the Digital Wellbeing function on Android devices was not fully rolled out in the Netherlands at the time of data collection. Although our approach is potentially applicable across different devices and operating systems, the focus on one mobile operating system (iOS) limits the explanatory power of our results. Future research should therefore assess the potential of mobile data donations across different operating systems.
Third, the analysis of screenshots was challenging. In this study, we relied on manual extraction of data from screenshots because the automated picture processing framework we tested internally relying on computer vision still had limits. Although the automated extraction of average screen time and frequency of durations and pick-ups returned valid results, we could not yet use it for the content-related data. Here, especially the non-systematic way in which people tend to take the screenshots presents a challenge. In future attempts, we will extend this functionality with the goal of waiving manual processing completely. Lastly, we rely on the output of the iOS Screen Time function and not actual log data. Using this type of third-party material in research bears the risk of inaccuracy in this type of data as well. Validating these measures, for example with specifically prepared phones that make actual log data available to researcher or data from telecommunication operators, can be another alley for future research.
Conclusion
Our study shows that using mobile data donations has great potential for communication research, already at this early point in time. Data donations are a rather new phenomenon in exposure research, amplified through transparency measures built to increase digital well-being or data autonomy. If donations become a more popular practice of data collection, we may see even higher compliance rates and potentially lower sample biases. Furthermore, research should (and likely will) become smarter in collecting and merging assessed data, for example through data collection in self-developed apps (Ohme et al., 2016). Our finding that neither self-reports nor log data solely give us accurate and complete insights in smartphone exposure calls for a stronger combination of both types of data sources in future communication research. Smartphones nowadays play an important role in most people’s lives. Although not perfect, receiving detailed insights through mobile data donations about the usage of such devices presents a promising pathway forward for mobile communication research.
Footnotes
Acknowledgements
This study was funded by the Research Priority Area Communication and its Digital Communication Methods Lab at the University of Amsterdam. We thank our research assistant Tom Hackenberg for his contribution in data processing and coding.
Funding
The author(s) received no financial support for the research, authorship, and/or publication of this article.