
Abstract
Introduction:
The blood culture positivity rate in the emergency department (ED) is <20%; however, the mortality associated with Community-acquired bacteraemia (CAB) is as high as 37.8%. For this reason, several models have been developed to predict blood culture positivity for the diagnosis of CAB.
Objective:
To validate two bacteraemia prediction models in a high-complexity hospital in Colombia.
Design:
External validation study of the ID-BactER and Shapiro scores based on a consecutive cohort of patients who underwent blood culture within 48 h of ED admission.
Methods:
Scale calibration was assessed by comparing expected and observed events (calibration belt). Discriminatory ability was assessed by area under the ROC curve (AUC-ROC).
Results:
We included 1347 patients, of whom 18.85% were diagnosed with CAB. The most common focus of infection was the respiratory tract (36.23%), and the most common microorganism was Escherichia coli (52.15%). The Shapiro score underestimated the risk in all categories and its discriminatory ability was poor (AUC 0.68 CI 95% 0.64–0.73). In contrast, the ID-BactER score showed an adequate observed/expected event ratio of 1.07 (CI 0.85–1.36; p = 0.018) and adequate calibration when expected events were greater than 20%, in addition to good discriminatory ability (AUC 0.74 95% CI 0.70–0.78).
Conclusion:
The Shapiro score is not calibrated, and its discriminatory ability is poor. ID-BactER has an adequate calibration when the expected events are higher than 20%. Limiting blood culture collection to patients with an ID-BactER score ⩾4 could reduce unnecessary blood culture collection and thus health care costs.
Introduction
Community-acquired bacteraemia (CAB) is a common emergency department (ED) presentation with an incidence of 113–204 per 100,000 population in North America and Europe, similar to stroke or thromboembolic events.1–3 It is also associated with high mortality, ranging from 12% to 34% (depending on aetiology, comorbidities and antibiotic resistance),4,5 and reaching up to 80% if treatment is not appropriate. Given the above, early detection of this condition is essential.6,7
However, physicians have a poor ability to identify CAB,8,9 resulting in indiscriminate ordering of blood cultures, with a reported positivity rate of <10% in the emergency department. 10 Of those that are positive, <1% lead to changes in patient management, 11 resulting in increased hospital costs. 12
In addition, on average 20%–30% of blood cultures are false positives generating exposure to antibiotics with adverse effects such as nephrotoxicity or Clostridioides difficile infection. This augments healthcare costs up to $925 per patient with false positive blood cultures. 12
To improve the positivity rate of blood cultures, several predictive models have been developed. For example, Pfitzenmeyer et al. 13 developed a model that is useful only for elderly patients, Bates et al. 14 for hospitalized patients, and Tokuda et al. 15 for febrile patients. Similarly, there are specific models for pyelonephritis, soft tissue infection, or pneumonia developed by Kim et al., 16 Jorgensen et al., 17 and Lee et al.,18,19 respectively. Finally, there are models that use procalcitonin, variables that are not routinely used, such as the 5MPB-Toledo, 20 MPB-INFURG-SEMES 21 models and the models created by Su et al. 22 and Tudela et al. 23
The Shapiro scales 24 and ID-BactER 10 are two prediction models that, contrary to the previously mentioned, are characterized by the use of clinical and routine paraclinical variables, and were developed in the ED to discriminate patients in whom CAB will be identified. In the case of Shapiro, a model based on low risk, moderate risk and high risk was proposed, whereas in the ID-BactER model, five different groups were established (Supplemental Table 1). The AUC-ROC reported for the two models was 0.8, slightly lower than that reported for other models,20,21 but with the advantage that they do not require the measurement of procalcitonin or other variables that are not routinely used or available in all hospitals.
The aim of this study is to validate the Shapiro and ID-BactER prediction models, 25 by evaluating their ability to identify patients with CAB and their calibration, in a cohort of patients treated in the ED of a high-complexity hospital in Bogota, Colombia.
Materials and methods
We conducted an observational analytic study for the external validation of a prediction score based on a historical cohort. Data collected on electronic medical records of patients over 18 years of age who were admitted to the ED of the Hospital Universitario San Ignacio, Bogotá (Colombia) between 1 September 2020 and 31 December 2021 and who had blood cultures taken during the first 48 h of hospitalization were considered. Exclusion criteria included admission to a healthcare facility in the 7 days prior to admission to the ED, referral to another facility, or lack of the variables (Supplemental Table 1) needed to calculate the predictive models.
All patients who had blood cultures taken within 48 h of admission were identified from a clinical laboratory database that systematically records all blood cultures taken in the institution. The RedCap (Research Electronic Data Capture) platform was used to systematically and anonymously record the information using standardized formats. 26 A first assessor was responsible for recording the sociodemographic, clinical and paraclinical variables of the patients at the time of blood culture collection (age, sex, comorbidities, symptoms, suspected infectious focus, vital signs, blood count, creatinine and C-reactive protein), from which the results of the Shapiro and ID-BactER prediction models were automatically calculated (Supplemental Table 1). Length of hospital stay and in-hospital mortality were also recorded. A second adjudicator, unaware of the risk stratification, determined the presence or absence of the outcome (bacteraemia) and recorded the microbiological characteristics (Gram stain, isolated germ and sensitivity profile) in those who presented with bacteraemia.
True bacteraemia and false bacteraemia were defined according to the bacteraemia guidelines of the Spanish Society of Infectious Diseases and Clinical Microbiology (SEIMC). We considered true bacteraemia as the growth of a non-contaminating microorganism in only one blood culture or of a potentially contaminating microorganism in at least two blood cultures, on the other side false bacteraemia was defined as the growth of a potentially contaminating microorganism in only one blood culture. 27 Calculation of the Shapiro and ID-BactER prediction models to determine the risk of developing bacteraemia was performed using the operational definitions of the variables used in their original studies (Supplemental Table 1).10,24
Statistical analysis
Sample size was calculated based on the results of the Collins study for external validation of prognostic models, which suggests a minimum of 100 outcomes or preferably 200 or more outcomes. 28 Assuming an expected CAB rate of 15%, the required sample size was 1330 patients.
Qualitative variables were expressed as absolute frequencies and percentages; quantitative variables were expressed as mean and standard deviation or median and interquartile range, depending on whether the normality assumption determined by the Shapiro–Wilk test was met or not.
External validation of the prediction models was performed by assessing their calibration and discriminatory ability. To assess calibration, understood as the relationship between observed and expected events, patients were divided into risk groups according to the Shapiro and ID-BactER model, the number of expected events was determined by multiplying the expected proportion for each risk group by the number of patients in each group, and this was compared with the observed events. The equivalence hypothesis was assessed using the Hosmer–Lemeshow test 25 and a graphical analysis was performed using a calibration belt with 80% and 95% confidence intervals, the latter allowing visual inspection of the calibration deviation. Finally, a calibration test was performed to evaluate whether the deviation of the bisector (perfect calibration line of 45°) was significant.25,29,30 On the other hand, the discriminatory ability, understood as the ability to assign a higher risk to those who will have a positive outcome than to those who will not, was evaluated by means of a ROC curve and the calculation of the C-statistic of the area under the curve. 25 It was considered adequate when the C-statistic was close to 0.8, consistent with the discriminatory ability reported in the original studies.10,24 The Stata program (Stata Statistical Software: Release 16, StataCorp LP, College Station, TX, USA) was used for statistical analysis.
Results
One thousand seven hundred forty-four patients met the inclusion criteria and 370 were excluded, leaving a total of 1374 patients for analysis; reasons for exclusion are shown in Figure 1. Shapiro score was validated in the total population. Since the ID-BactER scale requires the C-reactive protein (CRP) result to be calculated, only patients with data available on CRP values were included for its validation (n = 893).

Flowchart of the selection process for patients included in the validation of the Shapiro and ID-BactER models. Reasons for exclusion are shown.
In the total population, the majority were male (52.26%). The most common comorbidities were cancer (32.96%) and arterial hypertension (32.89%). The principal infectious foci were respiratory (36.23%) and urinary (25.09%). At the time of blood culture, 50.48% of patients were tachycardic, 55.61% had leukocytosis or leukopenia and only 20.34% were febrile. The complete description of the patient’s characteristics is shown in Table 1. The characteristics of the subgroup of patients in which the ID-BactER score was validated were similar, except for a higher proportion of patients with respiratory infections (36.2% vs 49.5%; p < 0.001).
Characteristics of patients in whom a blood culture was taken within 48 h of their admission to the emergency department.

COPD, chronic obstructive pulmonary disease; HIV, human immunodeficiency virus; IQR, interquartile range; n, Total number of patients, (%), percentage of patients, .
This is a subgroup of the total population that had C-reactive protein results available.
Among the patients in whom the Shapiro score was calculated, bacteraemia was found in 254 patients (18.85%) and the all-cause mortality was 18.56%. In the case of ID-BactER, these results were 152 CAB cases (17.02%) and 21.05% mortality events. False bacteraemia was found in 24 patients (1.74%).
The five main microorganisms identified in the entire study population were Escherichia coli (52.15%), Klebsiella pneumoniae (9.35%), Staphylococcus aureus (7.91%), Streptococcus non-S. pneumoniae (5.75%) and finally Pseudomonas aeruginosa (4.31%), all isolates are listed in Supplementary Table 2.
The calibration of the Shapiro scale is shown in Table 2. Most patients were classified in the low-risk group (46.92%). Our data show that globally the observed events are significantly higher than expected events (observed/expected ratio 3.34; 95% CI 2.57–4.37). It was true also in each risk category with observed/expected ratios between 1.6 and 15.3 and higher underestimation in low-risk category. Hosmer–Lemeshow test showed that the score is not calibrated in the population (HL 18.6, p < 0.0001). Figure 2 shows the calibration belt, which evaluates graphically the relationship between expected and observed events and shows again an underestimation of risk in all categories. The output of the calibration test suggests that the fitted model is not well calibrated in the validation sample. The p-value was extremely small (<0.001), which rejects the hypothesis of satisfactory fit even with very conservative significance levels.
Calibration of Shapiro scale for predicting community-acquired bacteraemia.
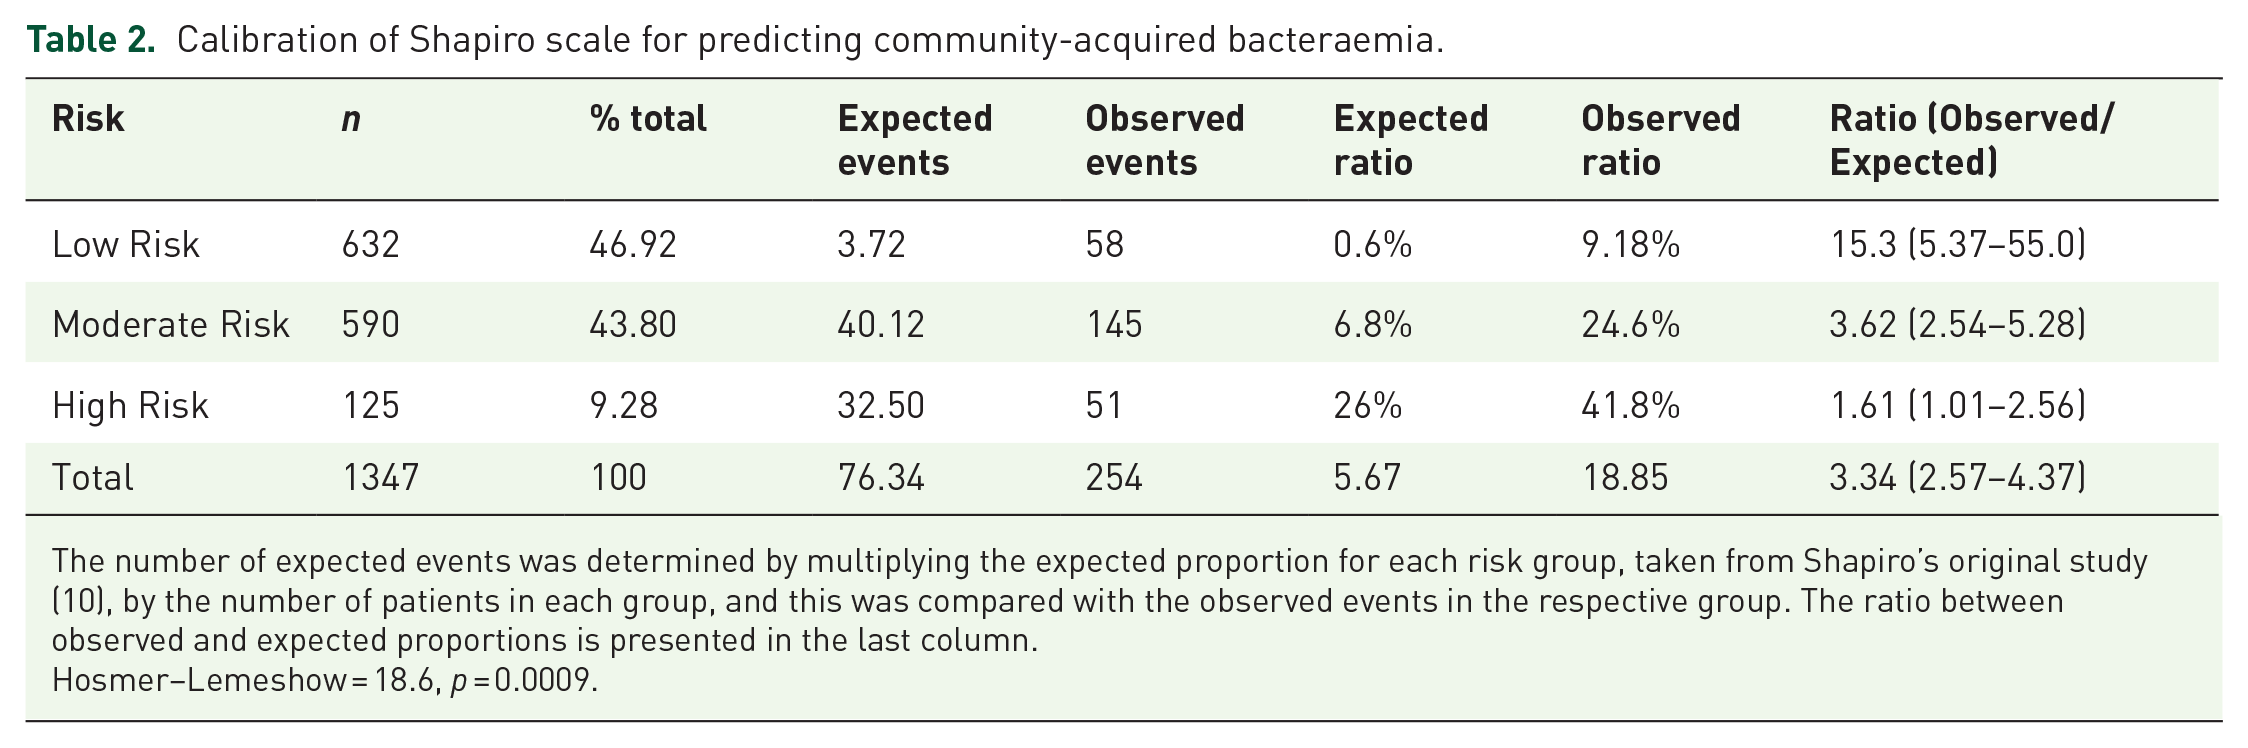
The number of expected events was determined by multiplying the expected proportion for each risk group, taken from Shapiro’s original study (10), by the number of patients in each group, and this was compared with the observed events in the respective group. The ratio between observed and expected proportions is presented in the last column.
Hosmer–Lemeshow = 18.6, p = 0.0009.

Calibration of the Shapiro scale for prediction of bacteraemia. Calibration belt showing deviations from the bisector (45° line of perfect fit) at the 80% (inner belt: light grey area) and 95% (outer belt: dark grey area) confidence levels.
Table 3 shows the calibration of the ID-BactER scale. Most patients scored between 2 and 3 points (43.45%). Different from the observed Shapiro scale, the number of observed events compared to expected events was similar globally (observed/expected ratio 1.07; 95% CI 0.85–1.36), and in each risk category with scores of ID-BactER > 4, the observed/expected ratios was between 0.84 and 1.04. Hosmer–Lemeshow test showed that the score is calibrated (HL 3.85, p = 0.57). Figure 3 shows the calibration belt, where it can be observed that the model calibration tends to be inadequate only when the expected events are less than 20% (ID-BactER score < 4 points), slightly underestimating the risk.
Calibration of ID-BactER scale for predicting community-acquired bacteraemia.

The number of expected events was determined by multiplying the expected proportion for each risk group, taken from Takeshima’s original study (10), by the number of patients in each group, and this was compared with the observed events in the respective group. The ratio between observed and expected proportions is presented in the last column.
Hosmer–Lemeshow = 3.85 p = 0.57.

Calibration of the ID-BactER scale for prediction of bacteraemia. Calibration belt showing deviations from the bisector (45° line of perfect fit) at the 80% (inner belt: light grey area) and 95% (outer belt: dark grey area) confidence levels.
Similarly, the discriminative ability of the ID-BactER scale (AUC-ROC of 0.74 (95% CI 0.70–0.78)) was superior to the Shapiro scale (AUC-ROC of 0.68 (95% CI 0.64–0.73)) for predicting community-acquired bacteraemia (Figure 4).

Discriminatory ability of the Shapiro and ID-BactER scales for predicting bacteraemia. The area under the receiver operating characteristic curve and its confidence interval are shown.
Discussion
Our study shows that between the Shapiro and ID-BactER bacteraemia prediction models, only the ID-BactER model has an adequate calibration, especially when the risk of bacteraemia is higher than 20%. It also has good discriminatory ability, although it is slightly lower than that reported in the original study that developed the model. 10
The demographic characteristics of our population are similar to those in the studies that originally created the Shapiro and ID-BactER models, however, a higher prevalence of cancer in our study population is striking. Blood culture positivity was 18.8%, which is higher than the findings in the original studies by Shapiro 24 and ID-BactER 10 (8.3% and 15.9%, respectively). This may be related to the higher prevalence of cancer mentioned above, as the prevalence of bacteraemia is higher in these patients, reaching up to 38%. 31 Similarly, the use of automated incubation and detection systems for identifying bacteraemia available in modern laboratories 32 may explain the differences when compared with the techniques available at the time of the Shapiro study (2000 and 2001) and ID-BactER (2011 and 2012).
Only 20% of the patients were febrile at the time of blood culture, an expected finding considering the described operational limitations of this sign as a predictor of bacteraemia.33,34 More than half of our patients presented with tachycardia, leukocytosis or leukopenia a finding that is consistent with previous studies which have demonstrated the utility of the presence of systemic inflammatory response syndrome in predicting the presence of bacteraemia.35,36
In our study, E. coli, K. pneumoniae and S. aureus were the three most common bacteria isolated, a result not different from that reported in the SENTRY registry, which collects information from more than 200 centres in 45 different countries. 37 It is noteworthy that P. aeruginosa was the fourth most common isolate, because although it is not a common germ in CAB, 38 its frequency increases in immunosuppressed patients, such as cancer patients, 39 who make up almost a third of our population.
Our main finding was that the calibration of the Shapiro scale is inadequate because it underestimates the risk of CAB, whereas the calibration of ID-BactER is adequate. Other studies have attempted to validate the Shapiro model. Of those only Hodgson et al. evaluated the calibration, which was adequate; however, this study, unlike ours, validates the model with only 100 outcomes and has a lower cancer prevalence than ours (28% vs 33%), which could explain the difference with our results. 40
No previous validation studies of the ID-BactER model were found, ours being the first reported. The better fit of the ID-BactER model to our population could be due to the similarities in blood culture positivity, patient comorbidities and infectious focus mentioned above.
The discriminatory ability of the Shapiro and ID-BactER models was lower than that reported in the studies that originally created the Shapiro and ID-BactER models. The AUC-ROC found in other validation studies of the Shapiro model ranged from 0.71 to 0.8,40–44 similar to that found in the present study. Differences in the characteristics of the populations studied may explain these small differences.
Given that the blood culture positivity in our population without the use of predictive models is close to 20%, the greatest utility of the scales is related to the identification of patients at higher risk than this. In the case of ID-BactER, its calibration in our population is sufficient with risks >20%, which corresponds to a score >3. Thus, it can be suggested to take blood cultures in the ED when the score is ⩾4. Conversely, in patients whose initial clinical characteristics do not reach this threshold, it may be advisable to await the results of the initial blood tests before determining the necessity of blood cultures. This approach could potentially reduce the number of unnecessary blood cultures and the associated financial burden of positive but contaminated blood cultures, thereby improving the efficiency and cost-effectiveness of healthcare expenditure.
There are several models for predicting bacteraemia in the ED, but few have an AUC higher than Shapiro and ID-BactER models (AUC > 0.8). Examples include the widely validated 5MPB-Toledo and MPB-INFURG-SEMES models by the group of Jimenez et al.20,21 and the more recent model by Han et al. 45 However, these involve the use of procalcitonin, a paraclinical test that is not routinely used and is not widely recommended by clinical practice guidelines, as is the case with the most recent American Thoracic Society pneumonia guidelines. 46
The model of Tokuda et al. 15 has an AUC higher than 0.8 but was designed exclusively in febrile patients, which, as we have already mentioned, is not a variable consistently associated with the presence of bacteraemia, which would limit its use.
Among the strengths of our study, we highlight the review of all blood cultures taken during the time evaluated in the cohort, without limiting it to critical patients, which allows a greater reproducibility in the ED population. Furthermore, to our knowledge, this is the first external validation study of the ID-BactER model and the first to validate the Shapiro model in a Latin American population which may impact future medical conduct related to the detection of CAB in our region. Finally, the number of outcomes evaluated in this study is higher than in most external validation studies of Shapiro.40,42–44
Limitations include this is a study based on a single highly complex centre, meaning that the external validity of our results could be different in different settings with a less comorbid population, further studies including multiple centres are needed to confirm our results. In addition, the present study took place during the SARS-COV-2 pandemic, which may have affected the cohort in terms of variables such as increased respiratory focus; however, this was also the main foci in the other studies that validated the Shapiro model41,42,44 and the ID-BactER modelling study. 10 With respect to the potential impact of the loss of 18 patients to follow-up, a sensitivity analysis was conducted that considered these lost cases as events and did not show a change in the conclusions of the study. Although the ID-BactER model was validated with a different number of events than the Shapiro model (152 vs 254), in both scenarios the minimum of 100 results required by the methodology is met. According to the results of the Collins study, for adequate external validation of prediction models, it is preferable to have 200 or more results, but it is only when there are fewer than 100 results that the risk of inaccurate estimation of true performance is greater. 28
Conclusion
The Shapiro score is not calibrated, and its discriminatory power is poor, whereas the ID-BactER score has an adequate calibration when the expected events are greater than 20%. Limiting blood culture collection to patients with an ID-BactER score ⩾4 could reduce unnecessary blood culture collection and thus health care costs.
Supplemental Material
sj-docx-1-tai-10.1177_20499361241304508 – Supplemental material for External validation of ID-BactER and Shapiro scores for predicting bacteraemia in the emergency department
Supplemental material, sj-docx-1-tai-10.1177_20499361241304508 for External validation of ID-BactER and Shapiro scores for predicting bacteraemia in the emergency department by Sebastián Quintero Montealegre, Andrés Felipe Flórez Monroy, Javier Ricardo Garzón Herazo, Wilfran Perez Mendez, Natalia María Piraquive, Gloria Cortes Fraile and Oscar Mauricio Muñoz Velandia in Therapeutic Advances in Infectious Disease
Footnotes
References
Supplementary Material
Please find the following supplemental material available below.
For Open Access articles published under a Creative Commons License, all supplemental material carries the same license as the article it is associated with.
For non-Open Access articles published, all supplemental material carries a non-exclusive license, and permission requests for re-use of supplemental material or any part of supplemental material shall be sent directly to the copyright owner as specified in the copyright notice associated with the article.