
Abstract
Background:
Understanding the correlation between the methods of monitoring surface cleaning and disinfection (SCD) is fundamental for better infection control.
Purpose:
This study aims to correlate the SCD monitoring methods in a Brazilian pediatric unit. This is an exploratory, longitudinal, and correlational study.
Methods:
The study was conducted in a pediatric hospitalization unit of a medium-sized hospital from December 2020 to March 2021. Four high-contact surfaces were analyzed before and after the cleaning and disinfection process by means of visual inspection, quantification of adenosine triphosphate (ATP), and colony-forming unit (CFU) count. The study consisted of three stages: stage I involving situational diagnosis of the SCD process; stage II referring to the implementation of the Surface Cleaning and Disinfection Standardization Program (SCDSP); and stage III involving long-term assessment after implementing the program. A total of 192 assessments were performed in each stage, totaling 576 in the three study stages.
Conclusions:
A significant correlation was found between the ATP quantification methods and microbial count in the bed railing (p = 0.009) and companion’s armchair (p = 0.018) surfaces. In both cases, Spearman’s correlation coefficients were positive, indicating a positive correlation between ATP and microbial count scores, that is, the higher the ATP values (in RLUs), the greater the microbial counts (in CFUs/cm2). The analysis of the ROC curves suggests that the surfaces presenting ATP below 108 RLUs can be considered approved. The ATP method yielded 78.6% sensitivity; in turn, microbial count presented a sensitivity of 85.7%. It is important to use different methods to monitor the cleaning and disinfection of surfaces, as each one has different sensitivity and specificity.
Background
The literature shows that environmental contamination favors dissemination of microorganisms both to patients and to other surfaces, through cross-contamination.1,2 The spread of healthcare-associated infections (HAIs) is triggered by several aspects, among them are mainly failures in the aseptic techniques used by health workers.3–5 Through hygiene management programs, it is possible to prevent from 20% to 30% of the HAIs. Even the health team’s own movements influence the speed and concentration of particles close to the patient. 6
It is to be noted that some research studies reported that environmental contamination is one of the responsible agents for the spread of pathogens, even of severe acute respiratory syndrome coronavirus 2 (SARS-CoV-2). 7
Environmental cleaning and disinfection (C&D) increases the control rates corresponding to the spread of microorganisms. Hygiene and cleaning interventions in the environment of the health services must be integrated into the control programs, and the characteristics of each surface must also be considered for adequate C&D.8–10
Therefore, monitoring and supervision of surface C&D (SCD) are measures with the perspective of examining effectiveness of the process, ensuring tolerable cleaning standards. 10 It is indispensable to be concerned about the methods to assess the efficiency of C&D. Some of the monitoring methods are the following: visual inspection, adenosine triphosphate (ATP), and colony-forming unit (CFU) count. 11
The visual inspection is the most economical method to assess C&D monitoring. It consists of seeing with your own eyes, without the aid of any instrument. It is easy to conduct because it does not need very elaborated materials and can be applied by the entire team; however, it presents the disadvantage of not assessing biological risk.12–14
ATP amount measurement is a dynamic method to verify C&D. 15 With this, the method has recently gained more space because of clarity in relation to the provision of quantitative data. It enables fast results and ability to quickly improve the C&D techniques. The disadvantage in using the method is that it finds a huge variety of reference values and that it is expensive.9–14
Considered as a monitoring ‘gold standard’ for the detection of microorganisms, the method to assess microbiological cultures does not provide immediate data. The readings of the contact plates or Rodac plates are stored in incubators at 37°C and the readings are carried out in 24–48 h using a stereomicroscope under reflected light. In addition to time, laboratory use and higher financial expenditures are necessary.12,13,16
In view of the above, it is of fundamental relevance to correlate the methods of monitoring SCD, especially in pediatric inpatient units, a setting where few studies on the theme are found, especially during the COVID-19 pandemic. The purpose of this study was to correlate the SCD monitoring methods in a pediatric unit.
Method
Type of study, locus, and period
An exploratory, longitudinal, and correlational study was conducted in a pediatric hospitalization unit of a municipality from the east coast of state of Mato Grosso do Sul. The institution is a reference for 10 municipalities, offering 188 beds, of which 60% are for Unified Health System (from Portuguese Sistema Único de Saúde, SUS) patients. Data collection was carried out from December 2020 to March 2021, in the mornings from 6 a.m. to 11 a.m. and by a single researcher.
The institution’s standard protocol
When observing the practice of the C&D process, a mean time of around 40–60 min is verified, generally performed by professionals from the cleaning and nursing teams. The institution uses the Standard Operating Procedure (SOP), with approval on 3 May 2019, shared between the three units (medical clinic, surgical clinic, and pediatric inpatient unit). Also, according to the SOP, the surfaces must be cleaned with soap and water, using a cloth moistened with the Peroxy 4D intermediate-level disinfectant and the Nippo Bac Plus high-level hospital disinfectant (intended for the disinfection of floors, walls, furniture and fixed surfaces in general). Nippo Bac Plus has proven efficacy against the following strains: Pseudomonas aeruginosa, Staphylococcus aureus, and Salmonella choleraesuis.
Study protocol
To choose the rooms and surfaces evaluated, the environments that had the greatest flow and contact of people were observed, adopting the nonprobabilistic intentional sample, in which the researcher defines which parameters he will adopt considering the purpose of his study.9–13 Thus, to monitor the four surfaces, the selection criterion chosen was those with more contact frequency, as they present higher contamination risk.17,18 The surfaces chosen were the following: internal door handle of the patient’s bathroom, armchair in the patient’s room, side railing of the patient’s bed, and flush trigger in the patient’s bathroom.
Currently, the institution where the study was carried out has a single SOP for all inpatient units (clinical, surgical, predelivery, rooming-in, and pediatrics), to guide the hospital hygiene service. The last review/approval of the institution’s C&D SOPs was carried out on 3 May 2019. The estimated time for cleaning surfaces, including terminal and concurrent cleaning, can vary between 40 and 60 min when this is carried out for up to two cleaning staff.
According to information from the SOP, surfaces are cleaned with soap and water, and using a damp cloth containing intermediate-level disinfectant and high-performance Peroxy 4D deodorant. Intended for disinfecting floors, walls, furniture, and fixed surfaces in general, Nippo Bac Plus has proven effectiveness against strains of P. aeruginosa, Staphylococcus aureus, and Salmonella choleraesuis, serving all hospital areas for surface disinfection, except for the nutrition and dietetic.
During this stage, the practices used by the team to carry out C&D were observed, from the use of protocols, products, frequency, time, and friction. The surfaces were monitored using three monitoring methods (visual inspection, CFU, and ATP count).9–13
During this stage, the professionals who perform the SCD were not informed of the real objective of the study to avoid the Hawthorne effect, that is, so that professionals do not change their practices because they are being observed.9,11,12 If asked by any participant, they were informed that it was an evaluation of the sanitizers used.
The collections took place 10 min after the hygiene and cleaning team carried out the process; this time was established according to the manufacturer’s instructions.9,12 Data collection was also standardized, conducted in three stages: (1) Situational diagnosis of the SCD process; (2) Implementation of the Surface Cleaning and Disinfection Standardization Program (SCDSP); and (3) Long-term assessment after implementing the program. In all the aforementioned stages, the four surfaces were monitored in relation to the visual inspection, CFU count, and ATP measurement.10–13
They were collected for 3 months, twice a week, four samples before and four samples after the C&D process carried out by the team, totaling 192 assessments per phase and totaling 576 assessments (Chart 1).
Number of assessments conducted by the method in each stage of the study.

Três Lagoas, MS, Brazil, 2020/2021.
ATP, adenosine triphosphate; CFU, colony forming unit.
Monitoring parameter adopted
As a parameter for evaluating the visual inspection, the variables inspected were presence of stains, scratches, defects in the structure, dust, fingerprints, organic matter, and humidity. Through a checklist previously prepared by the researchers, if the surface presented any of these variables, it was considered disapproved, criteria widely used in the literature.10–13,19,20 It is important to highlight that visual inspection is widely used by services as a monitoring method and even guided by the National Health Surveillance Agency (ANVISA). 21 The entire data collection process was performed by a single researcher to standardize the evaluation process.
Regarding the CFU assessment, plates with more than 2.5 CFUs were considered unsatisfactory. Monitoring was performed with Rodac plate contact plates (Petri dishes), consisting of tryptone soy agar (24 cm2), with a total capacity varying between 15 and 20 ml. Those plates were pressed against the surface for 10 s without any lateral movement. The plates were taken to an incubator at 37°C for 2 days to read the CFUs, 22 and readings were taken after 48 h. 23 It occurred through the electronic and digital colony counter (Logen LS6000) allowing assistance in reading the CFUs. The literature shows several studies proposing the value of less than 2.5 CFU/cm to consider a clean surface.11,12,19
For the ATP assessment, the surface was considered as failing when it had more than 250 relative light units (RLUs). The bioluminescence technique was used, with a 3M Luminometer device (Clean-Trace ATP System), which makes it possible to read the swab through the luciferin-luciferase-based enzymatic complex, which triggers a reaction that produces RLU, allowing to identify the presence of organic matter on the surface.15,19,24,25
Statistical analysis
Fisher’s exact test was used expecting to notice differences between two proportions in relation to the visual inspection. In turn, to observe the possible correlations between the continuous variables (CFU and ATP), it was decided to use Spearman’s correlation test. Finally, to verify which quantitative method developed the best effectiveness, considering CFU as the gold standard, the receiver operating characteristic (ROC) curve was used.
Ethical procedures
This research followed all the ethical precepts of research studies involving human beings, was approved by the Human Research Ethics Committee of the Federal University of Mato Grosso do Sul, Brazil (CAAE: 29350219.8.0000.0021), and followed the guidelines set forth in resolutions no. 466/12 and no. 510/16 of the National Health Council (Conselho Nacional de Saúde, CNS), which guide the ethical principles of research studies conducted with human beings.
Results
The correlation between the ATP (RLU) and microbial count (CFU) methods, regardless of the study stage, was assessed by applying Spearman’s correlation test (Table 1).
Spearman’s correlation coefficient for the surfaces evaluated, regardless of the stage assessed.
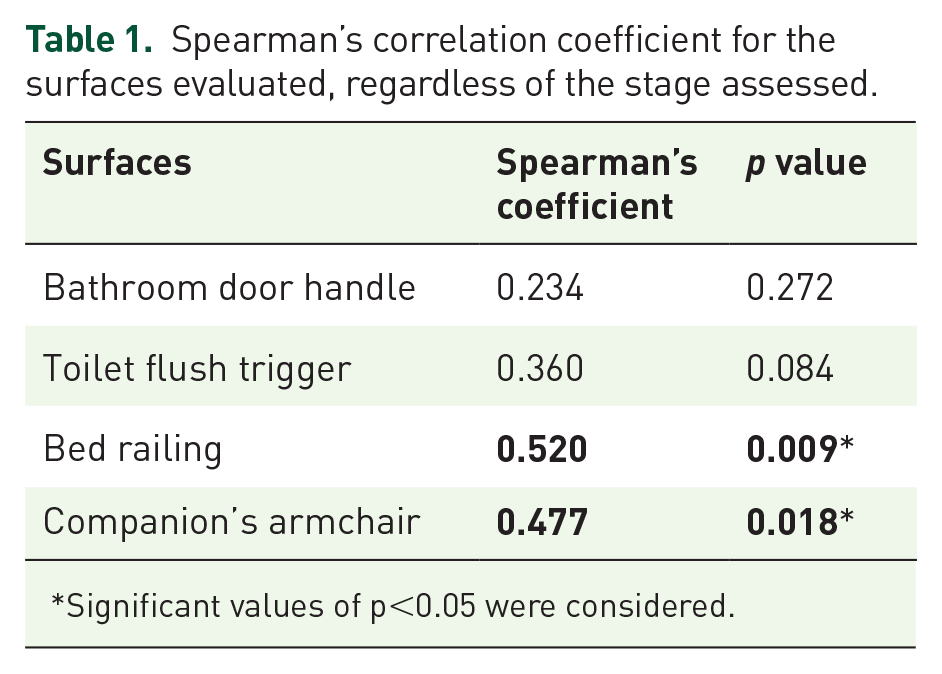
Significant values of p<0.05 were considered.
The results indicate a significant correlation between the ATP measurement and microbial count methods on the surfaces of the bed railing (p = 0.009) and the armchair (p = 0.018), classified as strong- and moderate-magnitude correlations, respectively. 26 In both cases, Spearman’s correlation coefficients indicated a positive correlation between ATP and microbial count scores, that is, the higher the ATP values (in RLUs), the greater the microbial counts (in CFUs/cm2).
The analysis of the ROC curves showed statistical significance in the relationship between the ATP measurement (p = 0.024) and microbial count (p = 0.037) methods in relation to the visual inspection gold standard (Table 2). In this case, the presence of interaction between the methodologies shows that both methods can be employed as a substitute to the visual inspection gold standard.
Parameters of the ROC curves corresponding to the ATP quantification and microbial count methods in relation to the visual inspection gold standard.
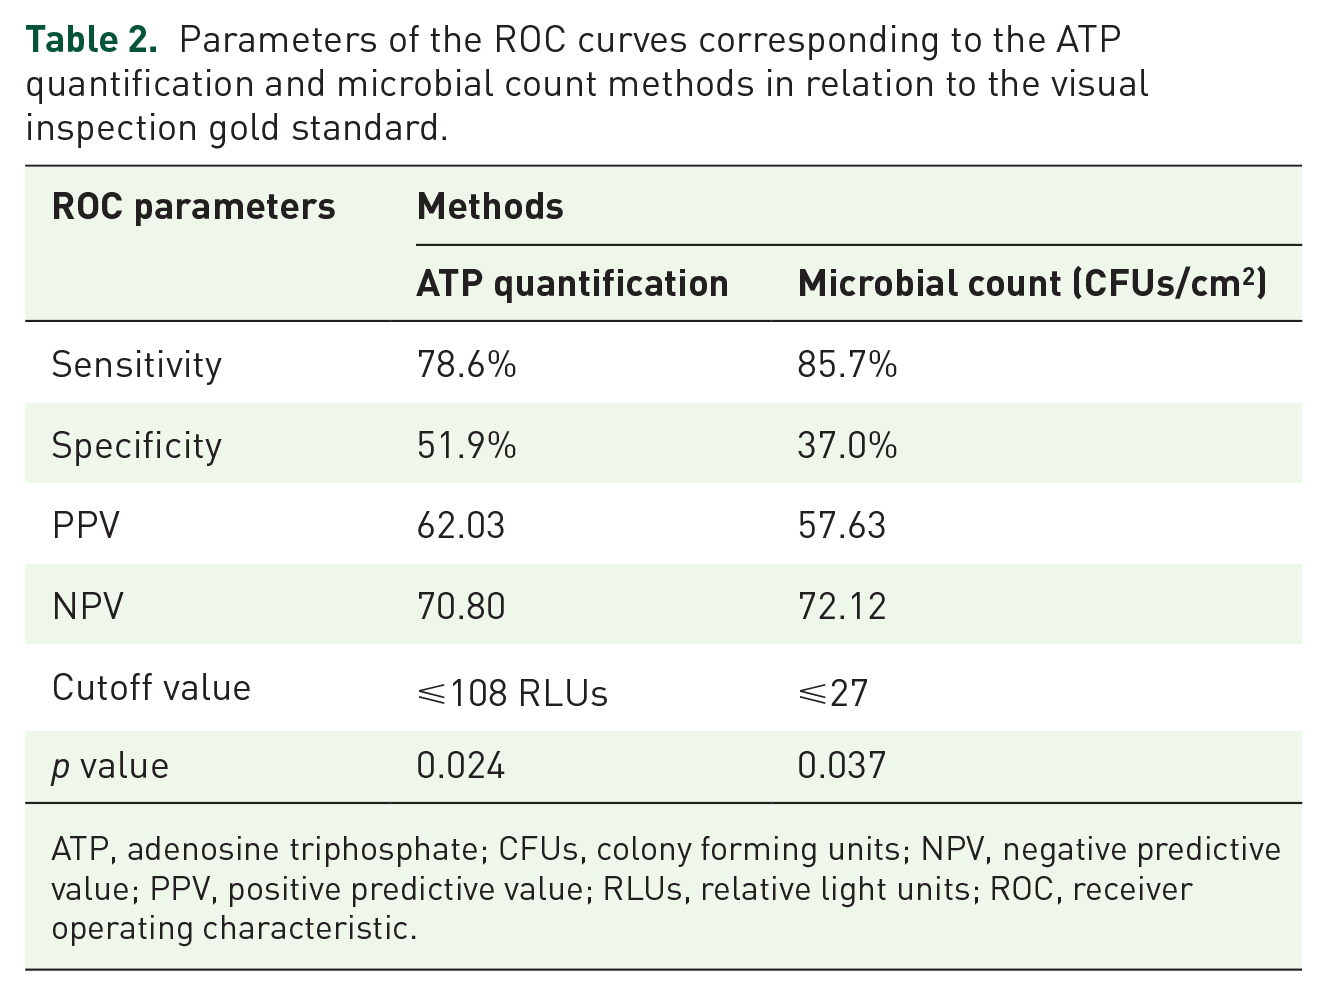
ATP, adenosine triphosphate; CFUs, colony forming units; NPV, negative predictive value; PPV, positive predictive value; RLUs, relative light units; ROC, receiver operating characteristic.
The ROC curve presents the results of the assessment of the ATP quantification and microbial count methods in relation to the visual inspection gold standard (Figures 1 and 2).
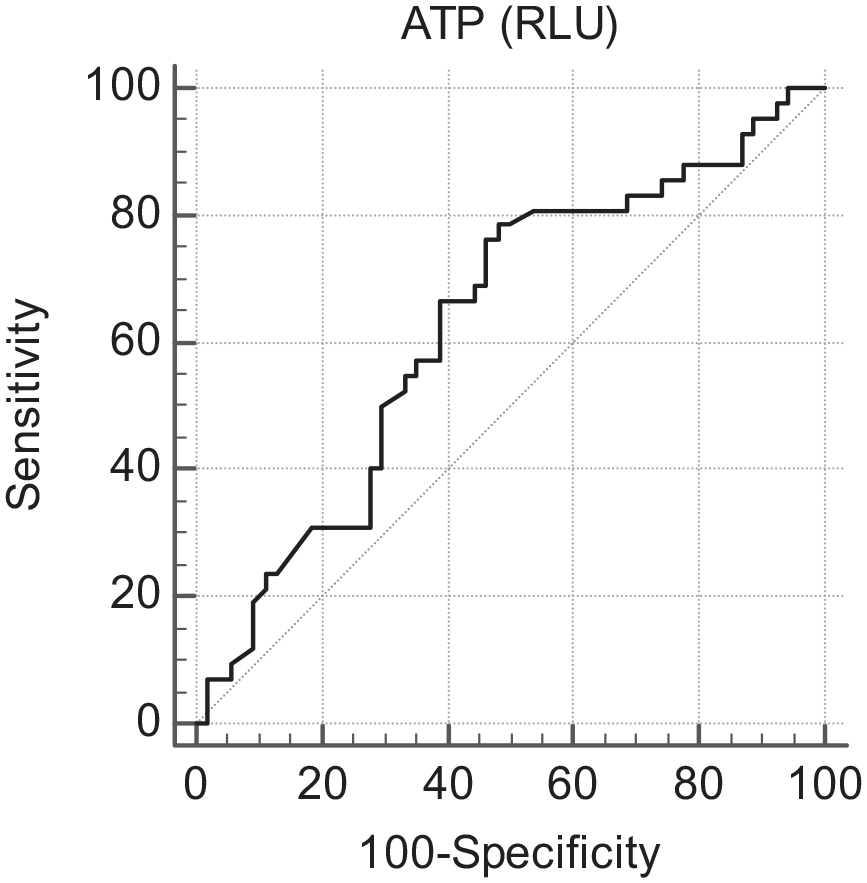
ROC curve of the ATP quantification method in relation to the visual inspection gold standard.

ROC curve of the microbial count in relation to the visual inspection gold standard.
The ATP method yielded 78.6% sensitivity, evidencing such percentage as the probability for this technique to correctly identify a clean surface. When related to the visual inspection gold standard, that methodology can be considered adequate to parametrize the microbiological quality of a hospital surface. It is suggested that surfaces with ATP values below 108 RLUs can be considered approved. Microbial count presented 85.7% sensitivity, evidencing high sensitivity in assessing a hospital surface as clean.
The specificity values indicate that the ATP technique is more likely to correctly indicate a dirty surface (51.9%) than the microbial counting technique (37.0%). Therefore, if the objective of the technique is to verify the incidence of clean surfaces, both the ATP and microbial counting techniques are suitable because they present equal sensitivity values. In addition, if the objective is to indicate the dirty surfaces, the ATP quantification technique is the most suitable because it presents a higher specificity value.
Both techniques resulted in p values lower than the significance level adopted for the test and the cutoff points for each of the techniques were as follows: ATP values less than or equal to 108 RLUs indicate surfaces cleaned by the ATP method, and values less than or equal to 27 CFUs/cm2 indicate surfaces cleaned by the microbial counting method.
The positive and negative predictive values indicate the probability of identifying the truly clean and dirty surfaces among the total of clean and dirty surfaces, respectively. Based on this concept, the ATP technique presents higher positive predictive values, that is, it is the most viable technique to recognize truly clean surfaces in the total of surfaces analyzed. On the other hand, the microbial count technique presented a higher negative predictive value, representing the best technique to identify dirty surfaces from the total of surfaces evaluated.
Discussion
The study findings presented a significant correlation between the ATP measurement and microbial count methods on the surfaces of the bed railing (p = 0.009) and the armchair (p = 0.018). Similar results were found in a study carried out in a specialized care unit, where there was a correlation for the surfaces at the reception desk (rho = 0.598; p = 0.002) and for the stretcher (rho = 0.422; p = 0.040), 12 as well as in a hospital emergency service of a general hospital, where only the door handle of the women’s restroom, among the four surfaces evaluated in the study, showed a correlation (p = 0.008). 21
The data differed from those found in the study carried out in an emergency care unit (ECU), in which it was verified that there was no statistically significant correlation between CFU and RLU, showing that it is not possible to assume that, when there is a reduction in CFU, there will also be a decrease in RLU. 11
It is pertinent to highlight that the variation of the correlation results in CFU and RLU can be influenced by several factors, among them, the fact that, when a surface has a high load of organic matter, it does not necessarily mean that it will have a high microbial load, given that ATP is an energy source not only for microorganisms but also for plant and animal cells. 12
Regarding the analysis of the ROC curves, considering the visual inspection as the gold standard, a suggestion for cutoff values for ATP below 108 RLUs in the pediatric unit was verified, a finding that is very similar to another study where a cutoff value below 107 RLUs was recommended, with the visual inspection as ‘gold standard’. 21
A survey carried out in primary health care suggests values below 48 RLUs; 19 for another study carried out in an ECU (24 h), values below 79 RLUs are recommended; 11 and in a specialized outpatient health unit, the authors found values below 49 RLUs, suggesting values lower than 100 RLUs. 19
The standardization of a cutoff value presented to allow making comparisons is presented as an obstacle to be overcome. 19 There are multifaceted aspects that interfere in the ATP values, encompassing from the system to reading the results by the bioluminescence technique.17,19 The sample collection period and the action time of the products are also corroborated according to the manufacturer’s recommendations. 25
Regarding the visual inspection, the ATP measurement method (RLU) presented 78.6% sensitivity; 51.9% specificity; a positive predictive value of 62.03; and a negative predictive value of 70.80. The following was found by the microbial count method (CFU): 85.70% sensitivity, 37% specificity, a positive predictive value of 57.63, and a negative predictive value of 72.12. It is therefore verified that both the ATP measurement and microbial counting techniques are adequate to correctly identify a clean surface, as they present equal sensitivity values. Regarding the identification of dirty surfaces, the ATP quantification technique is the most suitable because it presents a higher specificity value.
When the microbial count was considered the ‘gold standard’ for analysis and assessment of the surfaces, it was also observed that the ATP detection method (RLU) is the most appropriate (p < 0.001; 67% sensitivity). 10
Regarding the methods to monitor the C&D process, the individual presentation of positive and negative aspects in relation to its use stands out. 27 The bioluminescent ATP trial system provides quantitative cleaning measures, with fast and practical results; however, it is more expensive, requiring the purchase of a light meter and of swabs. 14 By using the luminescence technique, it is possible to quantify the amount of ATP on the surface, which is expressed by means of an RLU light meter. 28 ATP allows identifying bacterial ATP. 27 The ATP method also allows identifying the presence of organic matter on the surface, such as blood, secretions, and food. 29
Aerobic colony count is a method considered as a gold standard. 27 It is presented as a relatively simple procedure, which can detect the presence of pathogens, although it is more expensive, with later results, usually 48 h, and requiring the use of a microbiological laboratory.14,27
It is emphasized that the assessment by the visual inspection method was performed by only one researcher, enabling standardization of the criteria analyzed, in accordance with other studies conducted.10–13,24,25 Although the visual inspection offers the advantage of being a simple and economical method, it is not a reliable cleaning measure. 14
In relation to the impacts of the HAIs on the hospitalization costs of children in Brazil, a study carried out in a university hospital showed a 4.2-fold increase in the median of costs among children who developed this type of infection when compared with those who did not acquire HAIs (p < 0.001), most frequently related to pneumonia and surgical site infection. In addition to the financial impact, the increase in infant morbidity and mortality and the favoring and dissemination of multidrug-resistant microorganisms are highlighted. 30
Thus, the importance of HAI prevention in pediatric hospitalization units in the current global context of the new coronavirus pandemic is highlighted, considering, as already explained in the literature, its ability for transmission through indirect contact with surfaces in the environment or with objects used in the infected person and the susceptibility of infection by the virus in all age groups.31,34
As for the limitations of this study, the analysis and assessment of the effectiveness of SCD is only verified in one health institution and in a limited period of time. The difficulty comparing the data with other studies is also related to the type of methods used to analyze the surfaces, the C&D protocols, and the products used in other health services.
Conclusion
The analysis of the ROC curves showed statistical significance in the relationship between the ATP measurement and microbial count methods in relation to the visual inspection gold standard. The ATP method yielded 78.6% sensitivity, evidencing such percentage as the probability for this technique to correctly identify a clean surface.
When related to the visual inspection gold standard, that methodology can be considered adequate to parametrize the microbiological quality of a hospital surface. It is suggested that surfaces with ATP values below 108 RLUs can be considered approved. Microbial count presented 85.7% sensitivity, evidencing high sensitivity in assessing a hospital surface as clean.
Therefore, this study suggests the importance of using various methods to monitor the C&D process, as each one has different sensitivity and specificity.