
Abstract
Background
Most studies assessing the diagnostic value of high-sensitivity troponin in the diagnosis of myocardial infarction used batch-wise analyses of frozen samples for high-sensitivity troponin measurements. Whether the accuracy of these batch-wise high-sensitivity troponin measurements described in diagnostic studies is comparable to clinical routine is unknown.
Methods
We enrolled 937 patients presenting with suspected myocardial infarction in this prospective cohort study. Measurements of high-sensitivity troponin I (Abbott Architect) and high-sensitivity troponin T (Roche) were performed in two settings: (a) on-demand in clinical routine using fresh blood samples; and (b) in batches using frozen blood samples from the same individuals at three timepoints (0 hours, 1 hour and 3 hours after presentation).
Results
Median troponin levels were not different between on-demand and batch-wise measurements. Troponin levels in the range of 0 to 40 ng/L showed a very high correlation between the on-demand and batch setting (Pearson correlation coefficient (r) was 0.92–0.95 for high-sensitivity troponin I and 0.96 for high-sensitivity troponin T). However, at very low troponin levels (0 to 10 ng/L) correlation between the two settings was moderate (r for high-sensitivity troponin I 0.59–0.66 and 0.65–0.69 for high-sensitivity troponin T). Application of guideline-recommended rapid diagnostic algorithms showed similar diagnostic performance with both methods.
Conclusions
Overall on-demand and batch-wise measurements of high-sensitivity troponin provided similar results, but their correlation was moderate, when focusing on very low troponin levels. The application of rapid diagnostic algorithms was safe in both settings.
Introduction
The characteristics of modern high-sensitivity troponin (hs-Tn) assays enabled the development of rapid algorithms for rule-in and rule-out of myocardial infarction (MI).1–4 Diagnostic studies repeatedly corroborated the excellent diagnostic performance of these algorithms, leading to an improved triage of patients with suspected MI even within a time frame of one hour after admission. 5 The current guidelines for the management of non-ST-segment elevation myocardial infarction (NSTEMI) of the European Society of Cardiology (ESC) therefore incorporated a 0/1 hour algorithm using high-sensitivity troponin I (hs-TnI) or high-sensitivity troponin T (hs-TnT). 6
However, most studies evaluating hs-Tn assays measured the analyte in frozen samples using sample batches of larger sizes and within a small time frame. 3 ,7–10 Compared to this batch setting, in clinical routine hs-Tn is measured sequentially on-demand in fresh blood samples. Analysing blood samples in batches might reduce the variability of the results; for example, by reducing the influence of ex vivo factors, such as lot-to-lot variability and recalibration, and thus might affect the intra-assay variability and therefore diagnostic accuracy. 11 In addition, freezing and thawing of blood samples might introduce degradation of troponin and occasionally the formation of macro complexes and could shift results in both directions. 12
According to ESC guidelines, very low troponin cut-offs are required for rule-out of MI within one hour, therefore, assay accuracy at these low troponin levels is important not to send patients home falsely. 6 Thus, there is a scientific need to evaluate whether the diagnostic performance of hs-Tn assays derived from batch-wise analyses is comparable to sequentially on-demand measurements in clinical routine, especially at low troponin levels.
In the Biomarkers in Acute Cardiac Care (BACC) study we performed a direct comparison of both the on-demand and the batch-wise setting using two well-established guideline-approved hs-Tn assays. Both assays were measured in samples from the same individuals, taken during the same venous puncture, in clinical routine as on-demand measurements using fresh blood samples as well as in batches of frozen samples stored at –80°C until measurement.
Methods
Study population
Data from the BACC study were used for the analyses. An earlier version of this study population has been published before. 1 , 13 In the present analyses, we included data of 937 consecutive patients who presented with suspected MI to the emergency department of the University Heart and Vascular Center Hamburg. The enrollment took place between 19 July 2013 and 10 April 2016. Patients were not included when their age was below 18 years or the patient was not able or willing to provide written informed consent. Patients with ST-segment elevation myocardial infarction (STEMI) were excluded from the analyses. The BACC study was approved by the local ethics committee and was registered at www.clinicaltrials.gov (NCT02355457). The study design complied with the Declaration of Helsinki.
Study design
All patients were treated according to the current ESC guidelines, including ECG, monitoring, serial measurement of standard of care troponin as well as further imaging. Depending on the individual results each patient was discharged or admitted for further treatment. Serum and ethylenediamine tetraacetic acid (EDTA) plasma samples for both settings (on-demand and batch-wise) were obtained via the same venous puncture during routine assessment in the emergency department for all three time points. The first sample was obtained directly on admission (0 hours), a second sample after one hour and a third after 3 hours.
Troponin measurements
On-demand samples
All on-demand measurements were performed in clinical routine at the central laboratory of the university hospital Hamburg-Eppendorf. These measurements will be referred to as ‘on-demand’ measurements. Samples at each time point were transported to the central laboratory via pneumatic tube system immediately after blood withdrawal. Samples were centrifuged (3000 rpm, 10 minutes), on-demand measurements were performed in plasma and serum samples according to manufacturers’ instructions and the standard operating procedure of the central laboratory of the university hospital Hamburg-Eppendorf. Hs-TnT was measured in serum samples using the Roche Elecsys hs-TnT assay kit with the Cobas e411 automated analyser (Roche, Switzerland). Hs-TnT was used as standard troponin for diagnostic adjudication, which was performed independently by two cardiologists using troponin results and all clinical and laboratory data in accordance with the third version of the universal definition of myocardial infarction. 14 If the adjudicators disagreed a third cardiologist refereed. In parallel, hs-TnI was measured in plasma samples using the Architect high-sensitivity troponin I immunoassay (ARCHITECT i2000SR; Abbott Diagnostics, USA). The adjudicators were blinded for the hs-TnI results.
Batch samples
All batch-wise measurements were performed in the biomarker research laboratory of the University Heart and Vascular Center Hamburg. These measurements will be referred to as ‘batch-wise’ measurements. Samples at each time point were transported to the central laboratory via pneumatic tube system immediately after blood withdrawal, together with corresponding on-demand samples. Samples were centrifuged (3000 rpm, 10 minutes) and stored at 4°C until aliquotation (300 µl/tube) and freezing to –80°C was possible (24 hours maximum). For batch-wise measurement of troponin values, samples were thawed to room temperature. A second centrifugation was performed at 13,000 rpm for 10 minutes and supernatant was transferred to a new tube before measurement of troponin according to manufacturers’ instructions using the Roche Elecsys hs-TnT assay kit with the Cobas e411 automated analyser (Roche, Switzerland) for hs-TnT in serum samples and the Architect hs-TnI immunoassay (ARCHITECT i2000SR; Abbott Diagnostics, USA) for hs-TnI measurement in plasma samples. Measurements were performed in a single batch. Median storage time of batch samples was 930 days (25th percentile 867 days, 75th percentile 1039 days) for hs-TnI and 928 days (25th percentile 864 days, 75th percentile 1038 days) for hs-TnT. A second measurement using both hs-Tn assays was performed in batch samples to evaluate inter-assay variability.
Statistical analysis
Continuous variables were described as quartiles; categorical variables as absolute numbers and percentages. Scatter plots of on-demand versus batch-wise hs-Tn measurements were generated, including a Passing Bablok fit. 15 Pearson correlation coefficients were calculated. Receiver operator characteristics (ROC) curves were produced for both on-demand and batch-wise hs-Tn measurements for the NSTEMI diagnosis and the area under the ROC curves (AUC) was calculated. Confidence intervals (CIs) and P values for the AUCs were computed using the methods of DeLong and colleagues. 16 Waterfall plots were used to visualise the differences of on-demand minus batch-wise measurements. 17
The ESC 0/1 hour diagnostic algorithms for rapid rule-out and rule-in of NSTEMI for hs-TnI and hs-TnT were applied using the on-demand and batch-wise measurements. The algorithm has three possible outcomes based on hs-Tn levels: for hs-TnI, a patient was categorised as ‘rule-out’ if hs-TnI at admission was less than 5 ng/L and the delta change in hs-TnI from 0 to one hour was less than 2 ng/L. ‘Rule-in’ was possible, if hs-TnI at admission was 52 ng/L or greater or the delta change in hs-TnI from 0 to one hour was 6ng/L or greater. Otherwise, the patient was categorised as ‘observe’. For hs-TnT, a patient was categorised as ‘rule-out’ if hs-TnT at admission was less than 12 ng/L and the delta change in hs-TnT from 0 to one hour was less than 3 ng/L. ‘Rule-in’ was possible, if hs-TnT at admission was 52 ng/L or greater or the delta change in hs-TnT from 0 to one hour was 5 ng/L or greater. Otherwise, the patient was categorised as ‘observe’. 6 Sensitivity, specificity, positive predictive value (PPV) and negative predictive value (NPV) together with 95% CIs were computed for both assays and using on-demand and batch-wise results. A cross-tabulation of the categorisation of patients according to on-demand and batch-wise measurements was prepared.
Results
Baseline characteristics
The median age of the study population was 65 (interquartile range (IQR) 52–75) years and 65.7% were men. Typical cardiovascular risk factors were present: hypertension was observed in 68.9%, dyslipidemia in 43.9%, tobacco use in 23.1% and diabetes in 15.1% of all patients (Table 1).
Baseline characteristics.
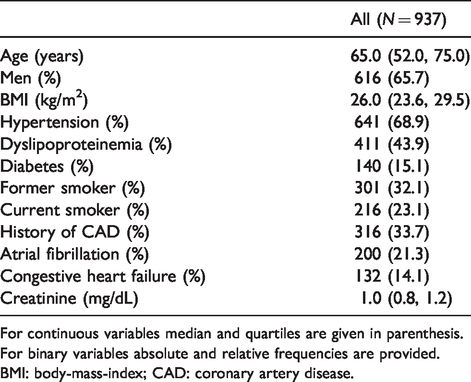
For continuous variables median and quartiles are given in parenthesis. For binary variables absolute and relative frequencies are provided.
BMI: body-mass-index; CAD: coronary artery disease.
Troponin values
For hs-TnI, no difference in median troponin results was observed between the on-demand and batch-wise setting. On-demand samples showed a median troponin I level on admission of 6.4 ng/L (IQR 2.6–19.0 ng/L), while batch-wise analyses resulted in a median hs-TnI of 5.8 ng/L (IQR 2.4–21.9 ng/L). A similar distribution was observed after one hour: 6.4 ng/L (IQR 2.6–25.9 ng/L) for on-demand and 6.3 ng/L (IQR 2.5–30.8 ng/L) for batch-wise analyses, as well as after 3 hours: 7.1 ng/L (IQR 3.1–31.3 ng/L) for on-demand and 7.0 ng/L (IQR 3.0–37.9 ng/L) for batch-wise analyses (Figure 1, Supplementary Figures 1 and 2). For hs-TnI levels on admission, a difference of more than 2 ng/L was observed in 34.1% and a difference of more than 5 ng/L in 10.1% (Figure 2(a) and Supplementary Figure 3 for one hour and 3 hour results).
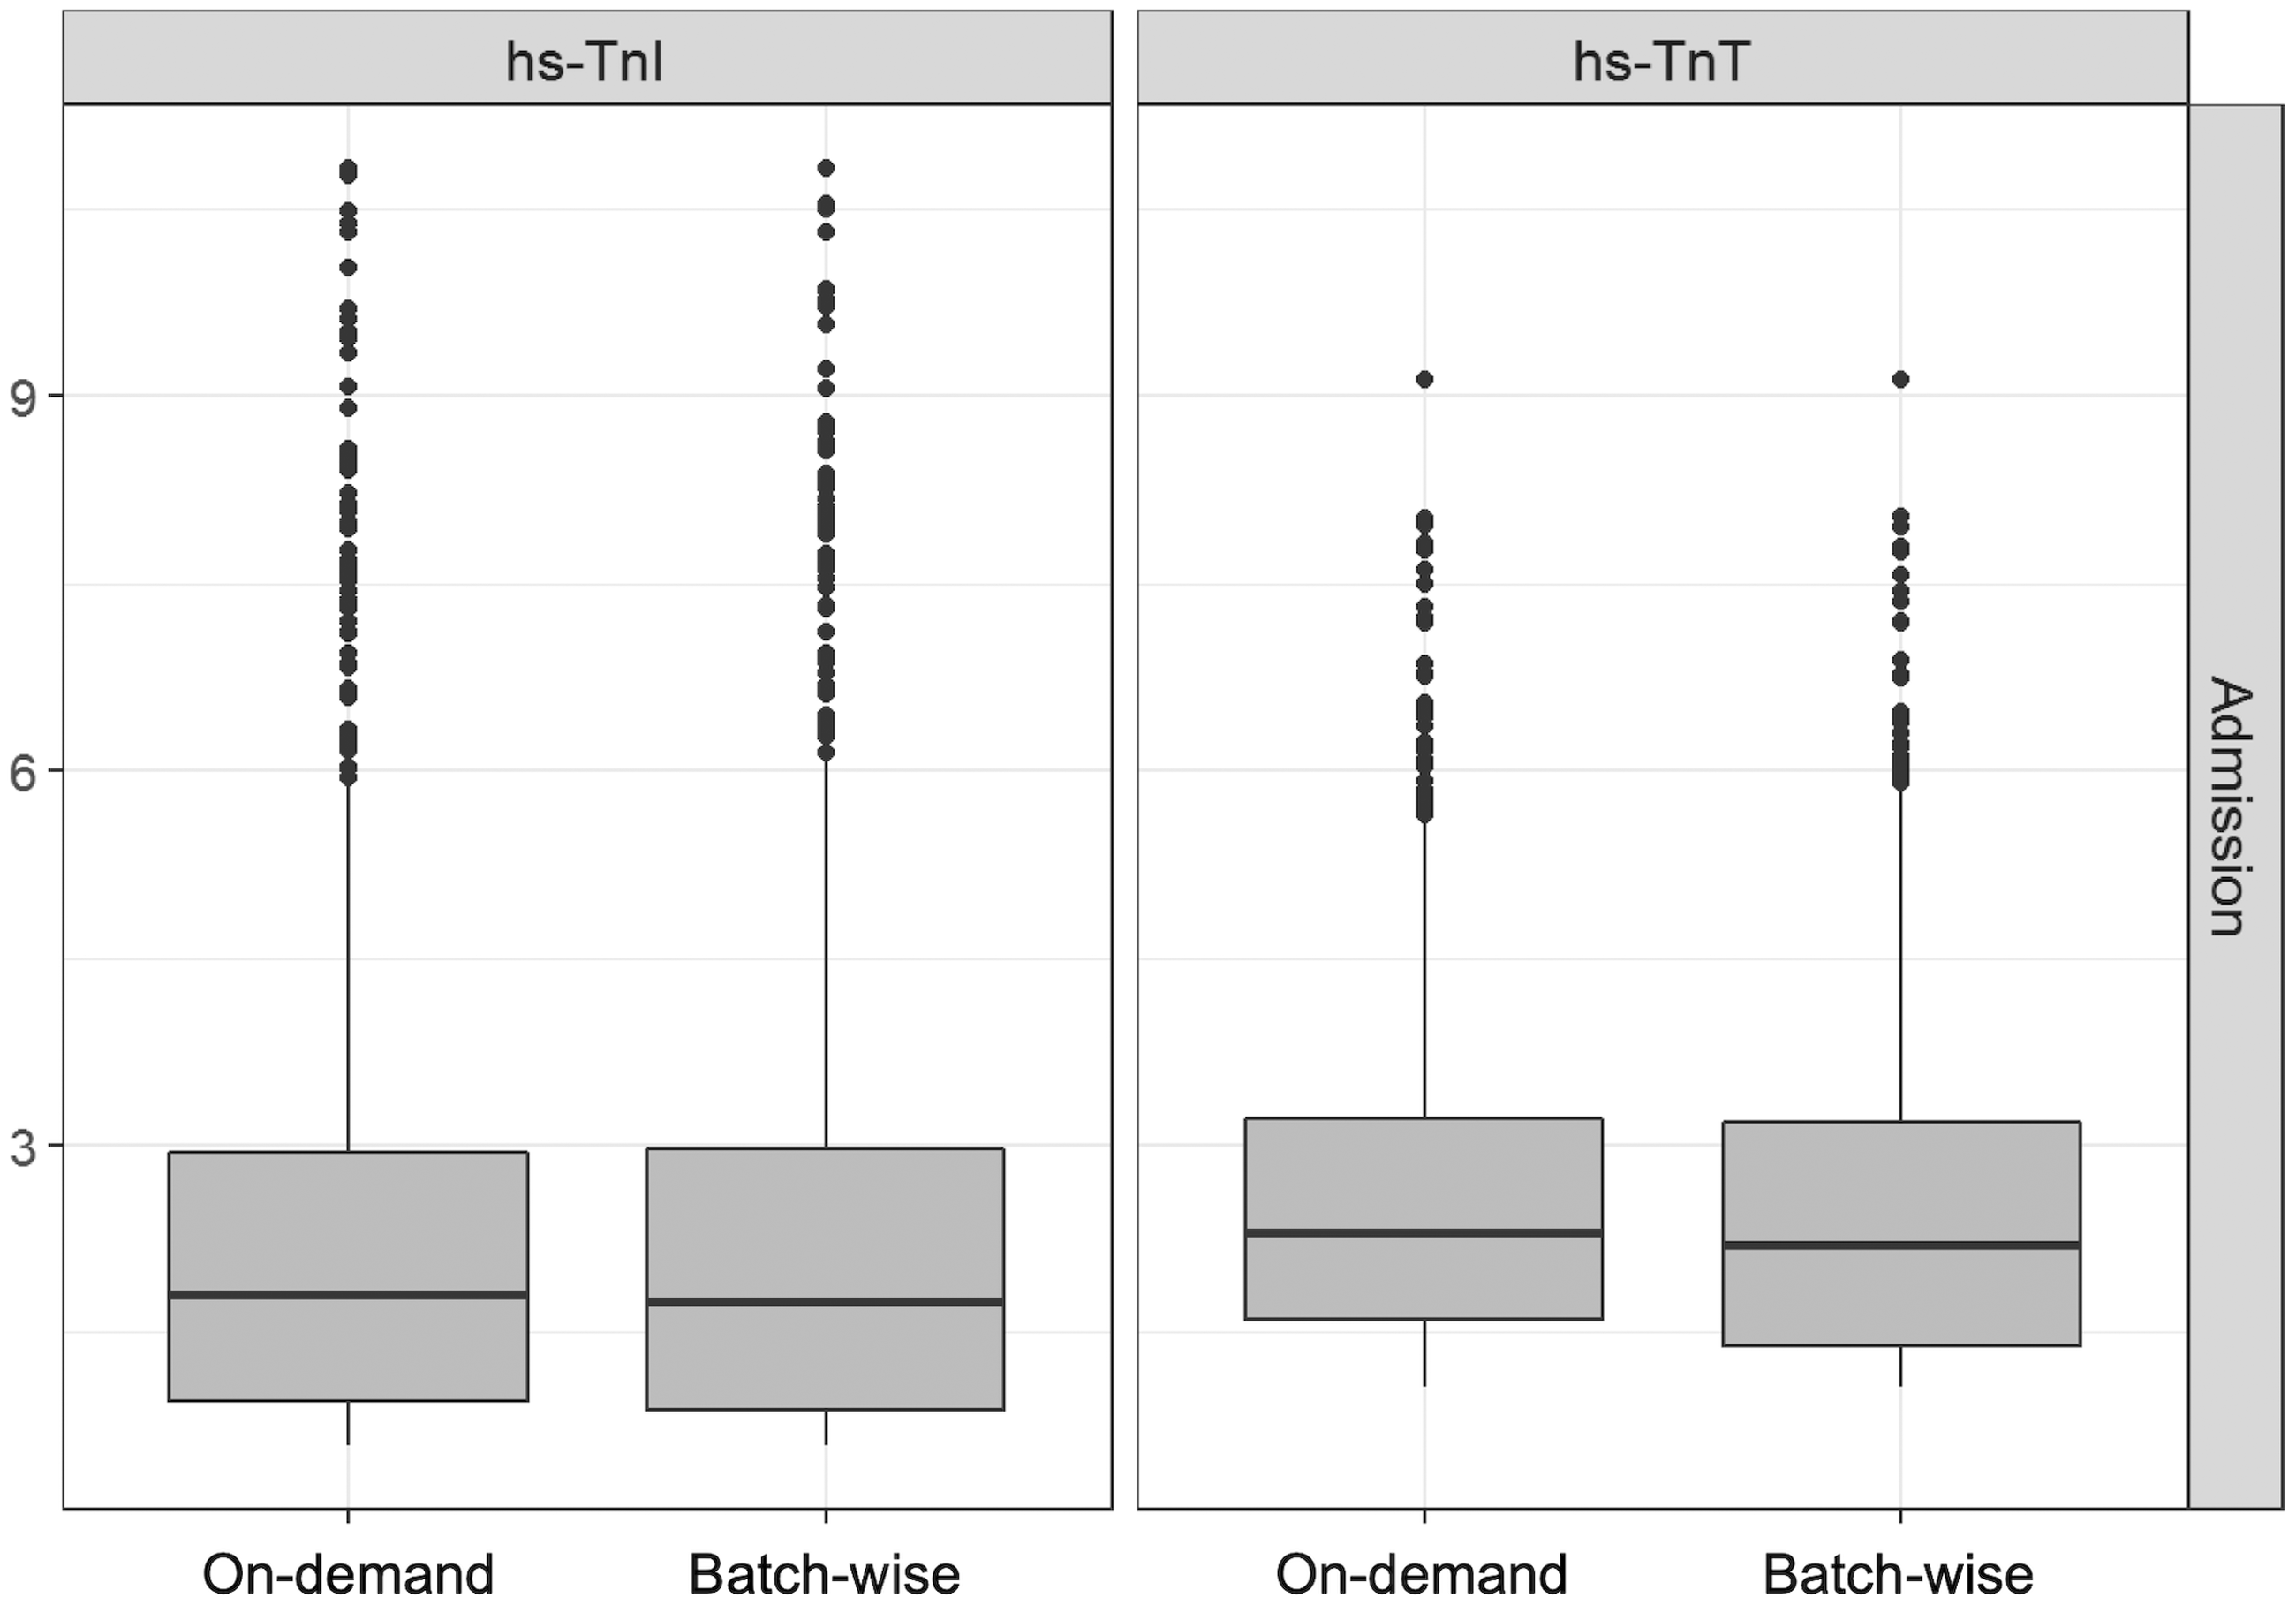
Troponin distribution in on-demand and batch-wise measurements at admission (0 hours).
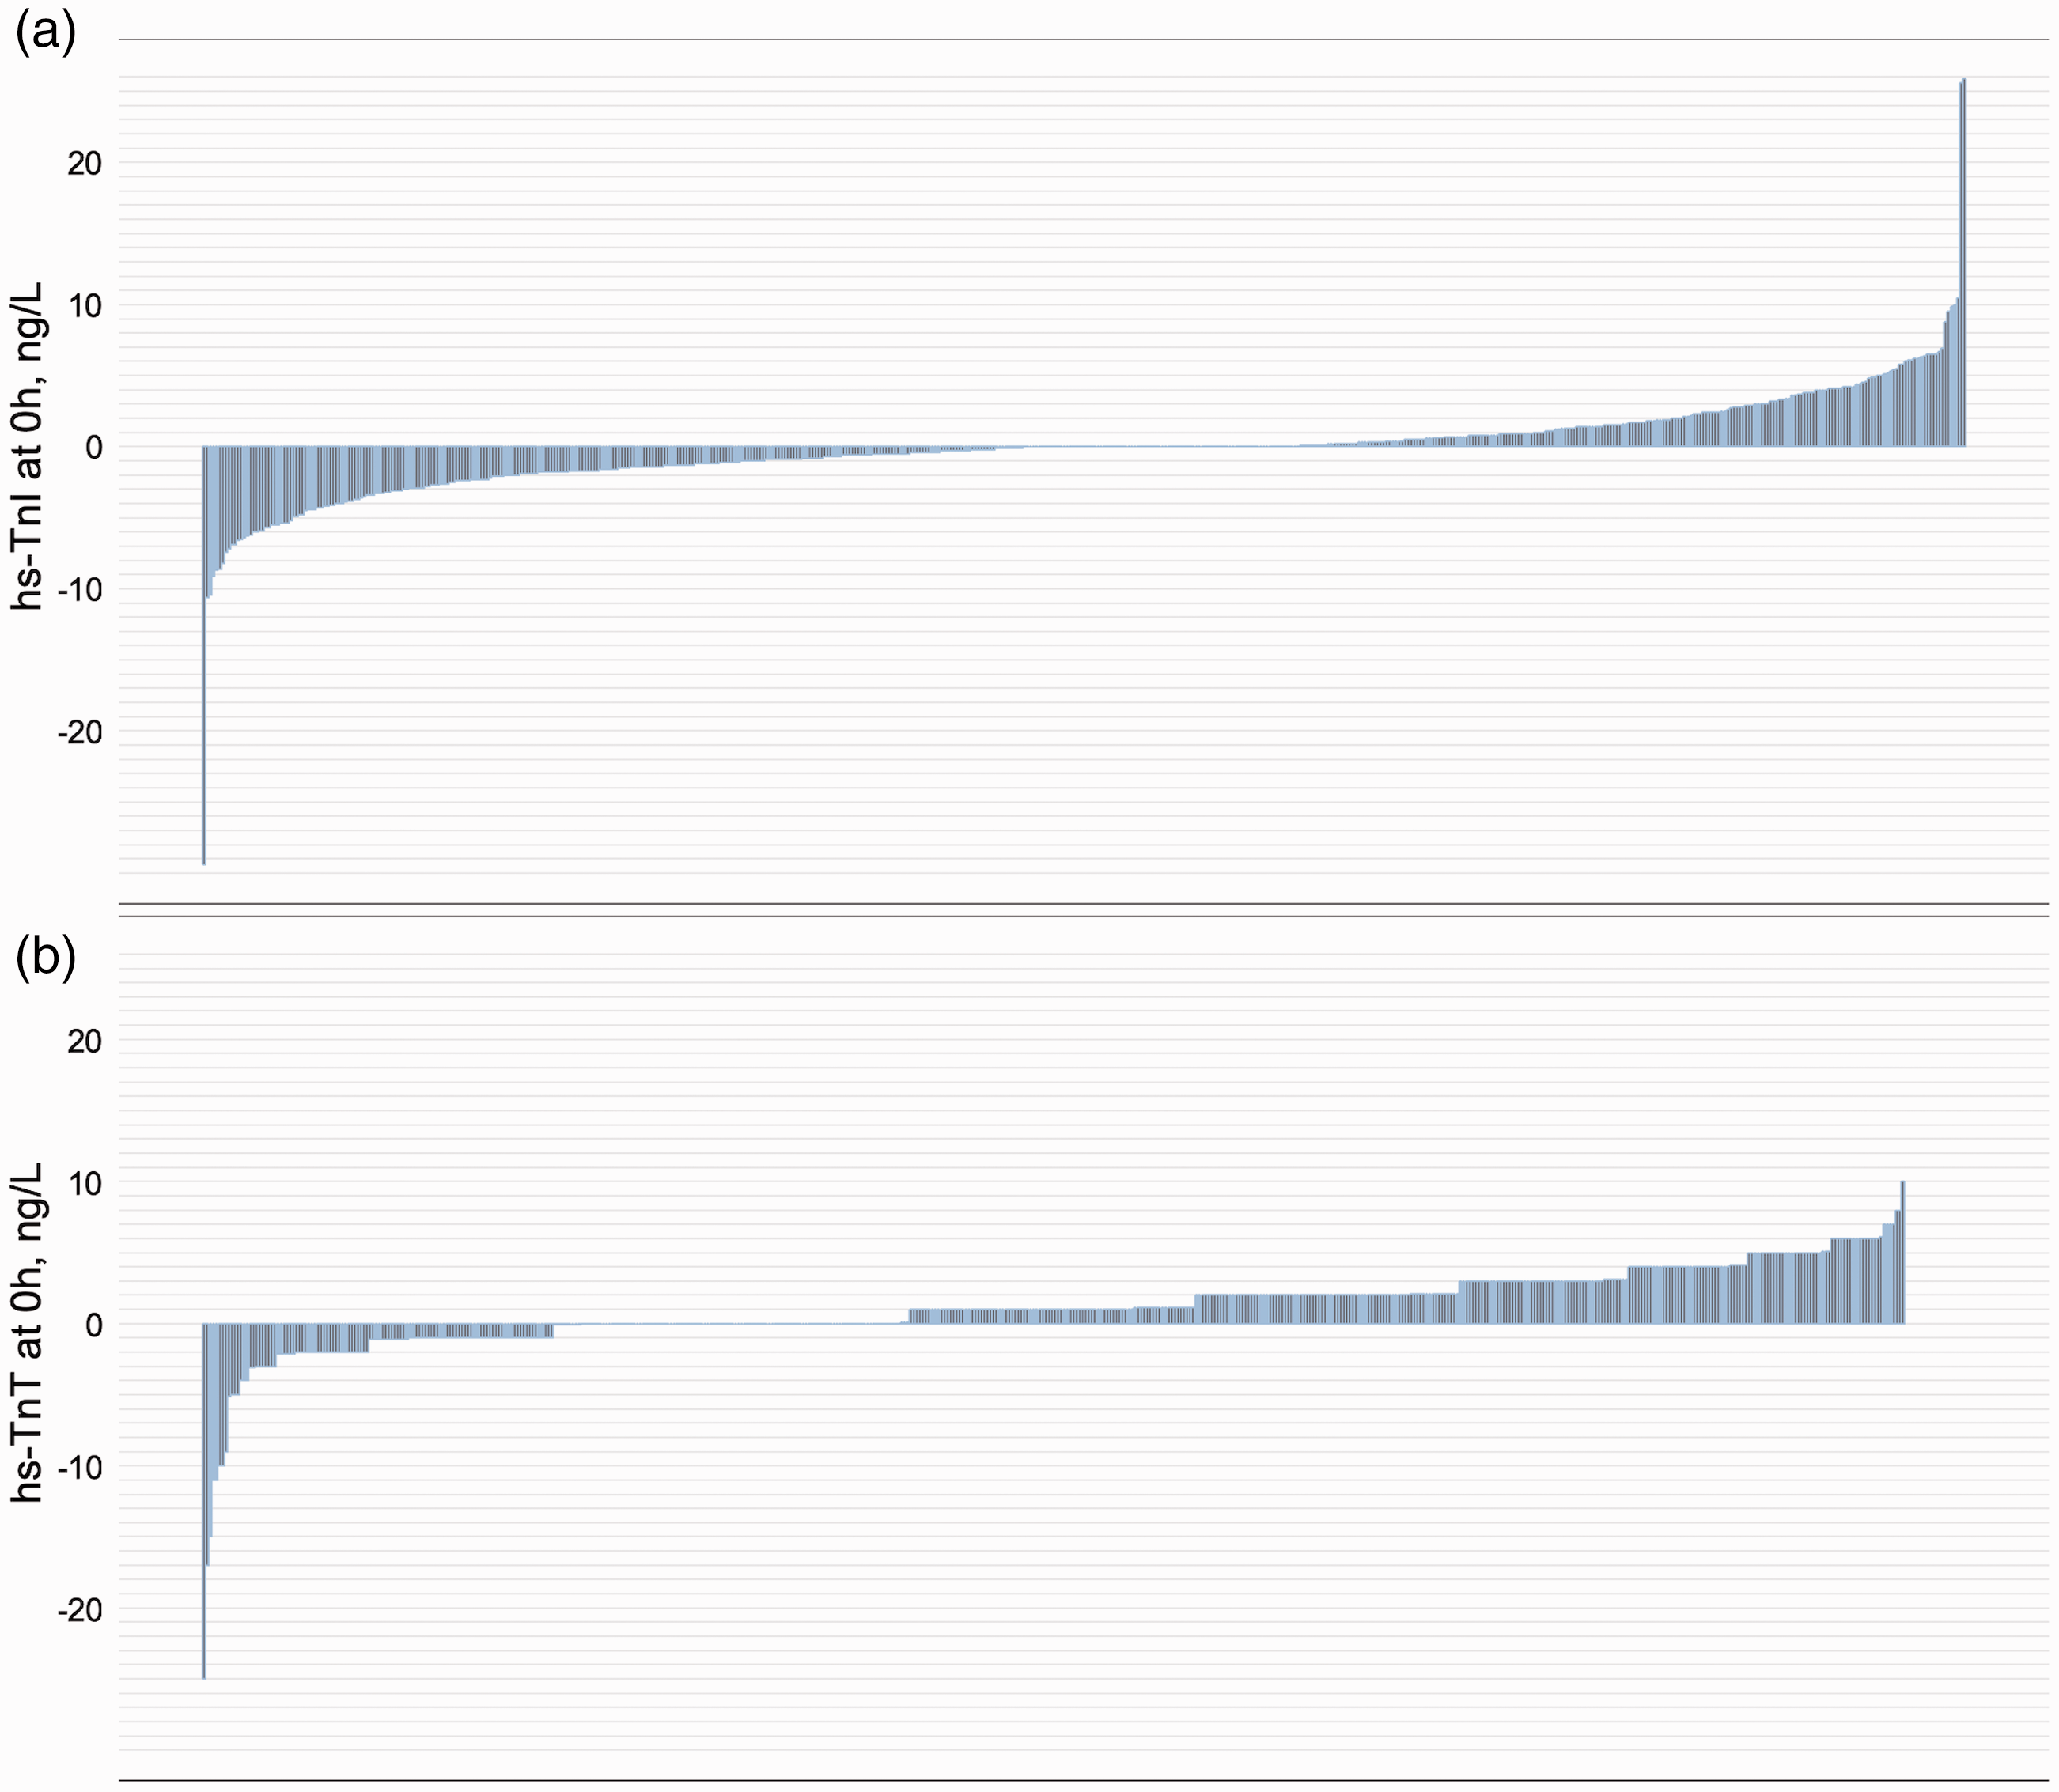
Difference of on-demand and batch-wise analysed high-sensitivity troponin I (hs-TnI) and high-sensitivity troponin T (hs-TnT) at 0 hours.
For hs-TnT, median on-admission values tended to be higher in on-demand analyses: 11.0 ng/L (5.0–26.0 ng/L) in on-demand and 9.0 ng/L (4.0–25.0 ng/L) in batch-wise measurements, the difference was not significant. A similar distribution was observed after one hour: 11.0 ng/L (5.0–29.8 ng/L) in on-demand and 10.0 ng/L (4.0–28.8 ng/L) in batch-wise analyses as well as after 3 hours: 11.0 ng/L (5.0–33.0 ng/L) and 10.0 ng/L (4.0–30.0 ng/L) in batch-wise analyses (Figure 1, Supplementary Figures 1 and 2). For hs-TnT admission results, a difference of more than 2 ng/L occurred in 51.4%, a difference of more than 5 ng/L in 11.4% (Figure 2(b) and Supplementary Figure 4 for one hour and 3 hour results).
The coefficient of variation at a level of 20 ng/L for on-demand measurements was 7.8% for hs-TnI and 3.6% in batch-wise analyses. For hs-TnT the coefficient of variation at a concentration of 23 ng/L was 6.8% for on-demand and 3.2% in batch-wise analyses.
Correlation of troponin levels measured in the batch-wise and on-demand setting
Correlation of on-demand and batch-wise troponin results were high across the whole spectrum of the respective assays. Pearson correlation coefficient (r) reached 0.96–0.97 for hs-TnI and 0.97 for hs-TnT (Supplementary Figure 5). In the range of 0 to 40 ng/L, troponin results showed moderate correlation for both hs-TnI and hs-TnT: r for hs-TnI was 0.89 at 0 hours (Figure 3(a)), 0.94 at one hour and 0.93 at 3 hours (Supplementary Figure 6). For hs-TnT, r was 0.94 at 0 hours, 0.96 at one hour and 3 hours, respectively (Figure 3(b) and Supplementary Figure 7). When only very low values (0 to 10 ng/L) were considered, correlation was weaker: the Pearson correlation coefficient for hs-TnI was 0.59 at 0 hours (Figure 3(c)), 0.66 at one hour and 0.60 at 3 hours (Supplementary Figure 8), for hs-TnT r was 0.65 at 0 hours (Figure 3(d)), 0.65 at one hour and 0.69 at 3 hours (Supplementary Figure 9), respectively.
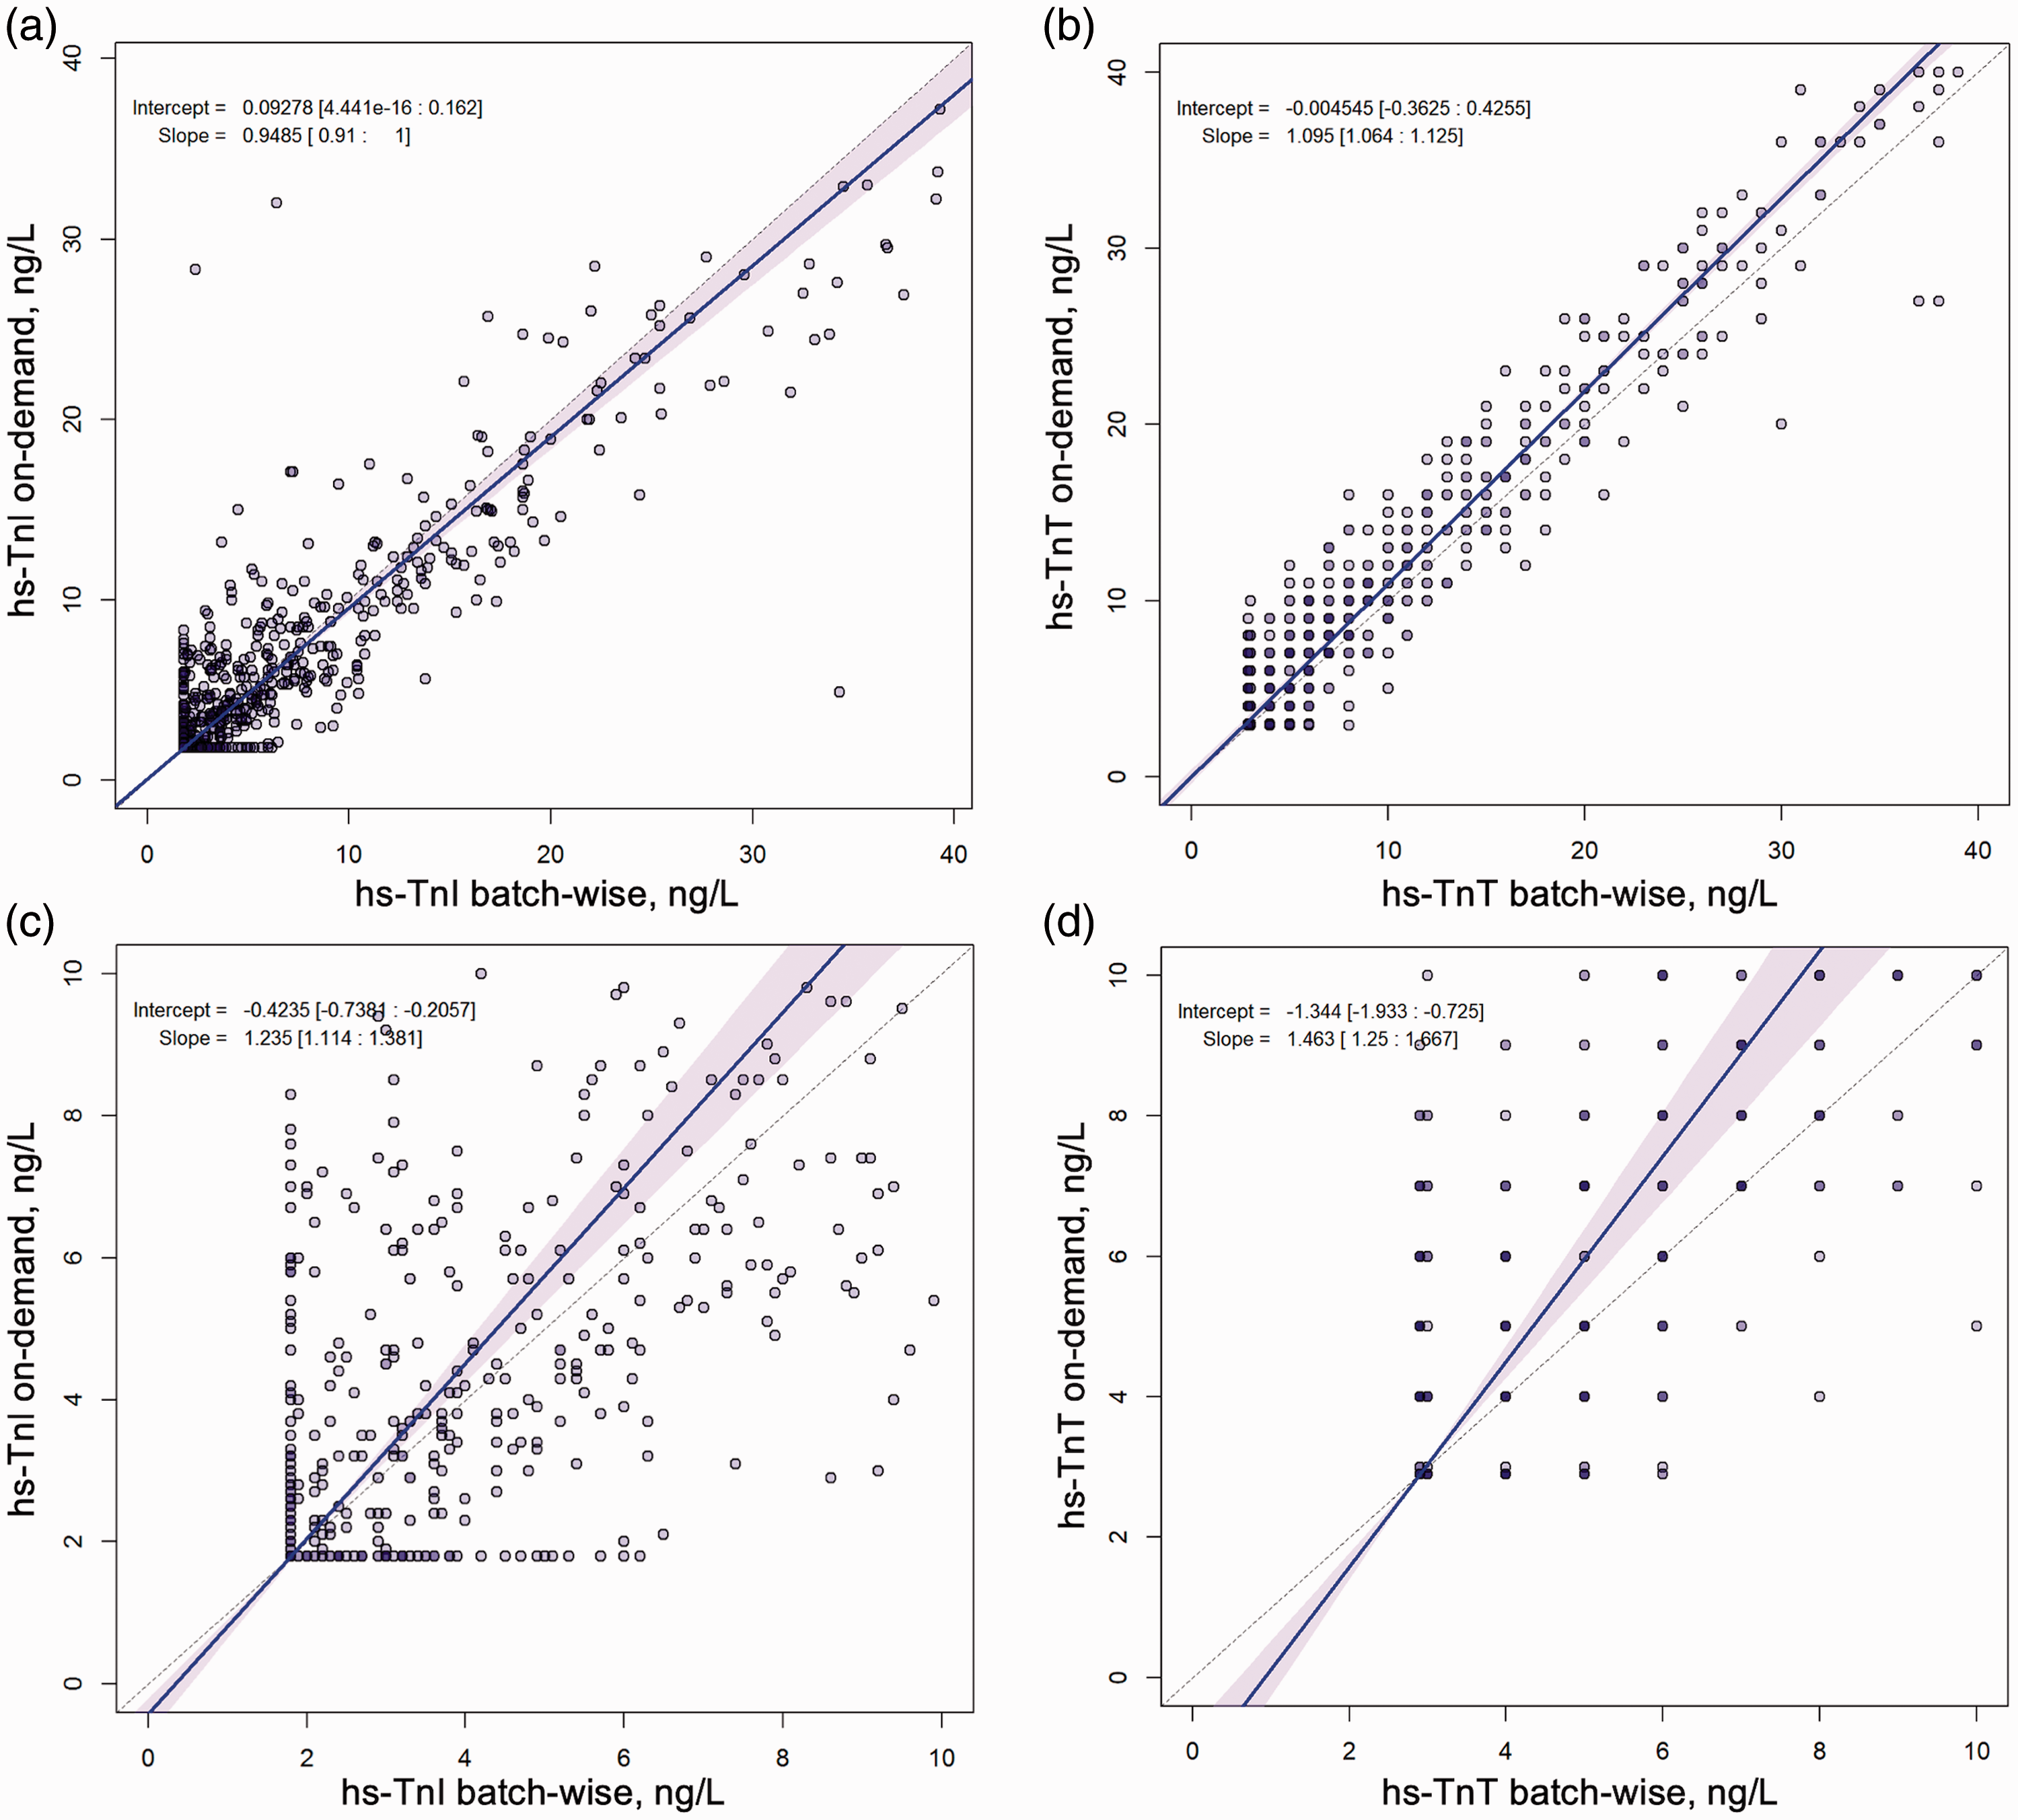
Correlation of on-demand and batch-wise troponin results at 0 hours.
To exclude systematic error in the measurements of samples from the batch-wise setting a second hs-Tn measurement was performed in all patients at all three time points, which resulted in high correlation for both assays, even at very low levels. For on-admission hs-TnI values ranging from 0 ng/L to 40 ng/L r was 0.99 and in the very low range of 0–10 ng/L again r was 0.99 (Supplementary Figure 10). For hs-TnT, on-admission values showed good correlation as well with r=0.99 for values ranging from 0 ng/L to 40 ng/L and r=0.86 for values ranging from 0 ng/L to 10 ng/L (Supplementary Figure 11).
Comparision of diagnostic performance of hs-Tn measured in on-demand and batch-wise settings
There was no significant difference in ROC analyses using on-admission hs-TnI results (AUC was 0.88 for on-demand and 0.89 for batch-wise measurements, P=0.16). For hs-TnT, on-admission AUC was 0.88 for on-demand and 0.88 for batched analyses (P=0.76) (Figure 4). After one hour and after 3 hours AUC values were similar in on-demand and batched analyses of both hs-Tn assays (Supplementary Figures 12 and 13).
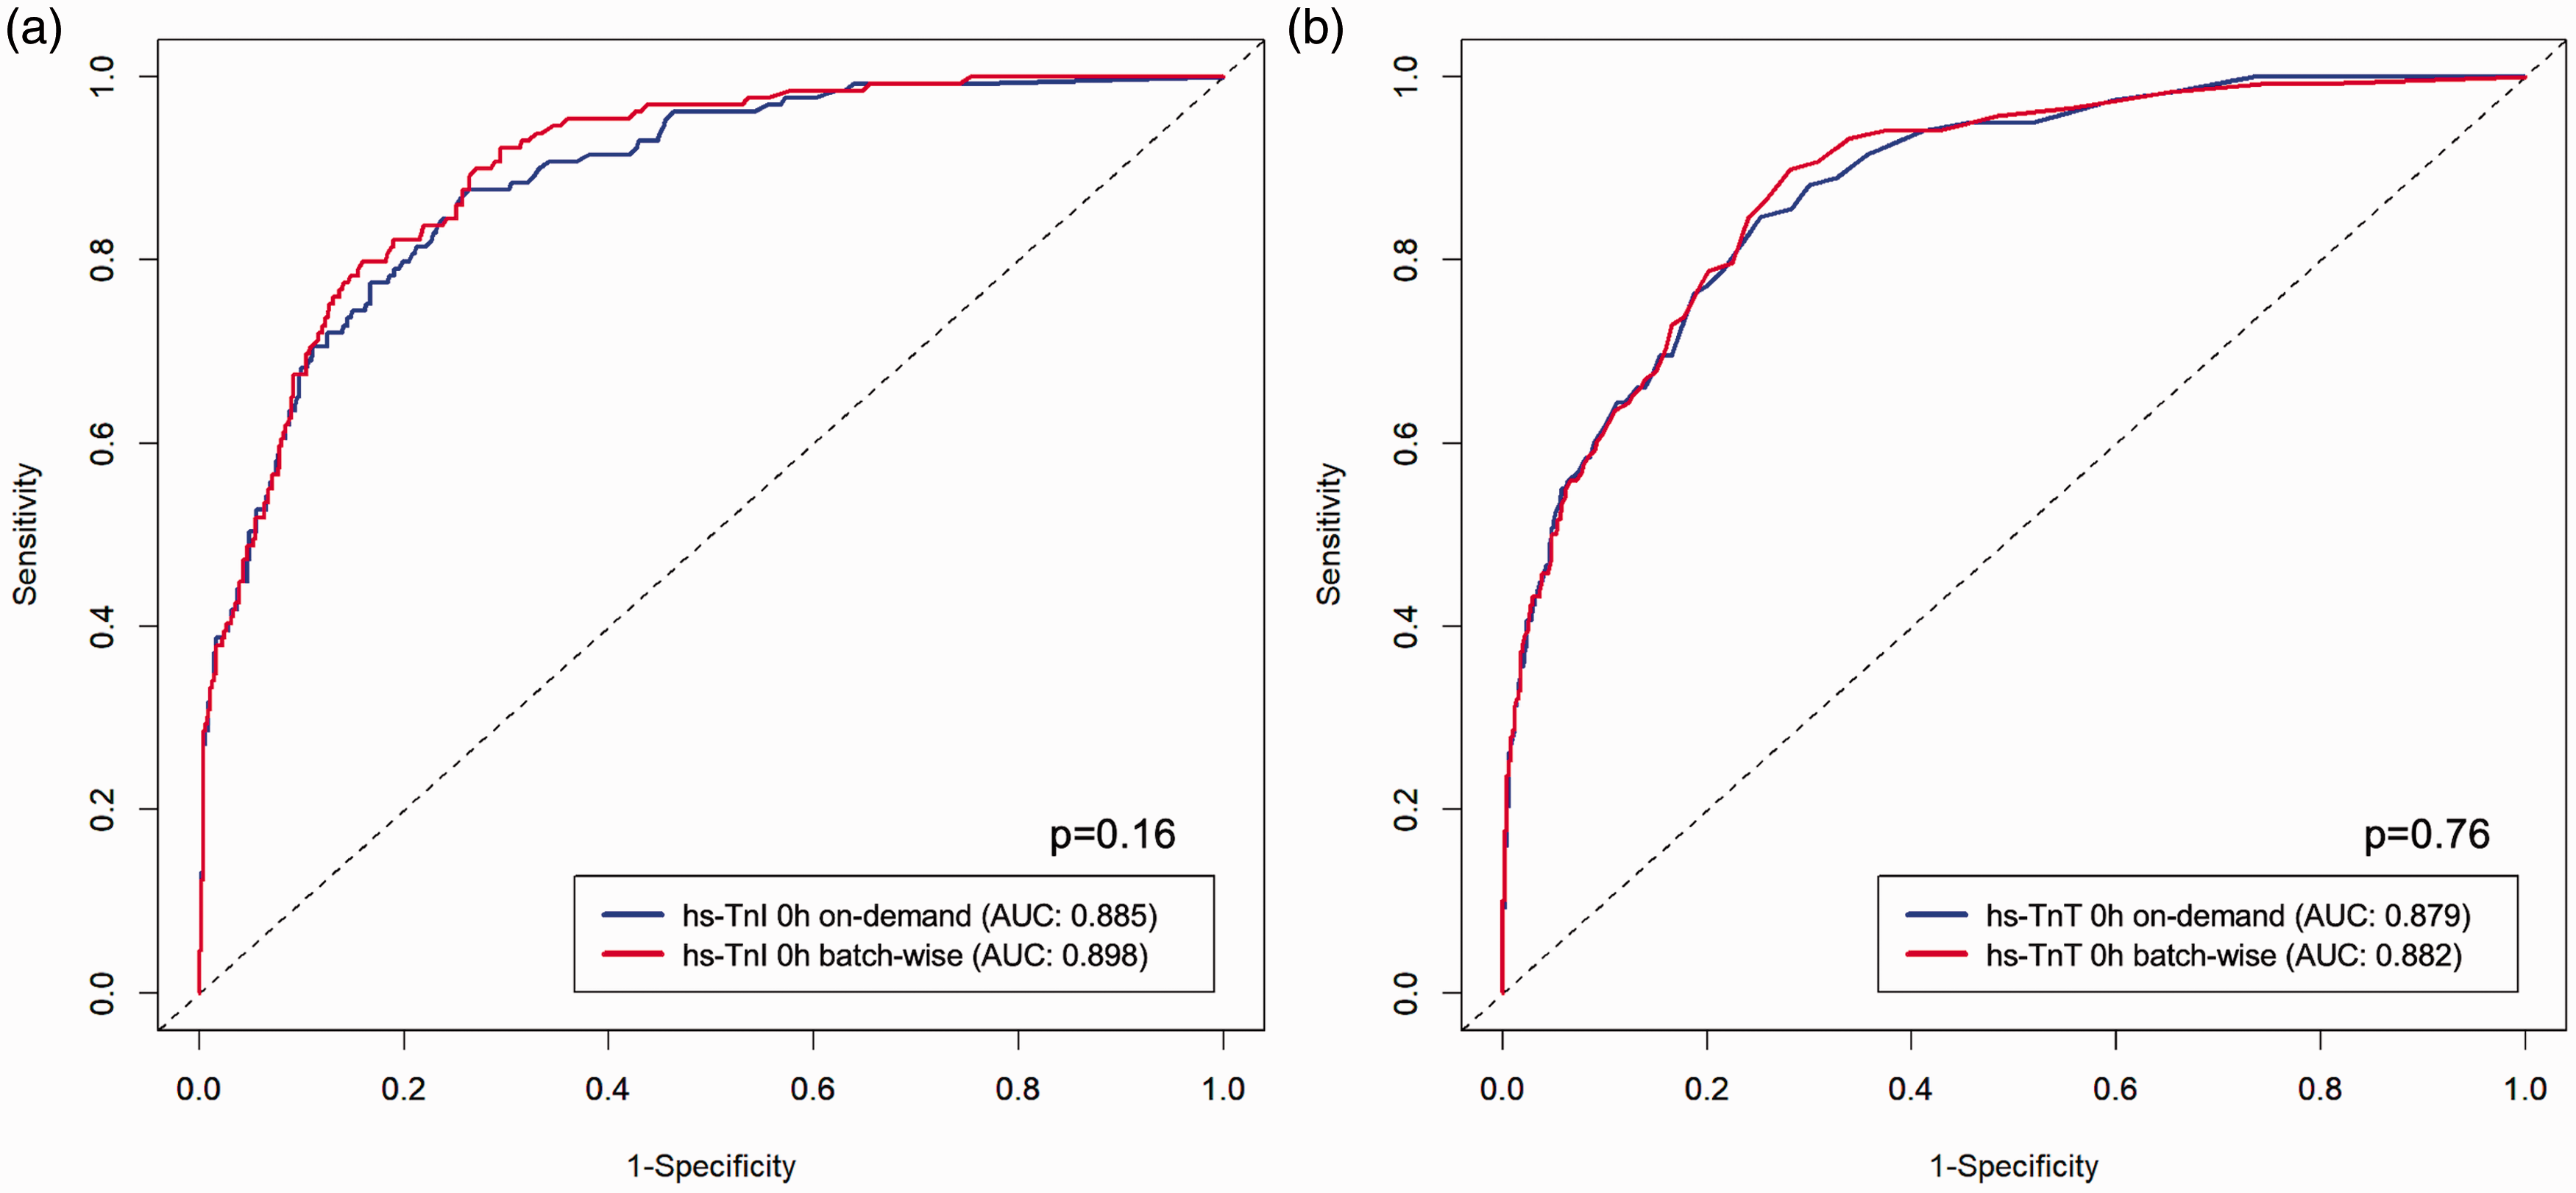
Diagnostic performance of on-demand and batch-wise high-sensitivity troponin I (hs-TnI) and high-sensitivity troponin T (hs-TnT) at 0 hours.
Application of the ESC 0/1 hour diagnostic algorithm for hs-TnI showed comparable diagnostic performance with both methods: the NPV for rule-out of MI was 99.1% (CI 96.7–99.7%) with 35.1% of all patients ruled out using on-demand measurements. Following batch-wise analyses, the NPV was 99.0% (CI 97.1–99.7%) with 48.1% of all patients ruled out. For rule-in a PPV of 72.7% (CI 61.0–82.0%) with 11.9% of all patients ruled in was observed with on-demand, and a PPV of 75.8% (CI 64.2–84.5%) with 11.9% of all patients ruled in with batch-wise measurements, respectively (Supplementary Table 1).
Using the ESC 0/1 hour hs-TnT algorithm the NPV for rule-out of MI was 99.3% (CI 97.5–99.8%) with 49.5% of all patients ruled out with on-demand measurements. Following batch-wise analyses, the NPV was 99.4% (CI 97.8–99.8%) with 56.3% of all patients ruled out. For rule-in a PPV of 74.5% (CI 61.7–84.2%) with 9.6% of all patients ruled in was observed with on-demand, and a PPV of 75.5% (CI 61.9–85.4%) with 8.6% of all patients ruled in with batch-wise measurements, respectively (Supplementary Table 1).
Despite the comparable diagnostic performance of on-demand and bacth-wise analyses, a considerable number of individual patients were classified differently by on-demand or batch measurements, indicating that small differences in troponin results lead to a switch of diagnostic categories: For hs-TnI, 106 patients (17.1%) were classified as ‘rule-out’ following batch-wise and as ‘observe’ following on-demand measurements, while 24 (3.9%) were classified as ‘observe’ following batch-wise and as ‘rule-out’ following on-demand measurements (Table 2). For hs-TnT, 56 patients (9.8%) were classified as ‘rule-out’ following batch-wise and as ‘observe’ following on-demand measurements, while 16 (2.8%) were classified as ‘observe’ following batch-wise and as ‘rule-out’ following on-demand measurements (Table 2). There were no false negatives among differently classified patients based on their hs-TnT results.
Cross-tabulation of patient classification following the ESC 0/1 hour diagnostic algorithm using on-demand and batch-wise hs-Tn results.
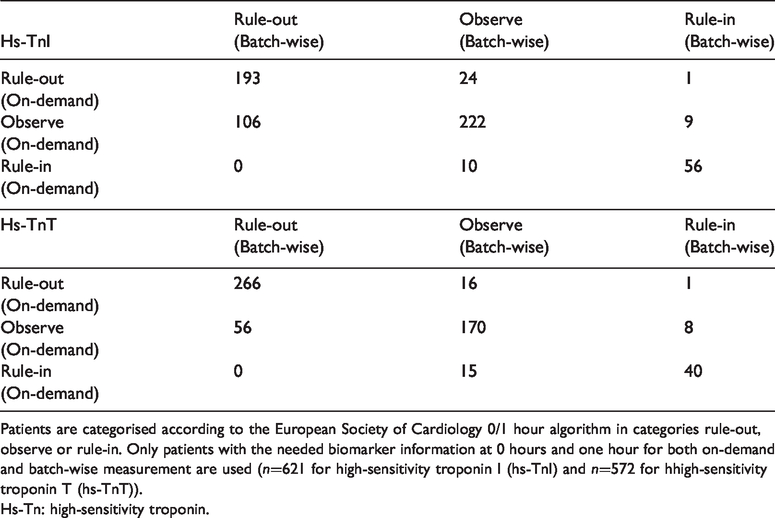
Patients are categorised according to the European Society of Cardiology 0/1 hour algorithm in categories rule-out, observe or rule-in. Only patients with the needed biomarker information at 0 hours and one hour for both on-demand and batch-wise measurement are used (n=621 for high-sensitivity troponin I (hs-TnI) and n=572 for hhigh-sensitivity troponin T (hs-TnT)).
Hs-Tn: high-sensitivity troponin.
Discussion
Studies evaluating the diagnostic potential of biomarkers, such as hs-Tn are usually performed using frozen samples in a batch-wise manner, measuring tens to hundreds of samples per day within a certain time frame. However, once transferred into the clinical routine setting, samples are measured on demand.
The present study analysed the differences of these two settings of measurement of hs-Tn: live, on-demand analyses used in clinical routine and batch-wise measurement of frozen samples. To our knowledge, this is the largest study performed so far, analysing two hs-Tn assays measured at three time points in samples from 937 patients with suspected MI, resulting in over 10,000 troponin measurements.
The main findings of our study are: (a) the overall correlation of batch-wise and on-demand measurements is high; (b) there are variations between on-demand and batch-wise measurement of troponin at very low troponin levels using two well-established hs-Tn assays; (c) the safety of rapid diagnostic algorithms to triage patients with suspected MI was similar in both methods; however, the efficacy of these algorithms was lower in the on-demand setting.
When the whole range of the assays was considered, correlation of on-demand and batch-wise samples was excellent for both assays at all three time points. However, at the lower range of the assays’ capacity (0–10 ng/L) correlation of both methods was moderate. Although it was shown that troponin is stable in frozen samples and therefore is suited as a biomarker for population studies,18–20 it was reported before that variation of the given result increases after freezing and thawing of the samples. 20 Over the whole range of an assay this variation was regarded acceptable for both assays; however, especially in the lower range of the assays a certain variation is to be expected. 12 Several factors might add to this phenomenon: first, due to the biology of the assays, imprecision is greatest at the lower end of the assays’ capacity. So even when performing two measurements under identical conditions one would expect variation of the results when analysing very low troponin concentrations. In addition, in the current analysis we not only compared fresh samples with stored frozen samples, but two separate settings of analysing troponin. While in batch-wise analyses handling during freezing and thawing as well as degradation of troponin in stored samples might affect the reported result, 21 the on-demand measurement in our analysis might be prone to lot-to-lot variability and recalibration, which might not be the case in batch-wise measurement of frozen samples which are usually measured using one reagent lot. 11 Which of the above factors contribute most to the observed differences remains unanswered; however, our analysis of double determinations in batch samples showed almost perfect correlation, even at very low troponin concentrations, which might indicate that assay imprecision is not the major contributor to the variation of both methods.
Guideline-approved rapid diagnostic algorithms for rule-out and rule-in of MI were mostly developed and validated using batch-wise measurements of frozen samples.22–26 The main question of the present study therefore was whether the described high diagnostic performance and clinical safety of these rapid algorithms are matched in an on-demand setting. The observed variation at lower troponin levels led to a part of patients which were differently classified by the two methods: this was more pronounced for hs-TnI, with which 35% of patients that were ruled out with batch-wise results, were classified as ‘observe’ by their corresponding on-demand results. For hs-TnI, a very low cut-off of 5 ng/L at baseline and a delta from 0 to one hour of 2 ng/L or greater for ruling out MI is recommended in ESC guidelines. 6 These cut-offs are much lower than those for hs-TnT (12 ng/L at baseline and a delta of 3 ng/L) and therefore the hs-TnT algorithm might be less affected by the differences in batch-wise and on-demand measurements than the hs-TnI algorithm. This was recently corroborated in a study by Twerenbold et al., 27 which prospectively evaluated the ESC 0/one hour algorithm using hs-TnT in 2296 patients with suspected NSTEMI. The authors reported excellent safety and efficacy of the algorithm with a very low rate of major adverse cardiac events after 30 days. 27 It is noteworthy that in the present study the clinical safety of the rule-out of MI was similar for both settings and both assays with high NPVs and we found no falsely ruled out patients among differently classified patients. Following our analysis, the clinical application of the rapid ESC algorithms is safe; however, the efficacy in clinical routine might be lower than reported by diagnostic studies. Still, it is of utmost importance that clinicians are aware of the technical limitations of the assays, and acknowledge that by application of these very low cut-offs in clinical routine misclassification of some individual patients might occur. 21 Particularly for algorithms using a single baseline troponin measurement for rule-out of MI28–30 our results might have an impact. Therefore, future studies evaluating low troponin cut-offs using on-demand measurements in clinical routine are needed.
Our study had several strengths and limitations. It is the largest study investigating the differences of troponin levels measured live, on-demand and batch-wise from frozen samples. The assays tested are highly validated and used as standard troponin assays in hospitals worldwide. Due to the large sample size we were able not only to show the differences in both methods, but also analyse the effect on diagnostic decision-making using guideline-approved rapid algorithms. However, some limitations remain: on-demand hs-TnT results were only available as whole numbers, we therefore rounded batch-wise analyses to whole numbers as well, which might have impaired correlation analysis. All hs-TnT measurements were performed using the Roche Cobas e411 analyser. This specific platform was shown to be inferior in assay accuracy, especially at lower troponin concentrations, compared to other analysers available for the Elecsys hs-TnT assay. 31 Therefore, we cannot exclude that some of our findings are influenced by the assays’ imprecision. However, given the similar degree of variation in hs-TnI and hs-TnT results, as well as the nearly perfect correlation of double determinations in batch-wise samples, it seems the use of the Cobas e411 platform only remotely affected the results. Finally, double determinations were only possible in batch-wise analysis due to the study design.
In conclusion, on-demand and batch-wise measurements of hs-Tn provided similar results with a high correlation of both methods. At very low troponin levels correlation was modest. However, clinical application of rapid diagnostic algorithms was safe in both settings.
Supplemental Material
sj-pdf-1-acc-10.1177_2048872620924198 - Supplemental material for Differences in measurement of high-sensitivity troponin in an on-demand and batch-wise setting
Supplemental material, sj-pdf-1-acc-10.1177_2048872620924198 for Differences in measurement of high-sensitivity troponin in an on-demand and batch-wise setting by Nils Arne Sörensen, Johannes Tobias Neumann, Francisco Ojeda, Thomas Renné, Mahir Karakas, Stefan Blankenberg, Dirk Westermann and Tanja Zeller in European Heart Journal: Acute Cardiovascular Care
Footnotes
Conflict of interest
The author(s) declared the following potential conflicts of interest with respect to the research, authorship, and/or publication of this article: JTN received honoraria from Siemens and Abbott Diagnostics. SB received honoraria from Abbott Diagnostics, Siemens, Thermo Fisher and Roche Diagnostics and is a consultant for Thermo Fisher. DW reports personal fees from Bayer, Boehringer-Ingelheim, Berlin Chemie, AstraZeneca, Biotronik and Novartis. All other authors declare that there is no conflict of interest.
Funding
The author(s) disclosed receipt of the following financial support for the research, authorship, and/or publication of this article: The BACC study was supported by an unrestricted grant by Abbott Diagnostics. This research was funded in part by the German Center of Cardiovascular Research (DZHK e.V.) and by the European Research Area Network (ERA-Net) (PREMED-CAD) (grant no. FKZ01KL1807). NAS and JTN were supported by grants from the German Heart Foundation/German Foundation of Heart Research (grant no. F/42/16). JTN was supported by the Else Kröner Fresenius Stiftung. TZ was supported by the German Center of Cardiovascular Research (DZHK e.V.) under the grant number 81Z1710101.
Supplemental material
Supplemental material for this article is available online.
References
Supplementary Material
Please find the following supplemental material available below.
For Open Access articles published under a Creative Commons License, all supplemental material carries the same license as the article it is associated with.
For non-Open Access articles published, all supplemental material carries a non-exclusive license, and permission requests for re-use of supplemental material or any part of supplemental material shall be sent directly to the copyright owner as specified in the copyright notice associated with the article.