
Abstract
Background
Diffusion tensor imaging (DTI) is prone to numerous systemic confounding factors that should be acknowledged to avoid false conclusions.
Purpose
To investigate the possible effects of age, gender, smoking, alcohol consumption, and education on cerebral DTI parameters in a generally healthy homogenous sample with no neurological or psychiatric diseases.
Material and Methods
Forty (n = 40) subjects (mean age, 40.3 years; SD, 12.3) underwent brain DTI with 3 T magnetic resonance imaging (MRI). At enrolment, all the subjects were interviewed with respect to general health, education, history of smoking, and alcohol consumption. Studied DTI parameters included: (i) fractional anisotropy (FA); and (ii) apparent diffusion coefficient (ADC). Region-of-interest (ROI)-based measurements were estimated at 13 anatomical locations bilaterally on the axial images, except for the corpus callosum in which the ROIs were placed on the sagittal images. Circular ROI measurements were mainly used. Freehand ROI method was used with the forceps minor, uncinate fasciculus, and thalamus. Intra-observer variability and repeatability were assessed.
Results
The most consistent finding was that aging decreased FA values in the frontal brain regions. Regarding the other confounding factors, the results were discontinuous and no concrete conclusions could be drawn from these findings. In general, intra-observer repeatability of the DTI measurement was considered relatively good.
Conclusion
Age should be noted as considerable confounding factors in ROI-based DTI analysis. More research on the effects of gender, smoking, alcohol consumption, and education is needed.
Introduction
Diffusion tensor imaging (DTI) is a magnetic resonance imaging (MRI) technique which is used to visualize neural white matter tracts. DTI is based on the measures of the random diffusion motion of water in living tissues. Because of restricting structures such as cell membranes and myelin, the motion of water molecules is anisotropic (= directionally dependent) within neural fibres. The most cited quantitative DTI metrics are: (i) fractional anisotropy (FA); and (ii) the apparent diffusion coefficient (ADC). FA is related to the density of white matter fiber density, axonal diameter, and myelin content of white matter, and ADC measures the average magnitude of diffusion. The most commonly used methods for DTI analyses are region-of-interest (ROI) analysis and voxel-based analysis (VBA). Besides these, quantitative diffusion tractography can be used to characterize white matter tracts (1–4). ROI analysis is observer-dependent and time-consuming, whereas VBA is an automated and objective method. However, inter-subject registration and image smoothing are needed for using VBA. ROI-based method has been available for a longer time and still remains the mostly used method in DTI analyses (5). The advantages of ROI analysis compared to VBA are: (i) the manual selection of regions; (ii) the quantification of the measured parameters; and (iii) the individual applicability.
DTI techniques have been applied to numerous neurological and psychiatric conditions including stroke, multiple sclerosis (MS), various dementias, traumatic brain injury, and schizophrenia. Commonly, increased FA and reduced ADC values relate to the initial phase of stroke (6). In MS lesions, increased ADC and decreased FA values can be observed. MS also causes fiber tract loss assessable with tractography (7–9). In neurodegenerative diseases (e.g. Alzheimer's disease), promising results have been achieved with DTI (3,10,11). Additionally, DTI has been used to explore the damage of white matter tracts in patients with traumatic brain injury (5,12). In schizophrenic patients, white matter disruptions have been found with DTI in several studies (13–15).
Reduced FA values and increased ADC values are related to microstructural brain damage. Lower FA values can be attributed to a loss of axons or a damage of myelin sheaths. ADC increases when overall diffusion increases as for instance in inflammation and swelling. Generally, high FA values are considered indicators for white matter integrity (3).
In this study, we examined how general systemic and environmental factors affect the brain microstructure of healthy adults. Several studies have shown age-related alterations. According to these studies, lower FA and higher ADC values are associated with healthy aging (16–20). It is shown in many studies that men and women have dissimilarities in their brain microstructure (16,21–24), though the particular gender-related differences between the brain regions still remain unclear. Chronic alcohol abuse as well as tobacco smoke toxins and nicotine leads to the damage of brain microstructure (25–29). Contrary to earlier studies, we especially wanted to examine the effects of moderate alcohol consumption on brain white matter integrity. Cerebral DTI in relation to education has been less investigated.
In general, the literature on possible factors affecting cerebral DTI results is relatively sparse and reported studies vary considerably in design and characteristics of the study population. Confounding factors should be routinely considered when DTI results are interpreted. Therefore better understanding of confounding factors is crucial.
The aim of our study was to investigate whether age, gender, smoking, alcohol consumption, and education have a notable effect on the cerebral DTI parameters in a healthy adult population. This was examined by using FA and ADC values derived from ROI analysis. Intra-observer repeatability measurements were performed to further support the results.
Material and Methods
Subjects
The subjects were recruited among consecutive patients with ankle trauma (fracture or distension) in the Emergency Department of Tampere University Hospital. A total of 609 patients with ankle injury were screened for inclusion. The aim was to enrol five male and five female participants to each of the following age groups: (i) 18–30 years; (ii) 31–40 years; (iii) 41–50 years; and (iv) 51–60 years. The inclusion criteria were: (i) age 18–60 years, (ii) being a resident of the university hospital district; and (iii) ankle trauma. Exclusion criteria were: (i) neurological problems (including abnormalities on neuroimaging); (ii) psychiatric problems; (iii) history of traumatic brain injury; (iv) former neurosurgical procedure; (v) problems with hearing or vision; (vi) first language other than Finnish; (vii) MRI contraindications; and (viii) refusal to participate. Of the final sample of 40 healthy subjects, 20 (50%) were men and 20 (50%) were women. Mean ages (SD) were: whole sample 40.4 (12.3) years; men, 39.8 (11.8) years; and women 41.1 (13.2) years. None of the subjects had significant structural abnormalities on conventional MRI sequences. Primarily, three enrolled subjects had white matter abnormalities (vascular lesions and microangiopathy) on conventional MRI. However, these subjects were excluded from the final sample of 40. Written informed consent was obtained from each participant according to the Declaration of Helsinki. Ethics approval for the study was obtained from the Ethical Committee of the Pirkanmaa Hospital District.
Clinical assessment
All the subjects were interviewed by phone. Interview included: (i) diagnosed medical conditions; (ii) regular daily medication; (iii) years of education; (iv) smoking history (pack years); and (v) alcohol consumption according to the Alcohol Use Disorders Identification Test (AUDIT) (30).
Magnetic resonance imaging
MRI of the head was performed with a 3 Tesla MRI scanner (Siemens Trio, Siemens Medical Solutions, Erlangen, Germany). A 12-channel head coil and a 4-channel neck coil were used simultaneously. The MRI protocol included sagittal T1-weighted 3D IR-prepared gradient echo, axial T2-weighted turbo spin echo, conventional axial and high-resolution sagittal FLAIR (Fluid Attenuation Inversion Recovery), axial T2*-weighted, and axial SWI (susceptibility weighted imaging) series. The DTI data were collected by a single-shot, spin echo-based, and diffusion-weighted echo planar imaging sequence. The parameters for the DTI sequence were: TR, 5144 ms; TE, 92 ms; FOV, 230 mm; matrix, 128 × 128; 3 averages; slice/gap, 3.0/0.9 mm; voxel dimension, 1.8 × 1.8 × 3.0 mm; b-factor, 0 and 1000 s/mm2; and 20 diffusion gradient orientations. A 12-channel head matrix coil was used. Evaluation of the conventional MRI scans was performed by a neuroradiologist (AB).
Diffusion tensor analysis
DTI measurements were performed by a physicist (UH) on a workstation using the
commercially available software Neuro3D (Siemens Healthcare, Malvern, PA, USA).
Circular ROIs (19 mm2) were manually placed on color-coded axial
fractional anisotropy (FA) maps and automatically transferred on the
non-diffusion-weighted b0 images and ADC maps. The ROIs were placed
at the following anatomical locations: (i) the cerebral peduncle (CP); (ii)
posterior limb of the internal capsule (PLIC) (anterior and posterior); (iii)
posterior part of the corona radiata (PCR) (anterior and posterior); (iv)
centrum semiovale (CS) (anterior, center, and posterior); (v) corpus callosum
(CC) (genu and splenium); (vi) uncinate fasciculus (UF); (vii) forceps minor
(FM); and (viii) thalamus (Fig.
1). The ROIs were placed taking care to avoid border areas, such as
areas overlapping with cerebrospinal fluid spaces and neighboring tracts. The
ROIs were placed bilaterally, with the exception of the CC, on all locations.
The ROIs of the CC were drawn on the midline sagittal images. Median and mean
values for individual measurements, as well as standard deviations, for FA and
ADC were calculated. The freehand ROI method was used with FM, UF, and thalamus
because of its better repeatability compared with the circle ROI method (2). All the DTI
measurements were repeated to the whole sample (n = 40) by the
same physicist in order to assess intra-observer repeatability. Anatomic locations of the circle ROIs in the
DTI measurements. (a) cerebral peduncle, (b) posterior limb of the
internal capsule (anterior and posterior), (c) posterior part of the
corona radiata (anterior and posterior), (d) centrum semiovale
(anterior, center, and posterior), (e) uncinate fasciculus, (f)
forceps minor, (g) thalamus, (h) corpus callosum (genu and
splenium).
Statistical analysis
The normality of the variable distributions was tested using the Shapiro-Wilk test. Constant variables (age, education years, pack years, AUDIT, and AUDIT-C), FA and ADC values were analyzed with the Pearson (normal distribution) and Spearman (skewed distribution) correlation coefficients. Age was grouped into four groups: (i) 18–30 years; (ii) 31–40 years; (iii) 41–50 years; and (iv) 51–60 years. Years of education was grouped into three groups: (i) 8–12 years, n = 12; (ii) 13–15 years, n = 17; and (iii) ≥16 years, n = 11. Pack years was divided into three groups: (i) non-smokers, n = 23; (ii) 0–9 pack years, n = 9; and (iii) ≥10 pack years, n = 8. Both AUDIT and AUDIT-C were divided into risk (n = 10) (AUDIT, men: ≥8 and women: ≥7 points; AUDIT-C: men: ≥4 and women: ≥3 points) and non-risk alcohol users (n = 30). The categorical variables were tested with the Student's t-test (normal distribution) and the Mann-Whitney U-test (skewed distribution). Additionally, Cohen's d-values (d) were calculated when appropriate. The intra-observer repeatability values were assessed using the averages of intra-class correlation coefficients (ICCs) with absolute agreement. The ICC values were considered to indicate excellent agreement if they were greater than 0.8 and substantial agreement if they were in the range of 0.60–0.79 (31). The measured regions with an ICC of lower than 0.60 were omitted from further statistical analyses. The omitted FA measurement regions included: (i) right anterior CS; (ii) left posterior CS; (iii) right central CS; and (iv) left central CS. Left anterior PCR was left out of the ADC measurement regions. The statistical significance level was set to P <0.05 for all analyses. There was no need to control for false discovery rates as only one to two statistical tests were used to address an individual hypothesis (32). IBM SPSS Statistics 20.0 (IBM Corp., Armonk, NY, USA) was used to perform the analyses.
Results
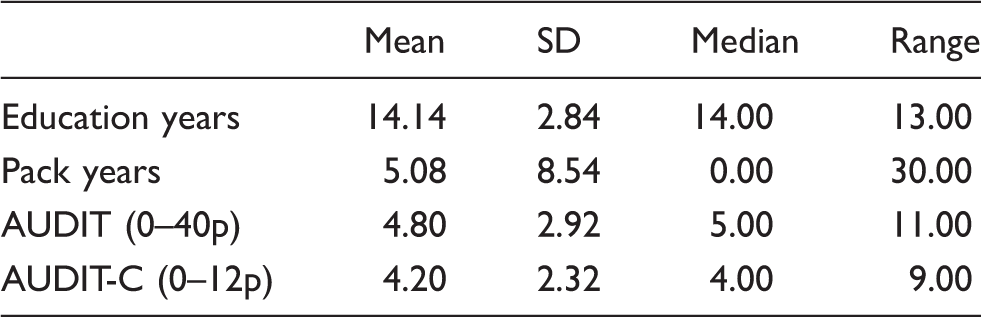
Characteristics of the study sample and DTI parameters
Detailed characteristics of the study sample.
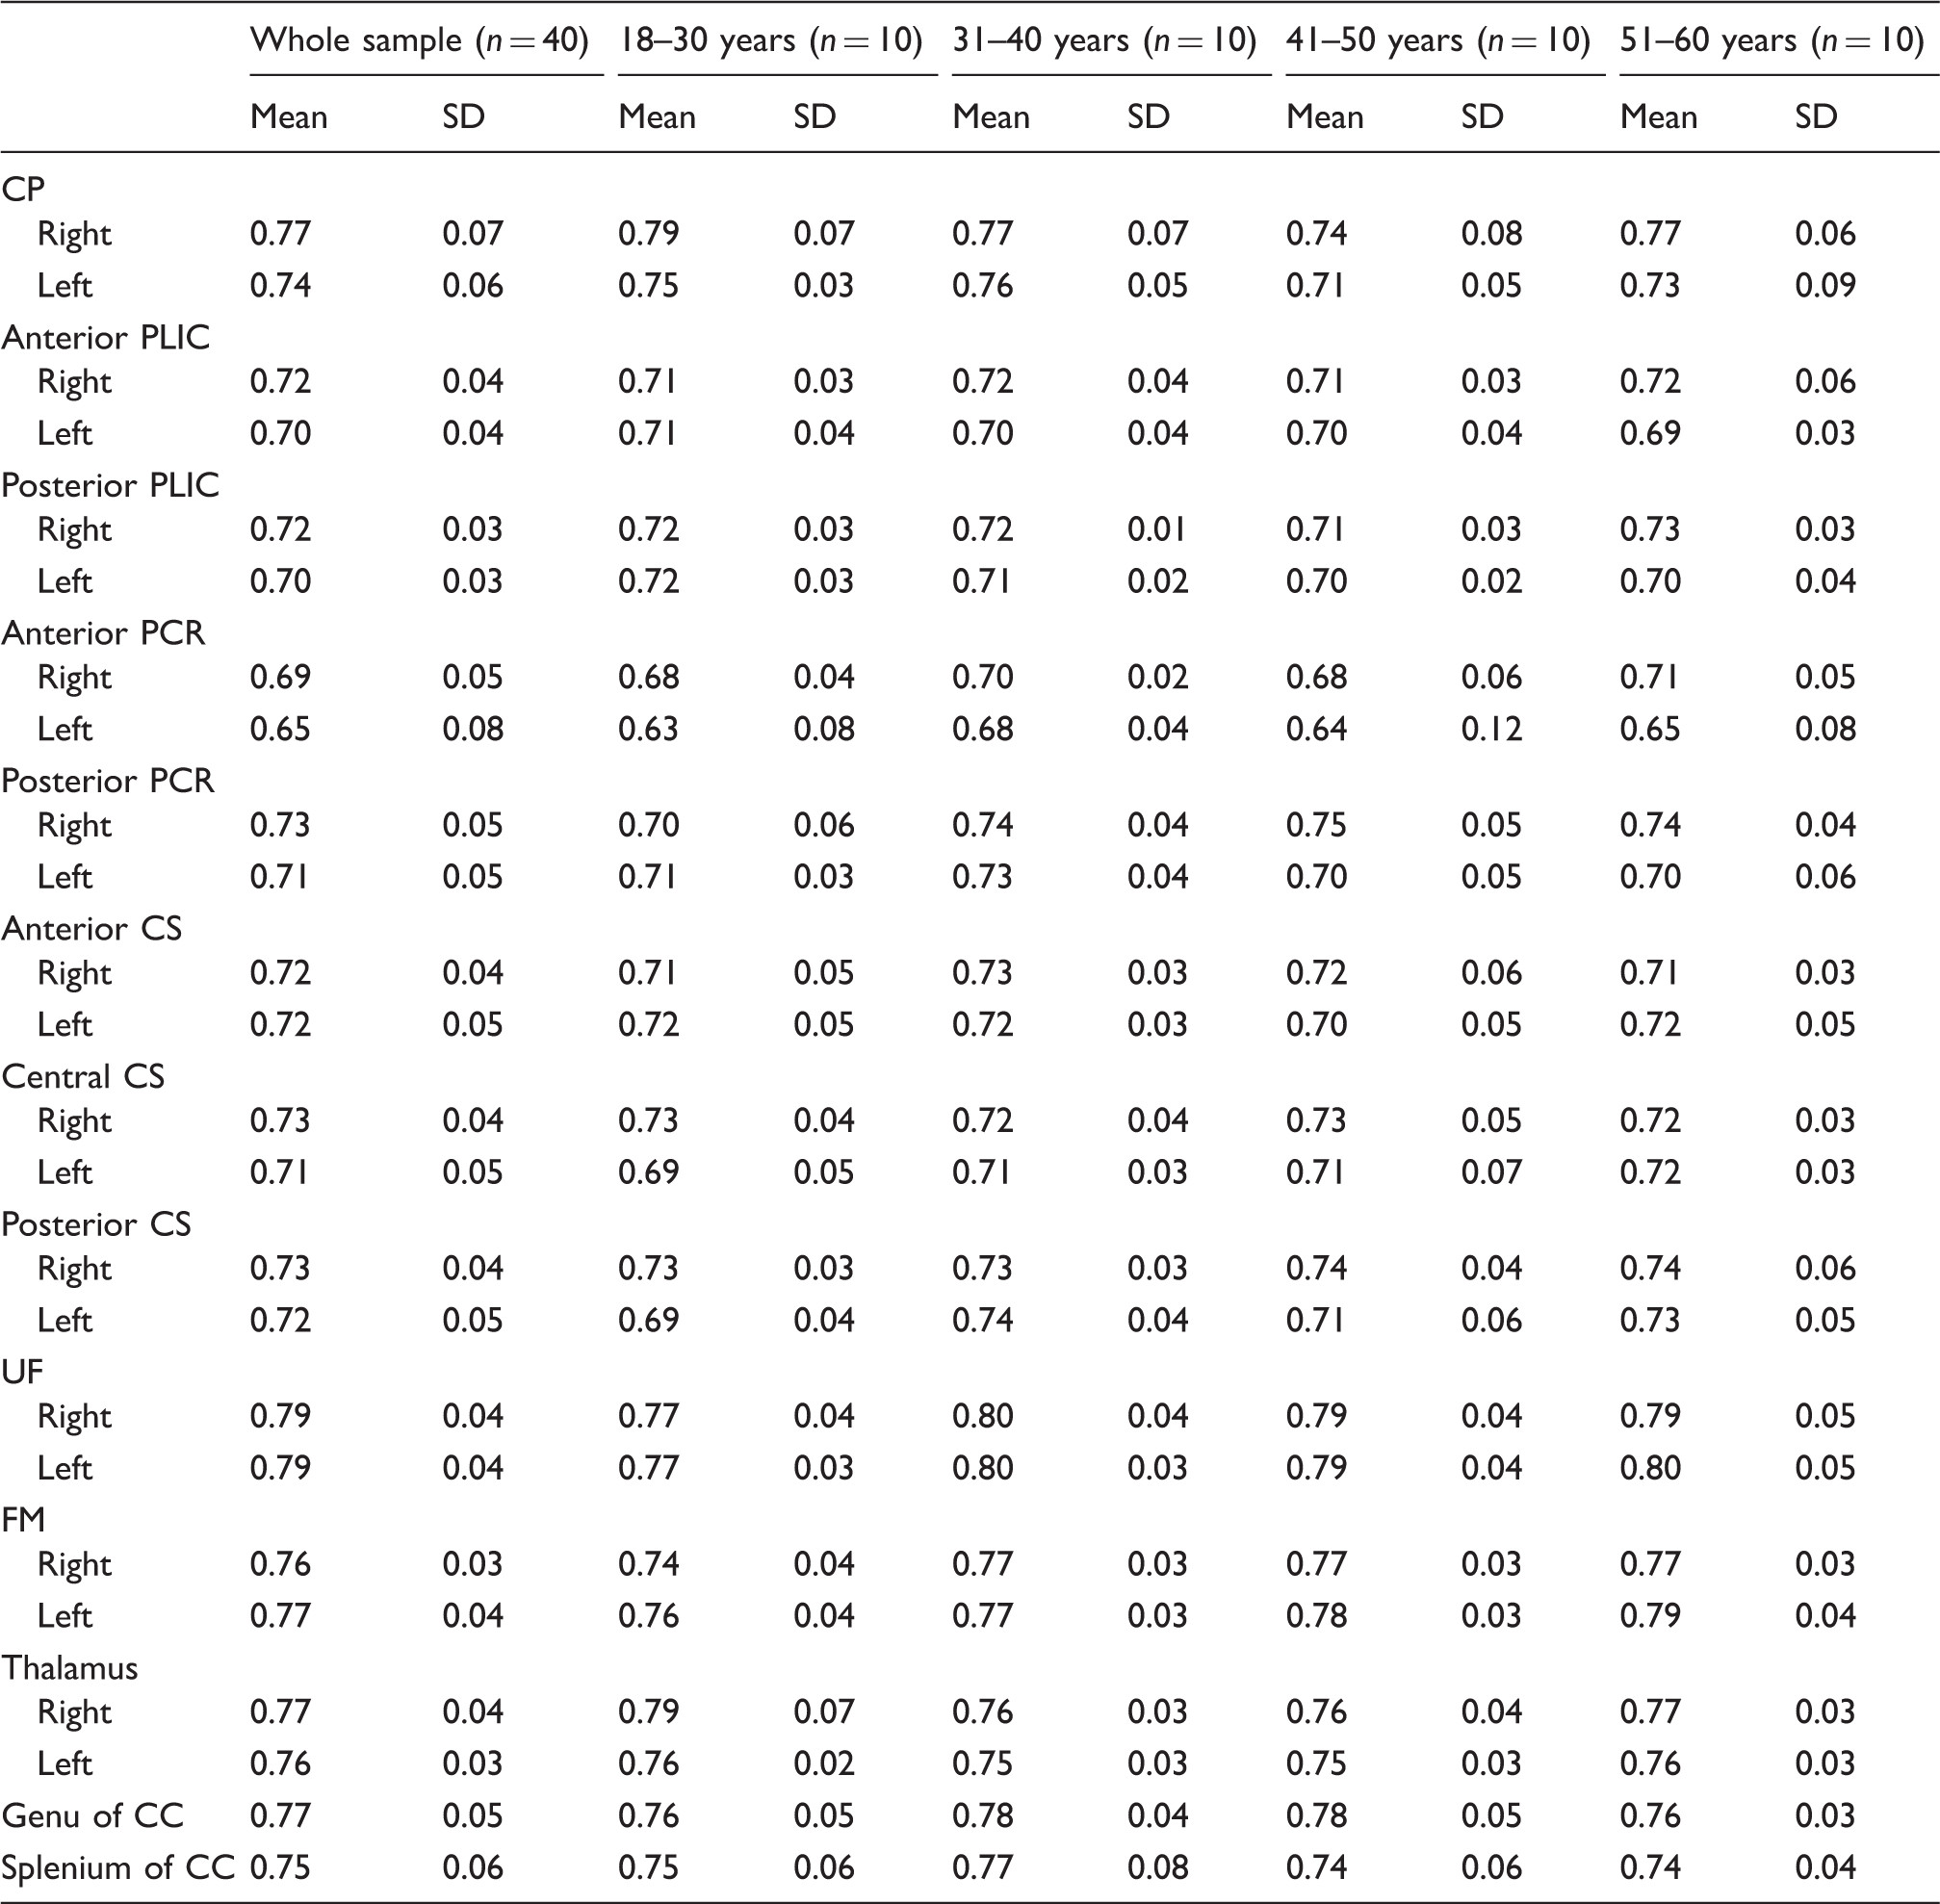
FA values by ROI and stratified by age. 0 ≤ FA ≤ 1.

ADC values by ROI and stratified by age. ADC × 10−3mm2/s.
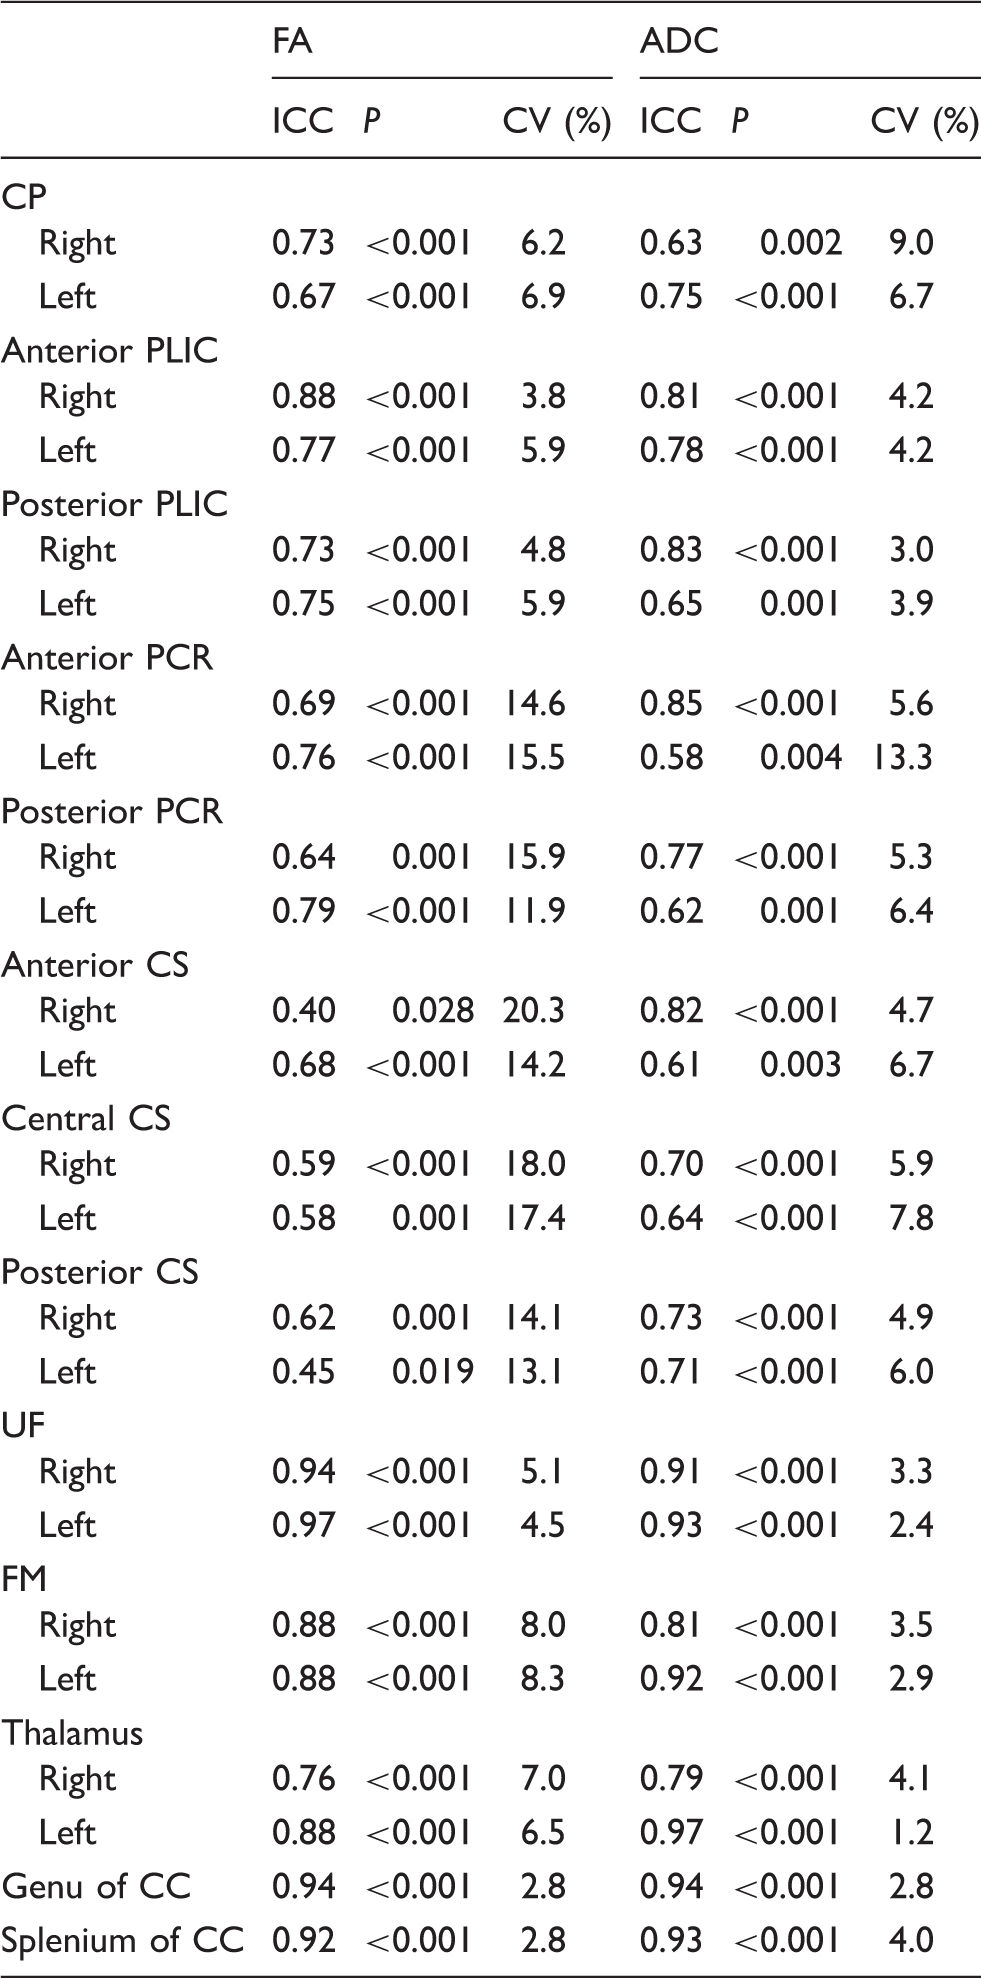
Repeatability and variation of the DTI measurements
Intra-class correlation and variation coefficients of FA and ADC measurements. ADC×10−3 mm2/s; 0 ≤ FA ≤ 1.
The relations between FA values and possible confounding factors
A significant negative correlation between FA and age was found in the right FM (r = 0.39; P = 0.01), the left FM (r = 0.41; p = 0.01), the right UF (r = 0.33; P = 0.04), the left UF (r = 0.41; P = 0.01), and the splenium of CC (r = 0.32; P = 0.05). In addition, the analysis showed significant differences between the age groups in the right FM (P = 0.05), the left UF (P = 0.02), and the left CP (P = 0.03). The absolute FA values of the age groups are represented in Table 2. The risk users of alcohol (according to AUDIT) (n = 10) exhibited lower FA values than the non-risk users (n = 30) in the left posterior PCR (P = 0.02; d = 0.06) and right thalamus (P = 0.03; d = 0.17), but higher values in the right FM (P = 0.03; d = 0.20). Lower FA values in the right thalamus (P = 0.01; d = 0.28) and higher FA values in the right FM (P = 0.01; d = 0.05) were also found in the analysis of the AUDIT-C. Apart from this, the AUDIT-C analysis showed also elevated FA values in the right posterior CS (P = 0.03; d = 0.37) of the risk users (n = 12) compared to the non-risk users (n = 28). Significant correlations or differences between FA values and gender or education years were not found.
The relations between ADC values and possible confounding factors
ADC values of the women (n = 20) were higher than the values of the men (n = 20) in the left central CS (P = 0.01). In the other brain regions no gender differences were found. A positive correlation between ADC values and education was discovered in the splenium of CC (r = 0.32; P = 0.05). Additionally, the analysis of the categorical variables showed significant differences in the splenium of CC between the education groups (P = 0.01). The group with over 16 years of education (n = 11) had higher ADC values (ADC = 0.79) than the groups with 8–12 years (ADC = 0.75) (n = 12) and 13–15 years (ADC = 0.72) (n = 17) of education. The correlation analyses revealed a significant negative correlation between ADC and smoking in the right anterior CS (rs = 0.37; P = 0.02). ADC values did not differ significantly between the three pack year groups. The risk users of alcohol had significantly lower ADC values than the non-risk users in the right anterior PCR (P = 0.05; d = 0.37) and the left anterior CS (P = 0.01; d = 0.15). In the analysis of AUDIT-C lower ADC values among the risk users were also discovered in the left anterior CS (P = 0.02; d = 0.12). Statistically significant correlations or differences between ADC values and age were not found.
Discussion
The present study aimed to investigate the effects of possible confounding systemic factors (age, gender, smoking, alcohol consumption, and education) on DTI parameters derived from ROI analysis in a generally healthy homogenous sample with no neurological or psychiatric diseases. The most consistent finding was that aging decreased FA values in the frontal brain regions. Regarding the other confounding factors, the results were discontinuous and no concrete conclusions could be drawn from these findings.
We found a significant negative correlation between FA and age in the right FM, left FM, right UF, left UF, and splenium of CC. Respectively, the analysis also showed non-linear significant differences between the age groups in the right FM, left UF, and left CP. Kochunov et al. observed that the anterior part of CC is more vulnerable to age-related decline than the posterior part (17). Many other studies have also indicated that age-related changes are most likely to happen first in the frontal areas of the brain (19,20). Hsu et al. had 145 participants, aged 30–80 years, recruited from a health screening program. Both ROI and VBA methods were used. They reported a positive correlation between FA and age in the posterior CC, CR, posterior internal capsule, and superior longitudinal fasciculus (16). Yoon and colleagues used only ROI analysis to examine 58 healthy volunteers aged 22–78 years. They showed a trend of increased ADC and decreased FA values with advanced aging. The significant decrease in FA was found in numerous brain regions (20).
Increased FA values in men compared to women are reported in numerous studies (16,18,22,24). Contrary to this, no gender-related differences in FA values were observed in our sample. For example, Pal et al. discovered higher FA values among men in the caudate nucleus, genu, and splenium of CC, PLIC, and anterior limb of the internal capsule by using ROI analysis (24). The study population consisted of 57 women and 85 men (age range, 10–52 years) (24). By using VBA-based method, Inano et al. investigated gender effects on FA, axial diffusivity, and radial diffusivity (22). Significantly higher FA values were seen in men compared to women in many anatomic regions, for example in the splenium of CC, PLIC, CP, and corona radiata. Participants in this study were 857 healthy volunteers, 310 women and 547 men, with an age range of 24.9–84.8 years (mean age, 56.1 ± 9.9 years) (22). In contrast, women had higher FA values in the CC according to Kanaan et al. (23). In the investigations by Pal and Inano, no significant gender differences in mean diffusivity (MD) values were found. In our sample, women had higher ADC values in the left central CS compared to men (22,24). No similar results in this particular region have been recently reported. Whereas, Lebel et al. showed higher MD values in women in the corticospinal tract, cingulum, and superior longitudinal fasciculus (18).
With regard to DTI parameters and smoking, a significant negative correlation between ADC and pack years was found only in the right anterior CS. In all brain regions, FA values were unrelated to smoking. Prior to our findings, three DTI studies have demonstrated reduced gray matter density in the lateral prefrontal cerebral cortex in relation to smoking (33–35). The findings on gray matter volume or density in other brain regions are mixed. Yu et al. found increased white matter density in the putamen and cingulate cortex among smokers by using VBA. Their results were based on the data of 16 cigarette smokers and 16 matched healthy non-smoking controls (36). Moreover, Paul and co-authors reported higher FA values in smokers (n = 10) compared to non-smokers (n = 10) in the CC by using ROI analysis (37).
We found that the risk users of alcohol had lower FA values than the non-risk users in the left posterior PCR and right thalamus, but higher values in the right FM and right posterior CS. Lower ADC values among the risk users compared to the non-risk users were found in the right anterior PCR and left anterior CS. Chronic alcohol abuse leads to reduced white and gray matter volume (25–29). However, little is known about the effects of moderate alcohol consumption. By using tract-based spatial statistics, McQueeny et al. studied white matter integrity among adolescent binge drinkers (n = 14) compared to controls (n = 14) without a history of a binge drinking episodes (38). They found lower FA values in the binge drinkers compared to controls in 18 white matter areas (including CC, CR, and limbic projection fibers) (38). Pfefferbaum et al. concluded that chronic alcohol consumption leads to the demyelination of white matter tracts (27). Their earlier studies also showed that the CC is very vulnerable to alcohol (28,29).
To our knowledge, only few studies have examined cerebral DTI metrics in relation to education. Piras et al. reported a negative correlation between MD values and education in the hippocampi, right caudate, thalami, and putamen, but it is unclear if the relationship was mediated by age. The study population was consisted of 150 healthy subjects (age range, 18–65 years) (39). Teipel and co-authors reported that higher white matter integrity was associated with more years of education among 18 healthy controls (mean age, 66.2 years) in the medial temporal lobe areas, fusiform gyrus, insula, superior temporal gyrus, and lingual gyrus (40). In our study, the most educated subjects (16 years or more education) had the highest ADC values in the splenium of CC compared to the other groups. Moreover, a positive correlation between ADC and education was discovered in the same brain region. There was no correlation between age and years of education. Therefore, aging does not explain these findings. None of the previous studies have observed similar ADC results. These spurious and quite contradictional findings seem clinically trivial.
Intra-class correlation analysis revealed that the best repeatability for both FA and ADC values was in the UF, FM, thalamus, and CC. ADC values had better overall repeatability and lower variation than FA values. The low ICC values were found for FA in the CS and the variation was highest for FA in the PCR and CS. The repeatability of the freehand measurements has improved in the frontobasal areas compared to our earlier study (2). The most probable explanation is the increased experience that enables better avoidance of artefacts and border areas.
The main limitation of our study was the low statistical power in some subgroup analysis due to the small sample sizes. In addition, strict exclusion criteria limit the generalizability of the results. Also, our sample only included patients with moderate alcohol consumption (AUDIT ≤10). If the AUDIT score exceeded 10 points, the patient's alcohol consumption habits were considered generally detrimental and the patient was excluded from the study. Thus, the study design did not entitle us to examine the effects of heavy alcohol usage.
Despite the aforementioned limitations, the current study has several strengths. First, we minimized the effects neurological and psychiatric diseases on DTI parameters by applying thorough exclusion criteria and patient screening. Second, the performed data collection was inclusive and detailed. Third, the DTI measurement protocol included the majority of the brain regions studied in DTI literature.
In conclusion, age should be noted as a considerable confounding factor in ROI-based DTI analysis. More research on the effects of gender, smoking, alcohol consumption, and education is needed. Replication of this study design using other DTI methods (e.g. tract-based spatial statistics, tractography) and possibly additional parameters (e.g. axial and radial diffusivity) is encouraged. Familiarity with the normal variation and repeatability of DTI parameters is essential when measurements are interpreted in clinical practice.
Footnotes
Acknowledgements
The authors thank research assistants Anne Simi for her contribution in data collection.
Conflict of interest
None declared.