
Abstract
Introduction
We evaluated the relationship between adipokine plasma concentrations and body fat distribution and the metabolic syndrome.
Methods
In a cohort of 1215 patients with clinically manifest vascular disease the relation between subcutaneous adipose tissue, visceral adipose tissue, waist circumference, body mass index and plasma concentrations of adipsin, chemerin, monocyte chemoattractant protein-1, migration inhibitory factor, nerve growth factor, resistin, plasma amyloid A1, adiponectin, leptin, plasminogen activator inhibitor-1 and hepatic growth factor were cross-sectionally assessed with linear regression and adjusted for age and gender. The relation between adipokines and the metabolic syndrome was cross-sectionally evaluated using logistic regression. An adipokine profile was developed to measure the effect of combined rather than single adipokines.
Results
Adiposity was related to higher nerve growth factor, hepatic growth factor, migration inhibitory factor, leptin and adipsin and with lower chemerin, plasminogen activator inhibitor-1, resistin, plasma amyloid A1 and adiponectin. The strongest positive relations were between body mass index and adipsin (β 0.247; 95% CI 0.137–0.356) and leptin (β 0.266; 95% CI 0.207–0.324); the strongest negative relations were between body mass index and plasma amyloid A1 (β –0.266; 95% CI –0.386 to –0.146) and visceral adipose tissue and adiponectin (β –0.168; 95% CI –0.226 to –0.111). There was no relation between subcutaneous adipose tissue and adipokines. Odds for the metabolic syndrome were higher with each 1 SD higher hepatic growth factor (OR 1.21; 95% CI 1.06–1.38) and leptin (OR 1.26; 95% CI 1.10–1.45) and lower with each 1 SD higher adiponectin (OR 0.73; 95% CI 0.64–0.83) and resistin (OR 0.85; 95% CI 0.74–0.97). The adipokine profile was related to the metabolic syndrome (OR 1.03; 95% CI 1.00–1.06).
Conclusion
Plasma concentrations of adipokines are related to obesity and body fat distribution. The relation between adipokine concentrations and the metabolic syndrome is independent of visceral adipose tissue.
Keywords
Introduction
The quantity of adipose tissue is a major driver of adipose tissue dysfunction (ATD) leading to metabolic derangements such as insulin resistance, low-grade inflammation, dyslipidaemia and elevated blood pressure. 1 Although 10–40% of the obese population is metabolically healthy, they have a higher risk of subclinical and clinical atherosclerosis than normal weight metabolically healthy individuals.2,3 On the other hand, 5–8% of the healthy weight population is ‘metabolically obese’.4,5 This can be explained by the fact that ATD may also be present in the absence of obesity.4,5 Apparently, ATD in an individual who is considered to be at healthy weight may also lead to metabolic changes, ultimately leading to the development of the metabolic syndrome, diabetes mellitus type 2 (DM2) and cardiovascular disease.4,5 Adipose tissue dysfunction is characterised by an imbalance between the production of pro and anti- inflammatory adipokines. These adipokines can either be produced by adipocytes or by the vascular stromal fraction in adipose tissue, containing macrophages, 6 contributing to insulin resistance and endothelial dysfunction. 7 As a consequence, metabolic risk factors such as hypertriglyceridaemia, low high-density lipoprotein cholesterol and chronic low-grade inflammation occur, being causal factors in the development of cardiovascular disease and DM2.8,9 Pathophysiological mechanisms that underlie the development of ATD in the absence of obesity are exogenous factors such as physical inactivity10,11 and the dietary intake of saturated fat,12,13 as well as endogenous susceptibility such as a low birth weight, 14 genetic predisposition 15 and sympathetic nervous system activity. 16
As ATD exists most abundantly, but not exclusively, in patients with obesity, the production of adipokines is not likely to be totally dependent on adipose tissue quantity. However, plasma levels of many pro-inflammatory adipokines such as chemerin, 17 retinol-binding protein-4, 18 leptin, 19 lipocalin-2 and monocyte chemoattractant protein 1 (MCP-1) 20 and the anti-inflammatory adipokine adiponectin18,21,22 are related to general adiposity as well as to intra-abdominal fat. Upper body subcutaneous fat could be a new adipose tissue depot of interest, because this is related to arterial stiffness. 23 Higher concentrations of chemerin 24 and leptin,25,26 and lower concentrations of adiponectin 27 are associated with the presence of the metabolic syndrome and cardiovascular disease.
In the present study we evaluated the relation between plasma concentrations of 11 adipokines and different measures of general adiposity (body mass index (BMI), waist circumference (WC)) and body fat distribution (subcutaneous adipose tissue (SAT) and visceral adipose tissue (VAT)) and the metabolic syndrome in a cohort of patients with clinically manifest vascular disease.
Materials and methods
Study design and patients
The study cohort consisted of patients participating in the Second Manifestations of ARTerial disease-Magnetic Resonance (SMART-MR) study, a prospective study in patients with clinically manifest vascular disease. Details of the design and participants have been described elsewhere.28,29 In brief, between May 2001 and December 2005, patients newly referred to the University Medical Center Utrecht with recent (i.e. within 6 months prior to inclusion) manifest vascular disease, coronary artery disease (CAD), cerebrovascular disease (CVD), peripheral arterial disease (PAD) or an aortic abdominal aneurysm (AAA) were invited to participate. CAD was defined as a recent diagnosis of angina pectoris, myocardial infarction or coronary revascularisation. CVD was defined as a recent diagnosis of ischaemic stroke, transient ischaemic attack or amaurosis fugax. PAD was defined as a recent clinical diagnosis of PAD (Fontaine stage 2, 3 or 4). For each patient, the presence or absence of the metabolic syndrome was determined. We defined the metabolic syndrome according to the National Cholesterol Education Program criteria 30 as the presence of three or more of the following characteristics: WC greater than 102 cm (men) or greater than 88 cm (women); triglycerides 1.7 mmol/L or greater; high-density lipoprotein less than 1.29 mmol/L (women) or less than 1.00 mmol/L (men); blood pressure 130/85 mmHg or greater; fasting glucose 5.6 mmol/L or greater.
AAA was defined as an abdominal aortic aneurysm of 3.0 cm or greater or recent abdominal aortic surgery. Patients with terminal malignant disease, those not independent in daily activities and not sufficiently fluent in Dutch were not included. The medical ethics committee approved the study and all patients gave written informed consent. After inclusion, patients underwent a standardised vascular screening including measurements of the vascular risk factors, non-invasive measurement of subclinical atherosclerosis and magnetic resonance imaging of the brain. Risk factors, medical history and functioning were assessed with questionnaires that the patients completed prior to their visit. A total of 1309 patients with clinically manifest vascular disease were included in the SMART-MR study, in 1215 of whom adipokine concentrations and adiposity measurements were available and eligible for cross-sectional analyses.
Adiposity measurements
BMI, WC, SAT and VAT were measured in this cohort. BMI was calculated by weight (kg)/height (m) 2 . WC was measured halfway between the lower rib and the iliac crest in a standing position. B-mode ultrasound of the abdomen was obtained to measure visceral and subcutaneous adipose tissue and was performed by well-trained registered vascular technologists in a certified vascular laboratory. Ultrasonographic measurements were performed in a supine position using an ATL HDI 3000 ultrasound device (Philips Medical Systems, Eindhoven, The Netherlands) with a C4-2 transducer. There was no bowel preparation performed before the ultrasound measurement. VAT was ultrasonographically measured as the distance between the peritoneum and the lumbar spine using electronic callipers. A strict protocol was used, including the position of the transducer and pressure applied on the transducer. The transducer was placed in a straight line drawn between the left and right midpoints of the lower rib and the iliac crest. Measurements were performed at the end of a quiet expiration, applying minimal pressure without displacement or compression of the abdominal cavity. The distance was measured three times at slightly different positions; the VAT was calculated as the mean value of these three measurements. Previously, the ultrasound protocol for measuring VAT was validated with computed tomography (CT) at our centre. 31 Ultrasonographic measurements were strongly associated with CT measurements of VAT; Pearson’s correlation coefficient was 0.81 (P < 0.001). Also, an interobserver coefficient of variation of 5.4% was found for ultrasound measurements of VAT, indicating good reproducibility. For determining subcutaneous fat, the distance between the linea alba and the skin was measured. Abdominal muscles were thus excluded for intra-abdominal and subcutaneous fat measurements.
Measurement of plasma concentrations of adipokines
Adipokines were measured in plasma which had been stored at –80° celsius within hours after collection. The plasma concentrations of the adipocytokines MCP-1, nerve growth factor (NGF), hepatic growth factor (HGF), migration inhibitory factor (MIF), adiponectin, adipsin, chemerin, resistin, plasma amyloid A1 (SAA1), plasminogen activator inhibitor 1 (PAI-1), interferon gamma inducible protein-10 (IP-10) and leptin were measured with a microbead-based Luminex multiplex immunoassay (Bio-Rad, Munich, Germany). These specific adipokines were chosen for their effects on different (patho)physiological mechanisms; inflammation, coagulation and glucose metabolism. Fluorophore-labelled microbeads were coated with specific monoclonal antibodies against the aforementioned proteins. The beads coated with capture antibodies were used together with secondary biotinylated antibodies. Measurements and data analysis of all assays were performed on the Bioplex system in combination with Bioplex manager software (Biorad). The multiplex immunoassay results correlated significantly with enzyme-linked immunosorbent assay measurements. All adipokine concentrations were reported in ng/L. The analysis protocol as well as the characteristics of the assay have been published previously. 32 Plasma high-sensitivity C-reactive protein (hsCRP) was measured by immunonephelometry (Nephelometer Analyzer BN II; Dade-Behring, Marburg, Germany) with a lower detection limit of the test of 0.2 mg/l. As high CRP concentrations may have a different pathophysiological origin than low-grade inflammation, as seen in obesity and vascular diseases, individuals with CRP concentrations greater than 15 mg/L (n = 53) were excluded from the analyses. Insulin sensitivity was calculated with the homeostasis model assessment of insulin resistance (HOMA-IR) with the formula: [fasting insulin (mU/l) * fasting glucose (mmol/l)]/22.5. HOMA-IR was not calculated in patients using exogenous insulin.
Data analyses
Mean and standard deviation (SD) are reported if continuous variables were normally distributed and median and interquartile range if distributions were skewed. Categorical variables are expressed as percentages (numbers). Concentrations of adipokines were log-transformed, due to a skewed distribution. The relation between measures of adiposity and adipokine concentrations was quantified with linear regression analyses. As IP-10 showed a skewed distribution even after log-transformation, this adipokine was only used in the ‘adipokine profile’. Results are expressed as beta regression coefficients (β) and 95% confidence intervals (CIs) denoting the change in adipokine concentration per SD increase in adiposity measurements. Three models were used to estimate this relation. Firstly, a model was made without adjustments for the potential confounders. Secondly, a model was made with adjustments for the potential confounders gender and age. In the third model, additional adjustments were made for current smoking, lipid-lowering therapy, history of DM2 and hsCRP.
The relation between adipokines and (characteristics of ) the metabolic syndrome was assessed with logistic regression analysis. As we hypothesise that the metabolic syndrome is the consequence of the combination of various pro and anti-inflammatory adipokines, rather than the effect of single adipokines, we developed an ‘adipokine profile’. The adipokine profile was constructed weighing all adipokines equally and not taking into account their correlations, not aiming on predicting individual risk, but being hypothesis generating. All adipokines were divided into quartiles, patients in the most favourable quartile regarding cardiovascular risk received 1 point, patients in the least favourable quartile received 4 points. As this was performed for all patients with all 11 adipokines, a profile from 11 to 44 was possible. Also, the relation between single adipokines and (characteristics of) the metabolic syndrome was assessed. Results are expressed as odds ratios (ORs) with 95% CIs. For these analyses, only data from patients without DM2 were used, because DM2 can be regarded as an ultimate consequence of the metabolic syndrome and would therefore influence the results. Two models were used, an unadjusted model and a model adjusted for age and gender. No other additional adjustments were performed, because possible confounders (such as hsCRP) can also be seen as intermediates in the relation between adipokines and the metabolic syndrome. To reduce bias and to improve statistical efficiency, missing values for visceral fat thickness (n = 8), subcutaneous fat thickness (n = 21), BMI (n = 1), WC (n = 52), smoking status (n = 9) and estimated glomerular filtration rate (n = 14) were completed in the dataset by single regression imputation.
Results
Baseline characteristics
Baseline characteristics according to tertiles of waist circumference.
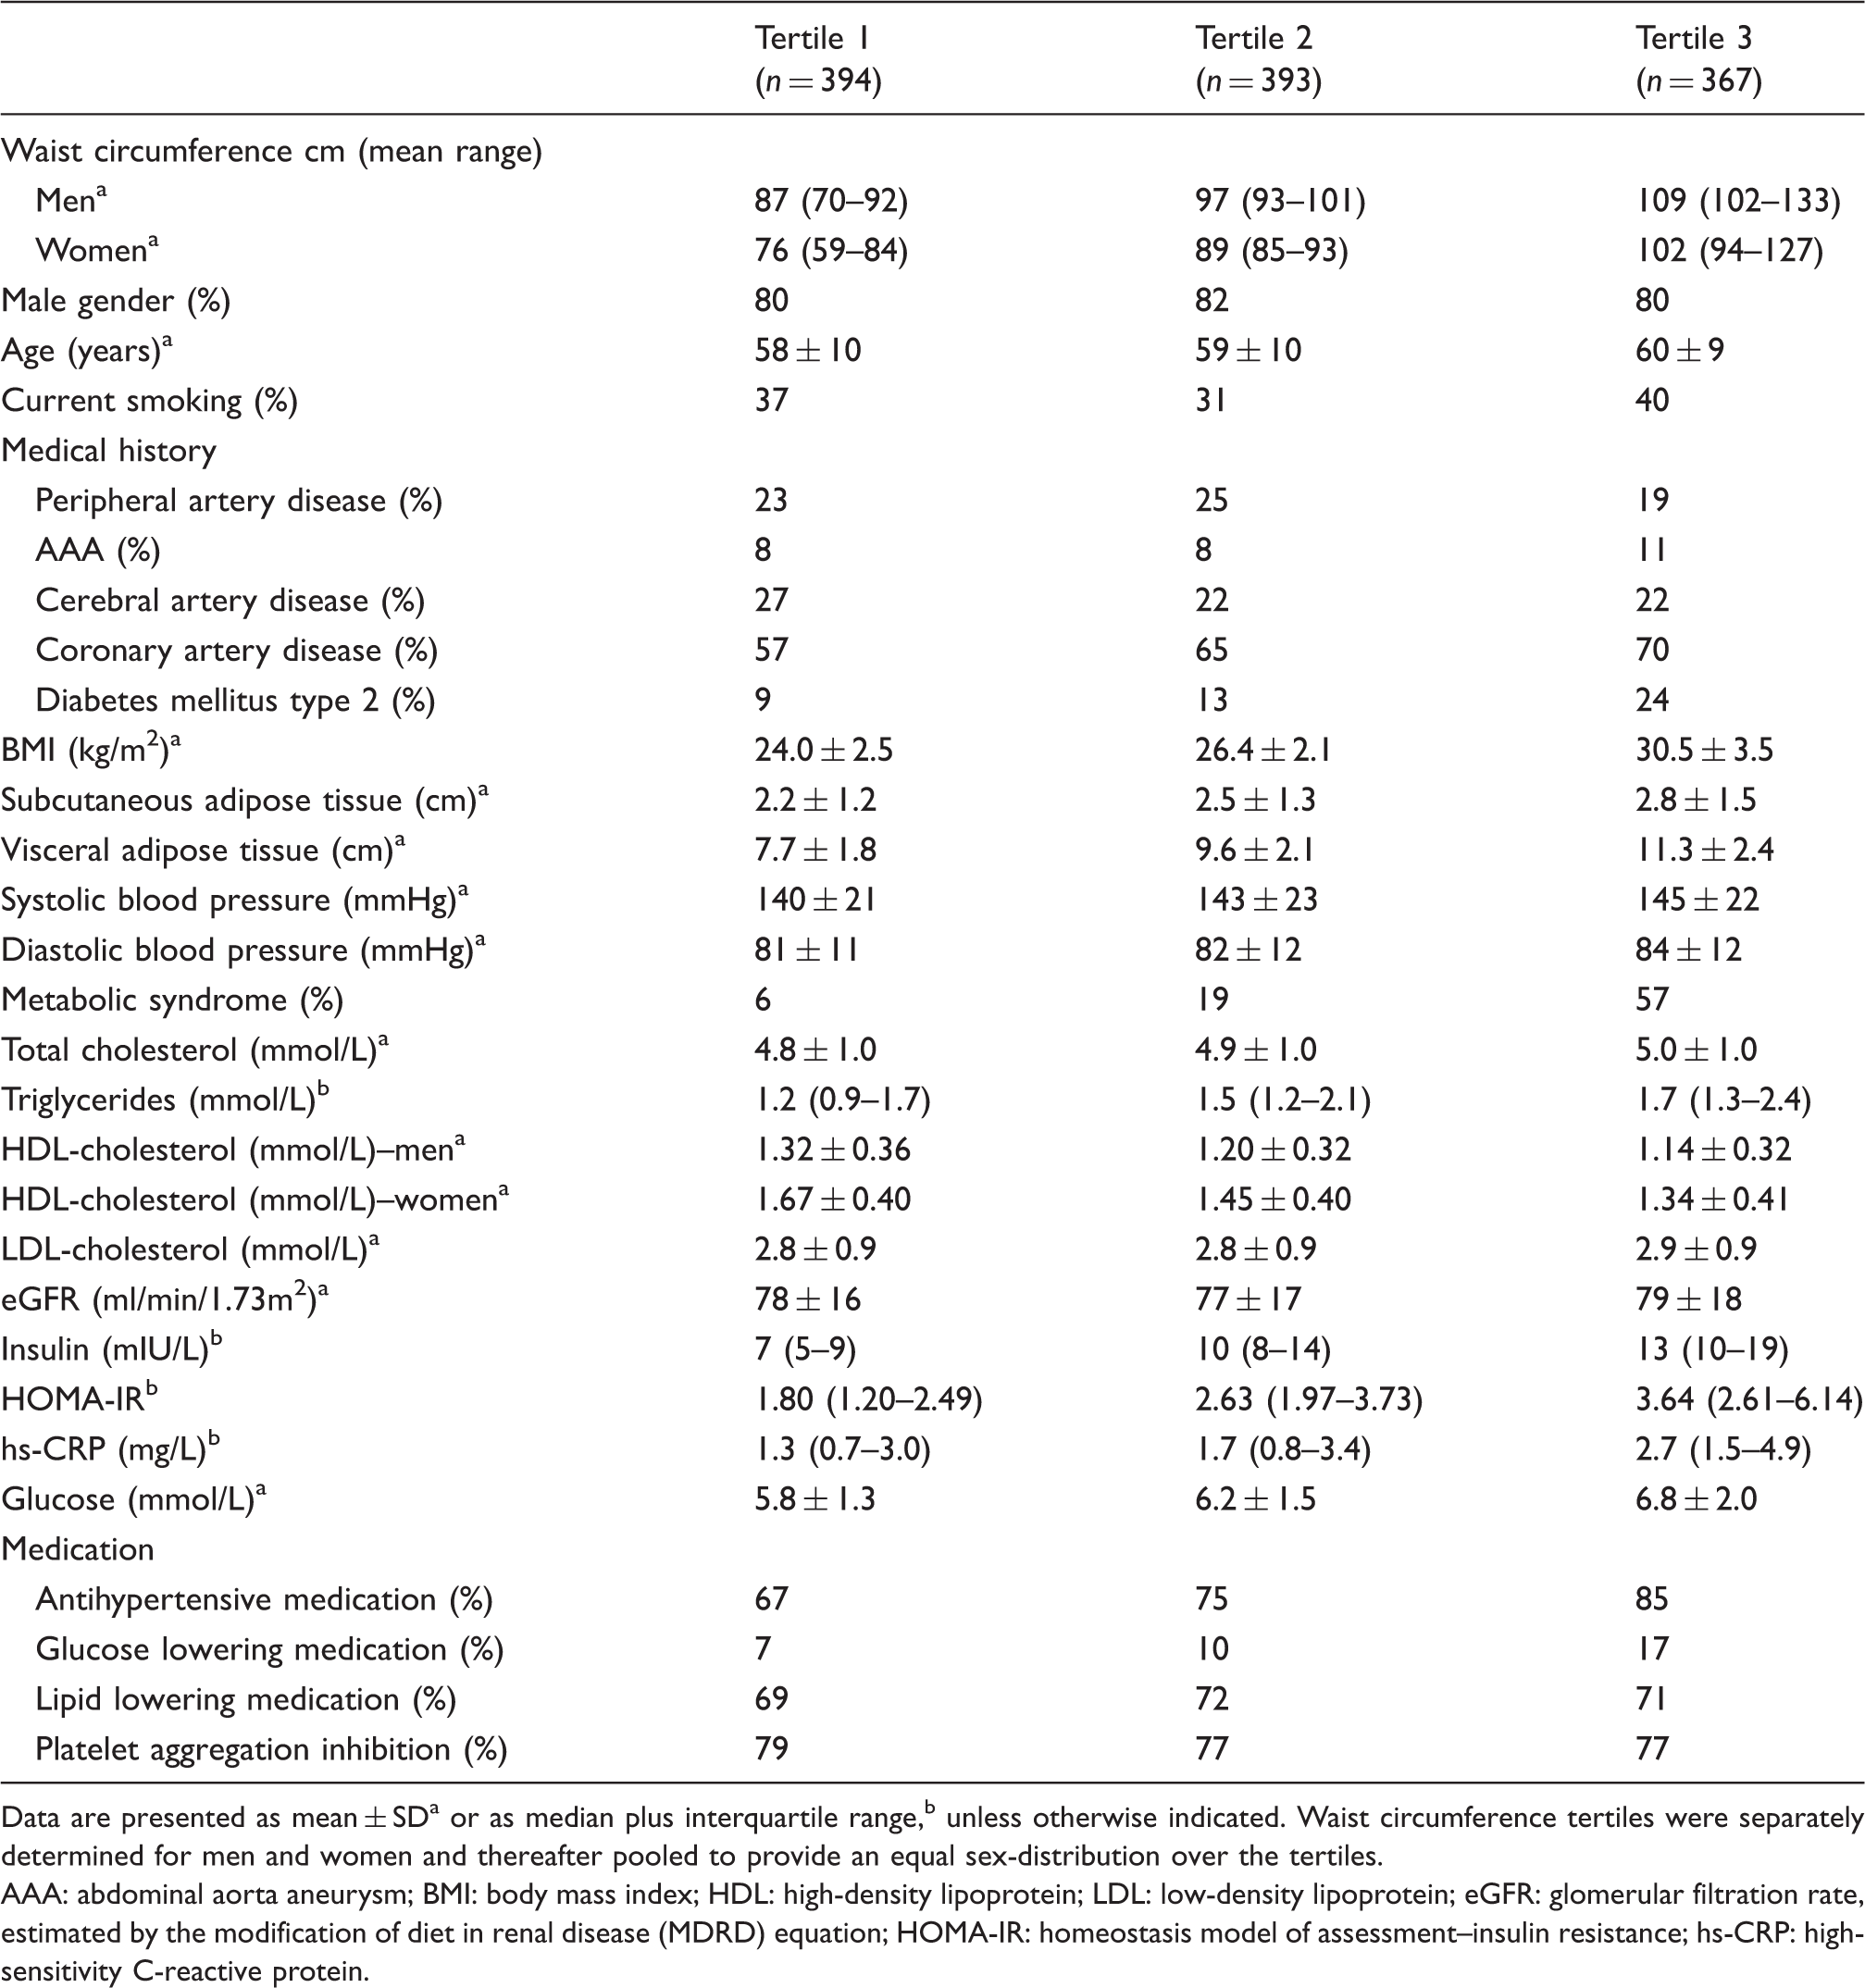
Data are presented as mean ± SDa or as median plus interquartile range,b unless otherwise indicated. Waist circumference tertiles were separately determined for men and women and thereafter pooled to provide an equal sex-distribution over the tertiles.
AAA: abdominal aorta aneurysm; BMI: body mass index; HDL: high-density lipoprotein; LDL: low-density lipoprotein; eGFR: glomerular filtration rate, estimated by the modification of diet in renal disease (MDRD) equation; HOMA-IR: homeostasis model of assessment–insulin resistance; hs-CRP: high-sensitivity C-reactive protein.
Relation between total adiposity and fat distribution and plasma concentrations of adipokines
Higher BMI, higher WC and higher VAT were all related to higher plasma concentrations of the adipokines NGF, HGF, MIF, leptin and adipsin (Figure 1 and Supplementary Table 1) after adjustment for the potential confounding factors age and gender. The strongest positive relations were seen between BMI and adipsin (β 0.247; 95% CI 0.137–0.356) and between BMI and leptin (β 0.266; 95% CI 0.207–0.324). There were no or very weak relations between SAT and plasma concentrations of adipokines (Figure 1 and Supplementary Table 1). Adiposity was negatively related to chemerin, PAI-1, resistin, SAA1 and adiponectin concentrations. The strongest negative relations were seen between BMI and SAA1 (β –0.266; 95% CI –0.386 to –0.146) and between VAT and adiponectin (β –0.168; 95% CI –0.226 to –0.111). Additional adjustment for the confounding factors smoking, the use of lipid-lowering medication, history of diabetes and hsCRP only marginally attenuated relations between adiposity measurements and adipokine concentrations (Figure 1 and Supplementary Table 1). There was no statistical interaction of DM2 in the relation between adiposity measurements and adipokine concentrations (P values for interaction >0.05).
Relations between adiposity measurements and adipokines. Results are presented as regression coefficients (β) and 95% confidence intervals (CIs) per 1 standard deviation (SD) increase in adiposity measurements. Model II (open squares) is adjusted for age and gender, model III (closed squares) is additionally adjusted for current smoking, lipid-lowering therapy, history of diabetes type 2 and high-sensitivity C-reactive protein (hsCRP). BMI: body mass index; WC: waist circumference; SAT: subcutaneous adipose tissue; VAT: visceral adipose tissue; MCP-1: monocyte chemoattractant protein 1; NGF: nerve growth factor; HGF: hepatic growth factor; PAI-1: plasminogen activator inhibitor 1; MIF: migration inhibitory factor; SAA1: serum amyloid A1.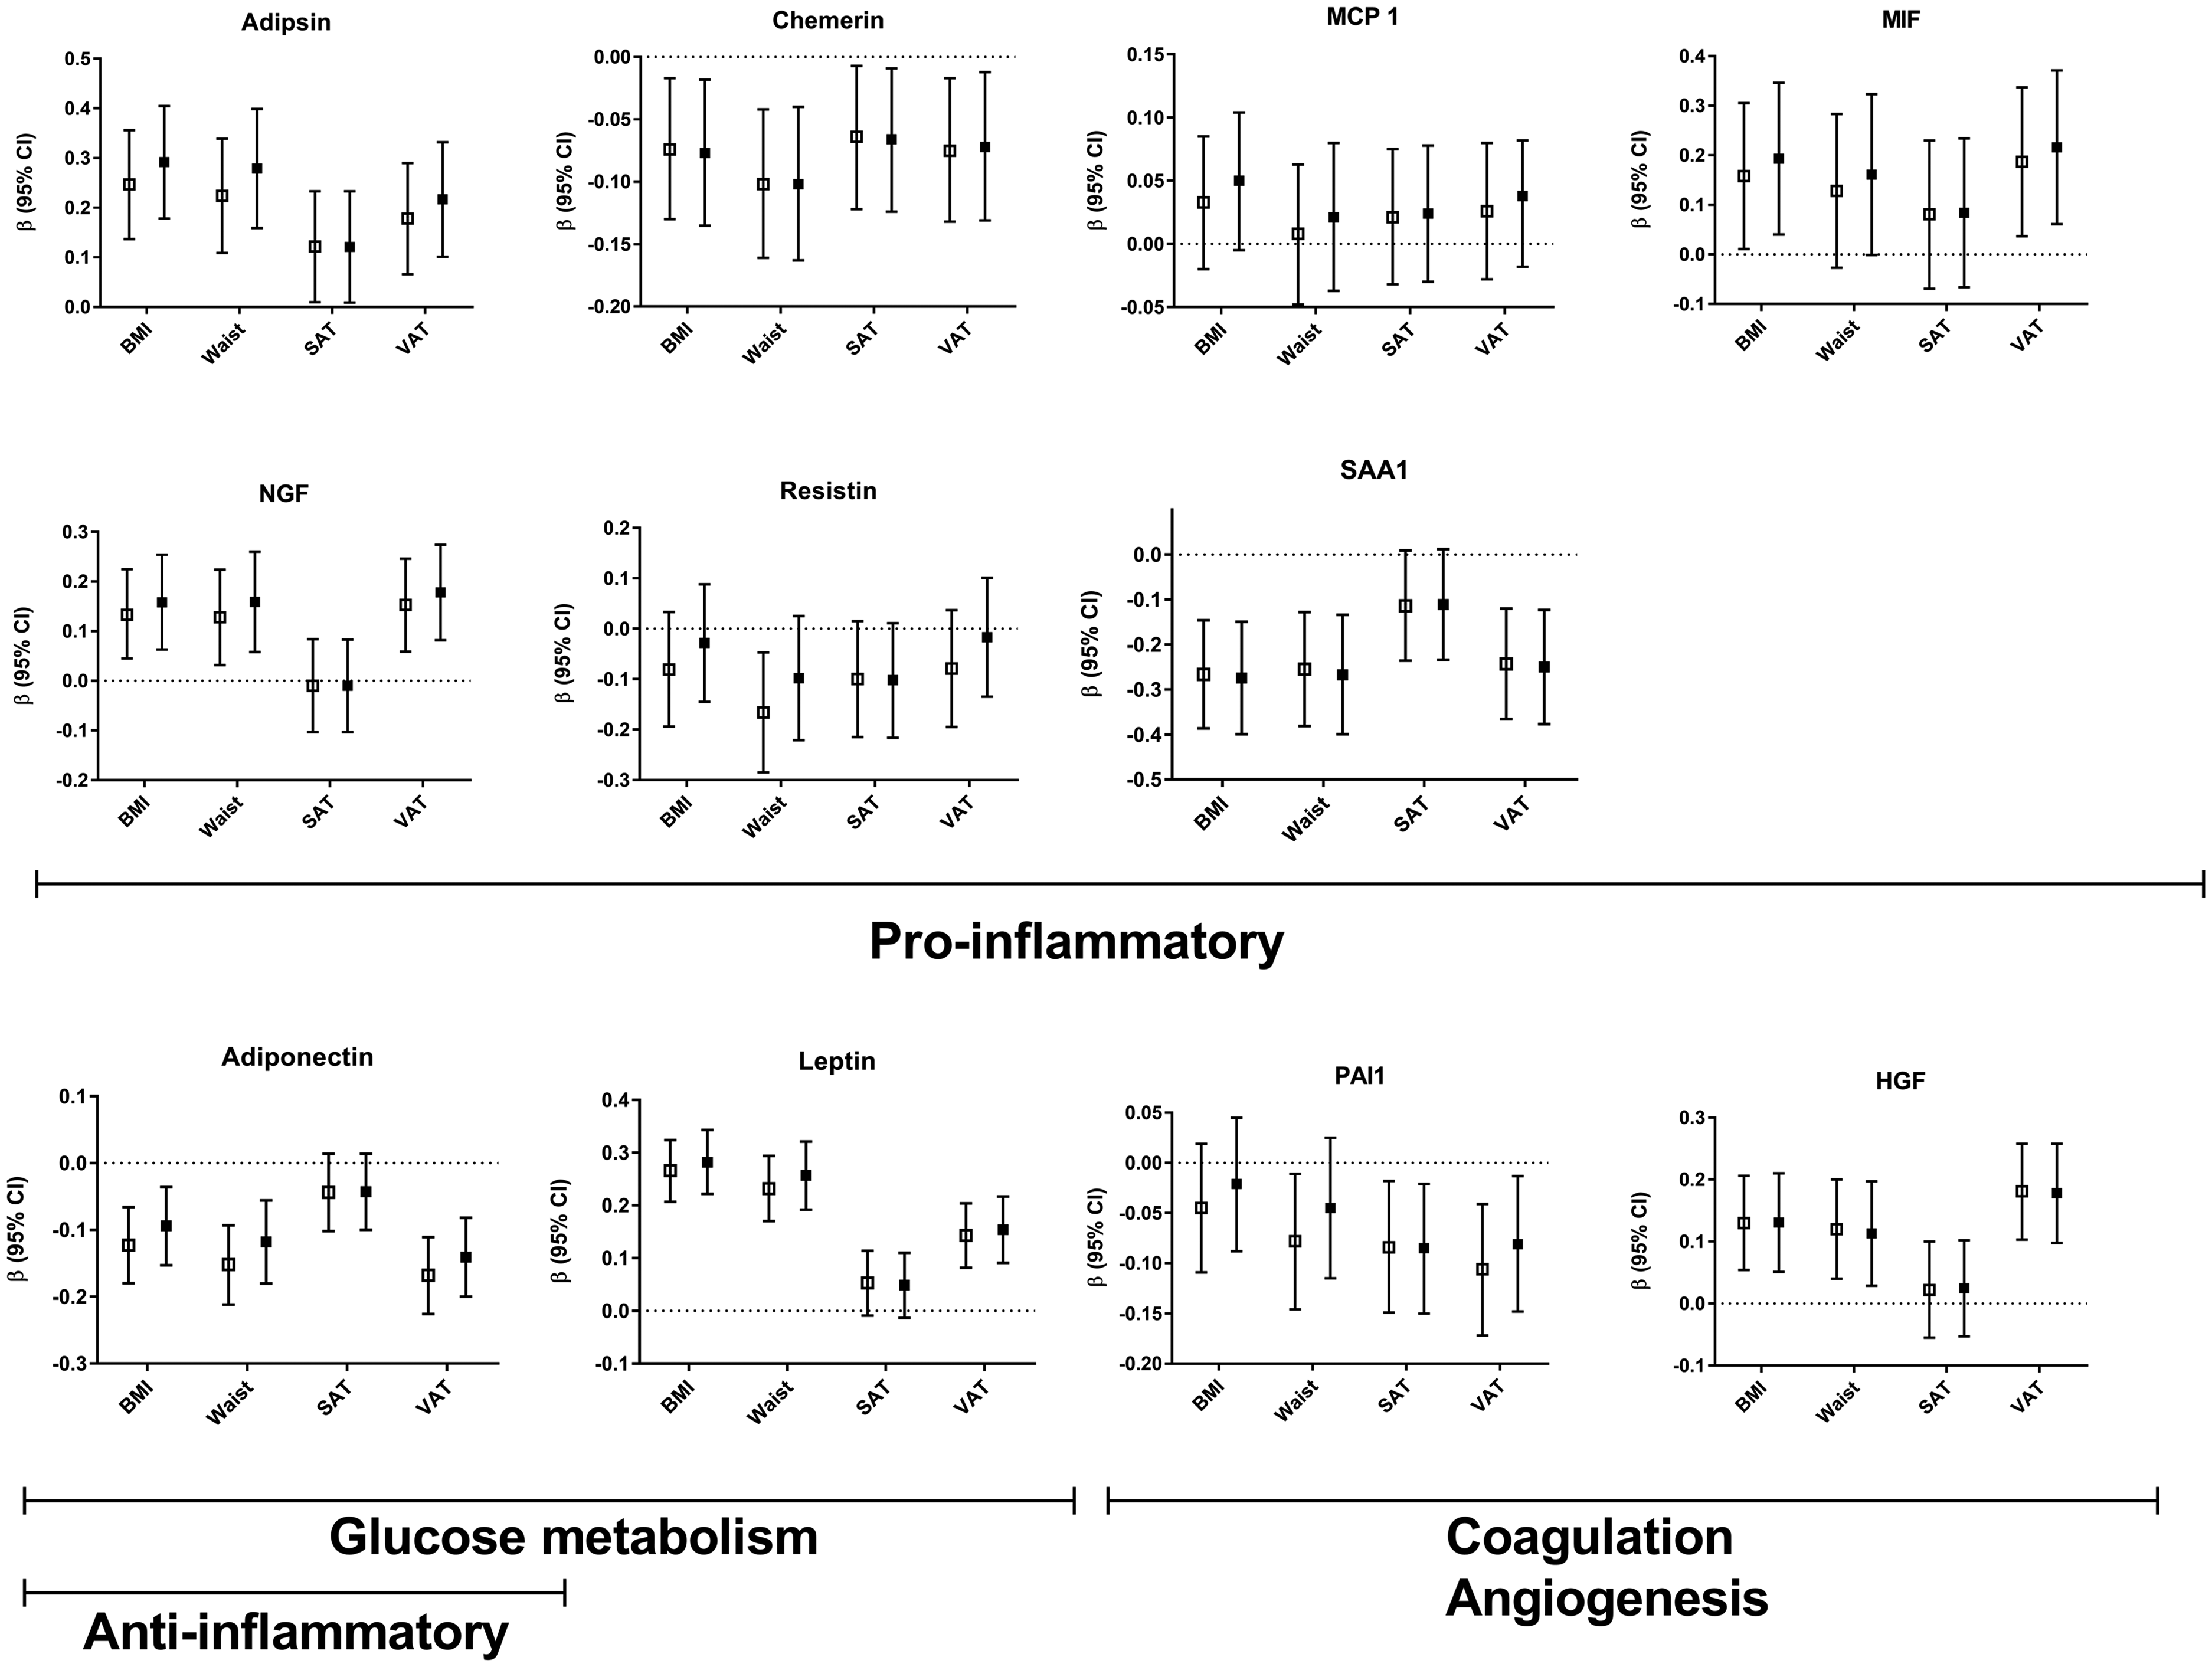
Relation between adipokine profile and the metabolic syndrome
The adipokine profile ranged from 17 to 44, with a median score of 30 (interquartile range (IQR) 27–33). A 1 point higher adipokine profile was related to a higher risk of the metabolic syndrome (OR 1.03; 95% CI 1.00–1.06) adjusted for age and gender. Additional adjustment for VAT changed this relation to a small extent (OR 1.02; 95% CI 0.99–1.05). A sensitivity analysis including only the male patients did not change the results.
Relation between adipokine plasma concentrations and presence of the metabolic syndrome
Relation between adipokines and presence of the metabolic syndrome.
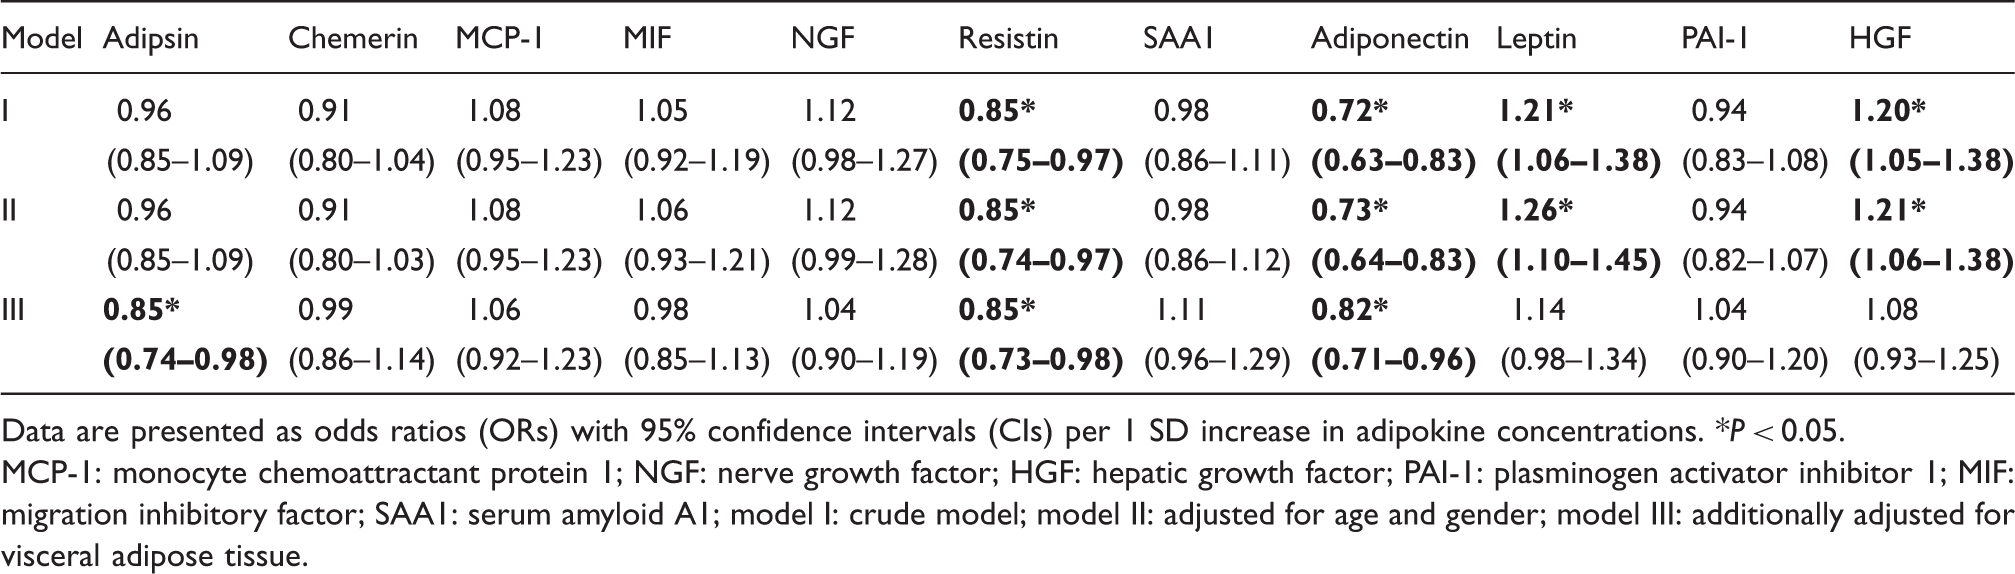
Data are presented as odds ratios (ORs) with 95% confidence intervals (CIs) per 1 SD increase in adipokine concentrations. *P < 0.05.
MCP-1: monocyte chemoattractant protein 1; NGF: nerve growth factor; HGF: hepatic growth factor; PAI-1: plasminogen activator inhibitor 1; MIF: migration inhibitory factor; SAA1: serum amyloid A1; model I: crude model; model II: adjusted for age and gender; model III: additionally adjusted for visceral adipose tissue.
Association between adipokines and the metabolic syndrome, stratified to quartiles of visceral adipose tissue.
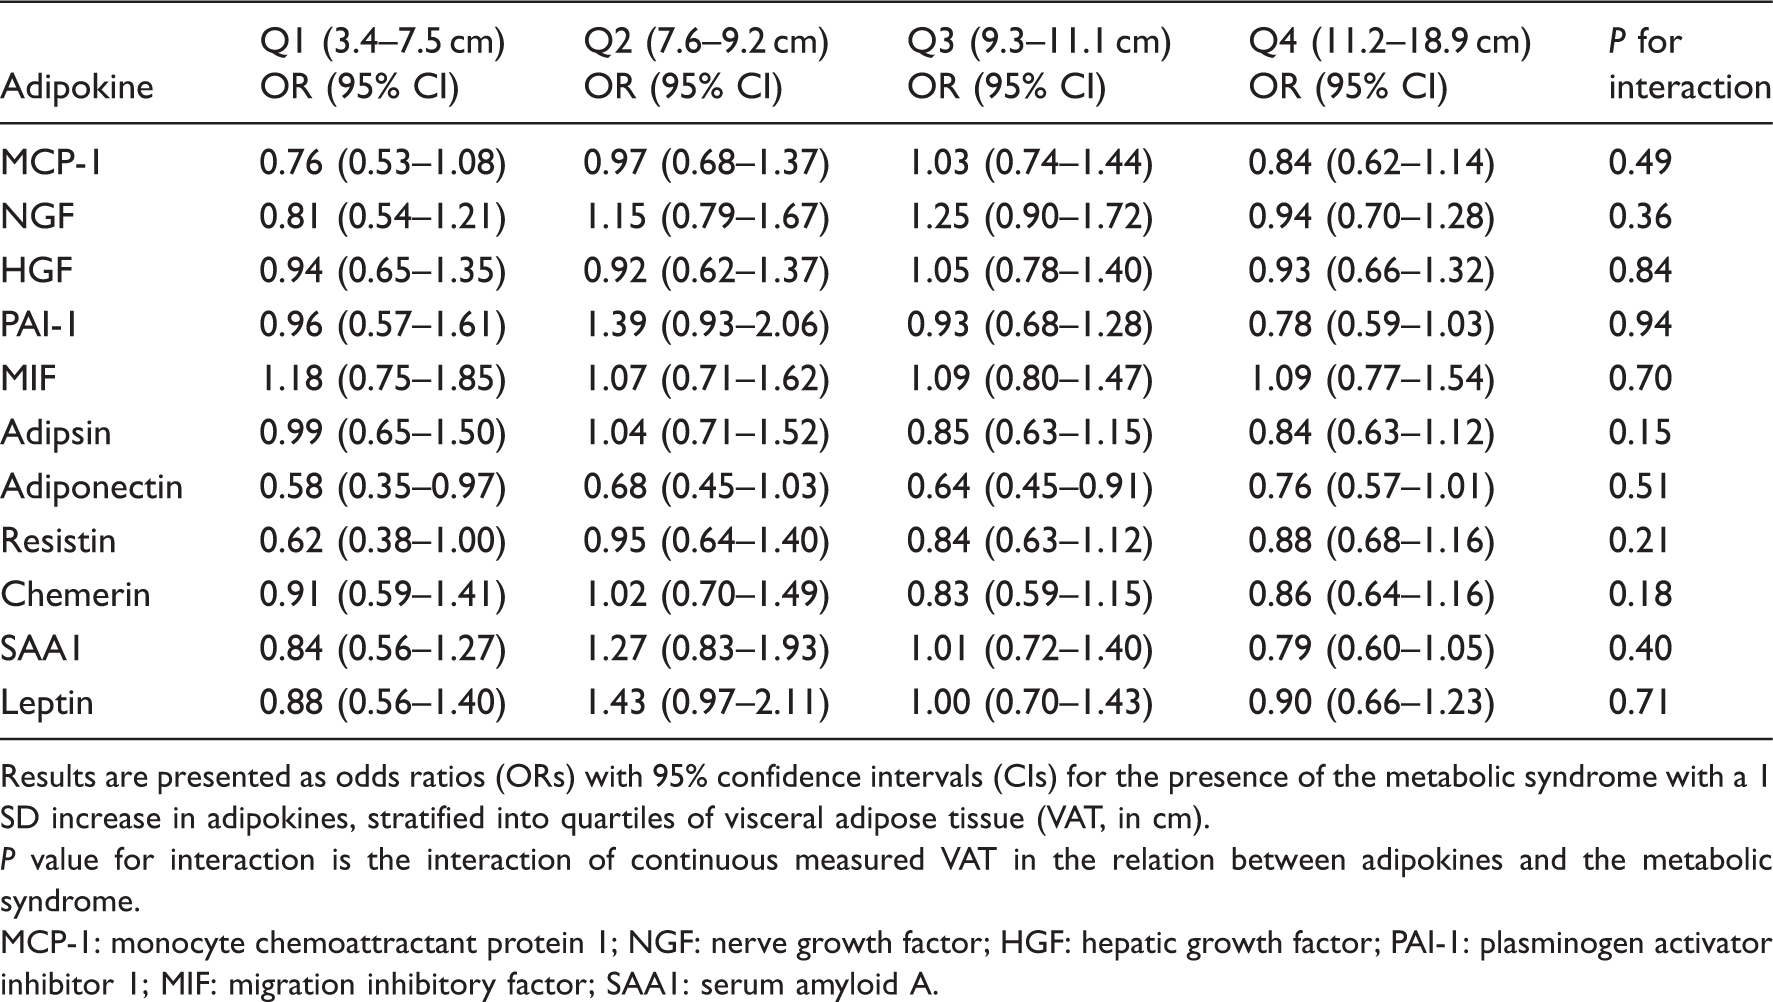
Results are presented as odds ratios (ORs) with 95% confidence intervals (CIs) for the presence of the metabolic syndrome with a 1 SD increase in adipokines, stratified into quartiles of visceral adipose tissue (VAT, in cm).
P value for interaction is the interaction of continuous measured VAT in the relation between adipokines and the metabolic syndrome.
MCP-1: monocyte chemoattractant protein 1; NGF: nerve growth factor; HGF: hepatic growth factor; PAI-1: plasminogen activator inhibitor 1; MIF: migration inhibitory factor; SAA1: serum amyloid A.
Discussion
In this study, it is demonstrated that general and visceral adiposity, but not subcutaneous adiposity, are related to plasma concentrations of adipokines in patients with clinically manifest vascular disease. The newly developed adipokine profile and several single adipokine plasma concentrations are related to the presence of the metabolic syndrome. This relation was partly sustained even after adjustment for adiposity, indicating that adipose tissue (dys)function (as reflected by the adipokine profile) is more important than the quantity of adipose tissue in the relation with the metabolic syndrome.
Relation between adiposity and adipokine concentrations
The pro-inflammatory adipokines NGF, MIF and adipsin were related to general and abdominal adiposity, which was shown in various earlier studies.17–19,21,22 This is in line with the concept that an increase in adipose tissue quantity causes a shift in the balance between the production of pro and anti-inflammatory adipokines, resulting in an excess of pro-inflammatory adipokines. However, some relations between adiposity measurements and adipokines in our study were unexpected in the light of this line of reasoning. This was the case for the negative relations of adiposity and the adipokines SAA1, chemerin and resistin, which are believed to be pro-inflammatory.33,34 Index-event bias could explain this phenomenon. In the present study patients were all diagnosed with clinically evident atherosclerotic disease, in contrast to the patients included in previous studies. This inverse relation has been shown before. Chemerin was negatively related to VAT in patients with hepatic steatosis, suggesting a modulating function of chemerin in the link between insulin resistance and steatosis. 35 A similar function of chemerin in atherosclerotic patients could be present, explaining the negative relation between VAT and chemerin. Also, in a general population with approximately 10% DM2, an inverse association between anthropometric measurements and resistin plasma levels was found. 36 As SAA1 is a lipoprotein, the extensive use of lipid-lowering therapy in our cohort could (although we corrected for the use of lipid-lowering medication) influence the results. Index-event bias could also explain the negative relation between adiposity and the pro-coagulant PAI-1 we found, contrary to results in the earlier literature. These unexpected results limit the generalisability of our study and emphasise the possibility of different associations in patients with already diagnosed cardiovascular disease.
Also shown in earlier studies21,37 we found general and abdominal adiposity to be related to the procoagulant adipokine HGF, the glucose metabolism influencing adipokine leptin and, negatively, to the anti-inflammatory adipokine adiponectin. No relations between subcutaneous adipose tissue and adipokines were found, indicative of the more important role of VAT in the development of DM2 and atherosclerotic disease.
Adipokine profile and the metabolic syndrome
As the metabolic syndrome consists of different pathophysiological components and is the result of various metabolic derangements potentially caused by different adipokines, we decided to combine the individual effects of adipokines in an adipokine profile. There was a significant relation between this profile and the presence of the metabolic syndrome, even after adjustment for visceral adiposity. This indicates an effect of adipose tissue (dys)function beyond quantity. Apparently, the function of adipose tissue is more important than the quantity with respect to the metabolic consequences leading to disease such as DM2 and vascular diseases.
Single adipokines and metabolic syndrome
With respect to the relations between individual adipokines and the metabolic syndrome, we found leptin and HGF to be positively related to the metabolic syndrome. The positive relation between plasma concentrations of leptin and the metabolic syndrome has been demonstrated in patients with the metabolic syndrome. 38 Elevated leptin concentrations are related to both WC35,39 and insulin resistance, even in euglycemic patients. 40 The relation between HGF and the metabolic syndrome was previously also shown in 1474 healthy subjects. 41 Of the metabolic syndrome characteristics, HGF is most likely to influence blood pressure, because it mediates remodelling of the vascular wall. 42 An association between HGF and insulin resistance has also been reported. 41
As expected, higher concentrations of adiponectin decreased the odds for the presence of the metabolic syndrome. As shown in various studies,38,43 higher adiponectin is associated with lower pro-inflammatory adipokine concentrations, and consequently the absence of adipose tissue dysfunction. Interestingly, recent Mendelian randomisation studies show a counterintuitive association between higher adiponectin levels and cardiovascular mortality 44 but also lower adiponectin levels being associated with an increased risk of the metabolic syndrome and hyperglycaemia. 45
Surprisingly, higher concentrations of the pro-inflammatory resistin also decreased the odds for the metabolic syndrome. In healthy individuals, resistin is positively associated with insulin sensitivity. 36 Paradoxically, in patients with low-grade inflammation or patients with atherosclerosis the resistin plasma level is elevated.34,46 As our cohort comprised patients with cardiovascular disease, we expected resistin concentrations to relate positively to the metabolic syndrome. There is some suggestion in the literature that certain classes of antihypertensive drugs could decrease resistin concentrations, 47 which could explain our results.
The absence of interaction of VAT in the relation between adipokines and the metabolic syndrome again emphasises the role of adipose tissue function rather than quantity in the development of metabolic derangements, despite losing statistical significance when correcting for VAT in the relation between adipokines and the metabolic syndrome (Table 2). However, it should be noted that changes in plasma concentrations of adipokines could also be the result of metabolic changes.
Limitations and strengths
The strengths of our study include the large cohort and the number of adipokines that were measured. Moreover, our cohort provides real-world data of a clinically relevant group of patients. Also, some study limitations should be considered. The limitations include that the cohort consisted of patients with clinically manifest vascular disease, which may limit generalisability to patients without vascular disease. No data were available on the physical activity or dietary intake of patients, which could influence the results, because little activity and a high intake of saturated fatty acids can cause the metabolic syndrome, even in lean individuals. 48 Also, as the measurement of plasmatic adipokines is not current practice, there is no current implementation of this study in general practice. Moreover, although we adjusted for several potential confounders in the multivariable analyses, there may be residual confounding. As this was a cross-sectional study one should be cautious in making causal inferences.
Conclusion
In conclusion, general adiposity and visceral adiposity are related to plasma concentrations of adipokines that reflect adipose tissue (dys)function. Adipokine concentrations are related to the presence of the metabolic syndrome, independent of the amount of VAT. Therefore, adipose tissue dysfunction and not adiposity per se are likely to be the causal link between (abdominal) adiposity and metabolic changes causing the metabolic syndrome, eventually leading to DM2 and vascular disease.
Members of the SMART study group
A Algra; Y van der Graaf; DE Grobbee; GEHM Rutten, Julius Center for Health Sciences and Primary Care; FLJ Visseren, Department of Internal Medicine; GJ de Borst, Department of Vascular Surgery; LJ Kappelle, Department of Neurology; T Leiner, Department of Radiology; HM Nathoe, Department of Cardiology.
Supplemental Material
Supplemental material for The relation between body fat distribution, plasma concentrations of adipokines and the metabolic syndrome in patients with clinically manifest vascular disease
Supplemental material for The relation between body fat distribution, plasma concentrations of adipokines and the metabolic syndrome in patients with clinically manifest vascular disease by Ilse M Schrover, Yolanda van der Graaf, Wilko Spiering and Frank LJ Visseren in European Journal of Preventive Cardiology
Footnotes
Author contribution
IMS, FLJV and WS contributed to the conception or design of the work. YvdG contributed to the acquisition, analysis or interpretation of data for the work. IMS drafted the manuscript. FLJV, WS and YvdG critically revised the manuscript. All authors gave final approval and agree to be accountable for all aspects of the work ensuring integrity and accuracy.
Declaration of conflicting interests
The author(s) declared no potential conflicts of interest with respect to the research, authorship, and/or publication of this article.
Funding
The author(s) received no financial support for the research, authorship, and/or publication of this article.
References
Supplementary Material
Please find the following supplemental material available below.
For Open Access articles published under a Creative Commons License, all supplemental material carries the same license as the article it is associated with.
For non-Open Access articles published, all supplemental material carries a non-exclusive license, and permission requests for re-use of supplemental material or any part of supplemental material shall be sent directly to the copyright owner as specified in the copyright notice associated with the article.