
Abstract
Background
In Australia, clinical guidelines for primary prevention of cardiovascular disease recommend the use of the Framingham model to help identify those at high risk of developing the disease. However, this model has not been validated for the Indigenous population.
Design
Cohort study.
Methods
Framingham models were applied to the Well Person’s Health Check (WPHC) cohort (followed 1998–2014), which included 1448 Aboriginal and Torres Strait Islanders from remote Indigenous communities in Far North Queensland. Cardiovascular disease risk predicted by the original and recalibrated Framingham models were compared with the observed risk in the WPHC cohort.
Results
The observed five- and 10-year cardiovascular disease probability of the WPHC cohort was 10.0% (95% confidence interval (CI): 8.5–11.7) and 18.7% (95% CI: 16.7–21.0), respectively. The Framingham models significantly underestimated the cardiovascular disease risk for this cohort by around one-third, with a five-year cardiovascular disease risk estimate of 6.8% (95% CI: 6.4–7.2) and 10-year risk estimates of 12.0% (95% CI: 11.4–12.6) and 14.2% (95% CI: 13.5–14.8). The original Framingham models showed good discrimination ability (C-statistic of 0.67) but a significant lack of calibration (χ2 between 82.56 and 134.67). After recalibration the 2008 Framingham model corrected the underestimation and improved the calibration for five-year risk prediction (χ2 of 18.48).
Conclusions
The original Framingham models significantly underestimate the absolute cardiovascular disease risk for this Australian Indigenous population. The recalibrated 2008 Framingham model shows good performance on predicting five-year cardiovascular disease risk in this population and was used to calculate the first risk chart based on empirical validation using long-term follow-up data from a remote Australian Indigenous population.
Introduction
Indigenous Australians have substantially poorer health outcomes and have a life expectancy of approximately 10 years lower than that of the non-Indigenous population. 1 In this population, cardiovascular disease (CVD) is the leading cause of death, with an age-adjusted death rate 1.3 times higher than that of non-Indigenous Australians. 2 In Australia, clinical guidelines for primary prevention of CVD recommend the 1991 Framingham CVD model 3 as an important component of guidelines used to identify those at high risk of developing CVD over a five-year period. 4 The development of CVD risk prediction models using Framingham study data dates back to the late 1960s.5,6 The most widely used model was developed by Anderson and colleagues to predict the risk of developing CVD and its component diseases (coronary heart disease (CHD), myocardial infarction and stroke) for people aged 30–75 years. 3 In 2008 an updated sex-specific Framingham model was published to predict 10-year CVD risks. 7
The Framingham CVD models have been validated and recalibrated in various countries and ethnicities8–10 as well as in the Australian general population.11,12 However, it has not been validated or recalibrated for an Australian Indigenous population. One previous study (2005) compared the predicted and observed CHD rates in an Australian Aboriginal remote community sample and found that the 1991 Framingham model substantially underestimated CHD rates across all age groups and both sexes. 13 In the current Australian CVD management guidelines, people with the following characteristics are automatically put into the high risk category: diabetes and aged over 60 years, diabetes with microalbuminuria, estimated glomerular filtration rate < 45 ml/min per 1.73m2, familial hypercholesterolemia, high blood pressure and serum total cholesterol > 7.5 mmol/l, and any Aboriginal or Torres Strait Islander over the age of 74 years. 4 However, the developers of these guidelines acknowledge that there is little empirical evidence supporting this classification system (a combination of level D weak evidence plus a consensus-based recommendation). 4 Further, for Aboriginal and Torres Strait Islander adults aged between 35 and 74 years who are not in this clinically determined high risk category, the guidelines recommend the use of the 1991 Framingham CVD model to estimate five-year absolute CVD risks while acknowledging that it might result in an underestimation of these risks. 4
In this study, we validated both the 1991 and 2008 Framingham CVD models using a cohort of Aboriginal and Torres Strait Islander adults drawn from remote Indigenous communities in Far North Queensland. Recalibration was also conducted to help generate more accurate CVD risk predictions for this population. Finally, we developed a CVD risk chart that could help improve the assessment and management of CVD in the Australian Indigenous population, particularly those in remote regions of Australia.
Methods
Participants
The source population of the present study were obtained from the Well Person’s Health Check (WPHC), which was conducted between 1998 and 2000 and consisted of 3508 people in 26 remote Indigenous communities in Far North Queensland. 14 The study was approved by the Cairns Institutional Health Ethics Committee with support from Apunipima Cape York Health Council (HREC/141QCH/121-936). Participation in the WPHC study was open to all people residing in these communities and involved a broad range of recruitment strategies including printed media and local radio as well as through health services and community groups. 14 Information collected in the WPHC survey can be found in the Supplementary Material online. Baseline data of the participants were linked to hospitalization and death records in the Queensland Hospital Admitted Patient Data Collection dataset from the initial screening date to the end of 2014, using linkage software applying deterministic and probabilistic methodologies, as well as manual clerical reviews where required. For our study, we included 1684 (98.8%) people aged between 30 and 74 years who have a unique link to their hospitalization and death records. We excluded people with previous CVD events (n = 101) or whose baseline characteristics were missing (n = 135).
Baseline risk factors were collected from the WPHC screening data, including systolic blood pressure, total cholesterol level, high-density lipoprotein (HDL) cholesterol level, fasting glucose level and smoking status. Details of the methods used to collect these indicators have been published elsewhere. 14 People with diabetes were identified if they self-reported (confirmed through medical record check) or had a baseline fasting glucose > 7.8 mmol/l.
One hundred and forty (8.3%) people had one or more baseline risk factors missing (six with missing systolic blood pressure value; 49 with missing total cholesterol and 134 with missing HDL cholesterol), which were excluded from the main analysis. Sensitivity analysis was conducted where we replaced the missing values with estimated values from multiple imputation by chained equations on five occasions and used standard statistical rules to produce reported results. 15 Electrocardiogram–left ventricular hypertrophy (ECG-LVH; required for the 1991 Framingham model) and hypertension treatment (required for the 2008 Framingham model) were not collected during WPHC screening. We presumed these values to be the average of the Framingham population and used hypothetical values in the sensitivity analysis.
Outcomes
CVD events were identified using the International Classification of Disease diagnosis and procedure codes (version 9 and 10; see Supplementary Material) for the following outcomes in hospitalization and death records: CHD (including myocardial infarction, angina pectoris and coronary insufficiency), CHD death, stroke, congestive heart failure and peripheral vascular disease as defined by Anderson et al. in the Framingham study. 3
The start date of follow-up was the screening date of the WPHC and the censor date was the date of first CVD event or death, whichever came first, or otherwise the date of last known admission. If neither admission nor death occurred during follow-up, the censor date was 1 December 2014, which was the last known admission date of the study.
Statistical analysis
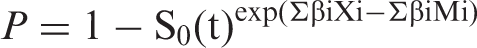
We used three models to predict five-year and 10-year CVD risks in our study cohort. The first two were the original 1991 and 2008 Framingham models.3,7 As only the 10-year baseline survival rate was reported in the 2008 Framingham model, this model predicted 10-year CVD risk only. The third model was a recalibrated 2008 Framingham equation, in which both the baseline five-year and 10-year survival rates and mean values of the risk factors were estimated using the WPHC sample and coefficients on risk factors were obtained from the original 2008 Framingham model. In detail, the 2008 Framingham model (Cox equation) is:
Age- and sex-specific predicted five-year (original 1991 and recalibrated 2008 models) and 10-year (all three models) CVD risks for people aged between 30 and 74 years were calculated and compared with the observed CVD probabilities (estimated using the Kaplan–Meier method). The 95% confidence intervals of the differences between the predicted and observed probabilities were estimated using the bootstrap method with 1000 bootstrapped replications.
Discrimination
Discrimination refers to the ability of a prediction model to correctly distinguish those who will develop an event from those who will not. We quantified this by calculating Harrell’s C-statistic, 16 which represents the probability of concordance amongst all pairs of subjects in which at least one had an event. Concordance refers to two subjects’ predicted probabilities of survival and survival times going in the same direction, for example, the person who has higher predicted probability of survival also survives longer in reality.
Calibration
Calibration describes how closely the predicted probabilities agree with observed outcomes. We used two χ2 statistics to evaluate calibration. The first method was proposed by D’Agostino and Nam, 17 which compared the predicted and observed probabilities by deciles based on the predicted risk. Plots were constructed showing predicted and actual probabilities of CVD events in each decile. A χ2 statistic exceeding 20 was used to indicate a significant lack of calibration (p < 0.01). 8 The second method used the χ2 statistics with cross-classified categories proposed by Cook, 18 in which a reclassification table was built to divide participants into different risk categories based on predictions from both original and recalibrated Framingham models. The observed and predicted probabilities were compared for all cells with at least 20 individuals. 18
To investigate the validity of the recalibrated model, the repeat data-splitting (cross validation) method was used for internal validation. The original sample was randomly divided into five samples; the recalibration was conducted on all sets of four of these samples, and the resulting five recalibrated models were used to estimate the risk in the fifth omitted sample (i.e. those individuals not used in the model development). The C-statistic and Nam–D’Agostino χ2 were computed on the estimated results. This data-splitting procedure was repeated 200 times to obtain stable results.
All statistical analyses were performed in Stata version 13.1(StataCorp LP, College Station, TX, USA).
CVD risk chart
A five-year CVD risk chart for the Australian Indigenous population was generated based on the recalibrated 2008 Framingham model. To keep the chart simple and comparable to the existing Australian CVD charts 19 we retained stratification by the total cholesterol:HDL ratio. This was achieved by fixing HDL at 1.2 mmol/l, the average level in this sample. We varied the HDL level by ± 0.6 mmol/l (covering the maximal values of HDL in the study cohort) to test its effect on the predicted risk levels in a sensitivity analysis.
Results
Baseline risk factors and survival rates for people 30–75 years old in the Framingham 7 and WPHC Indigenous cohort.
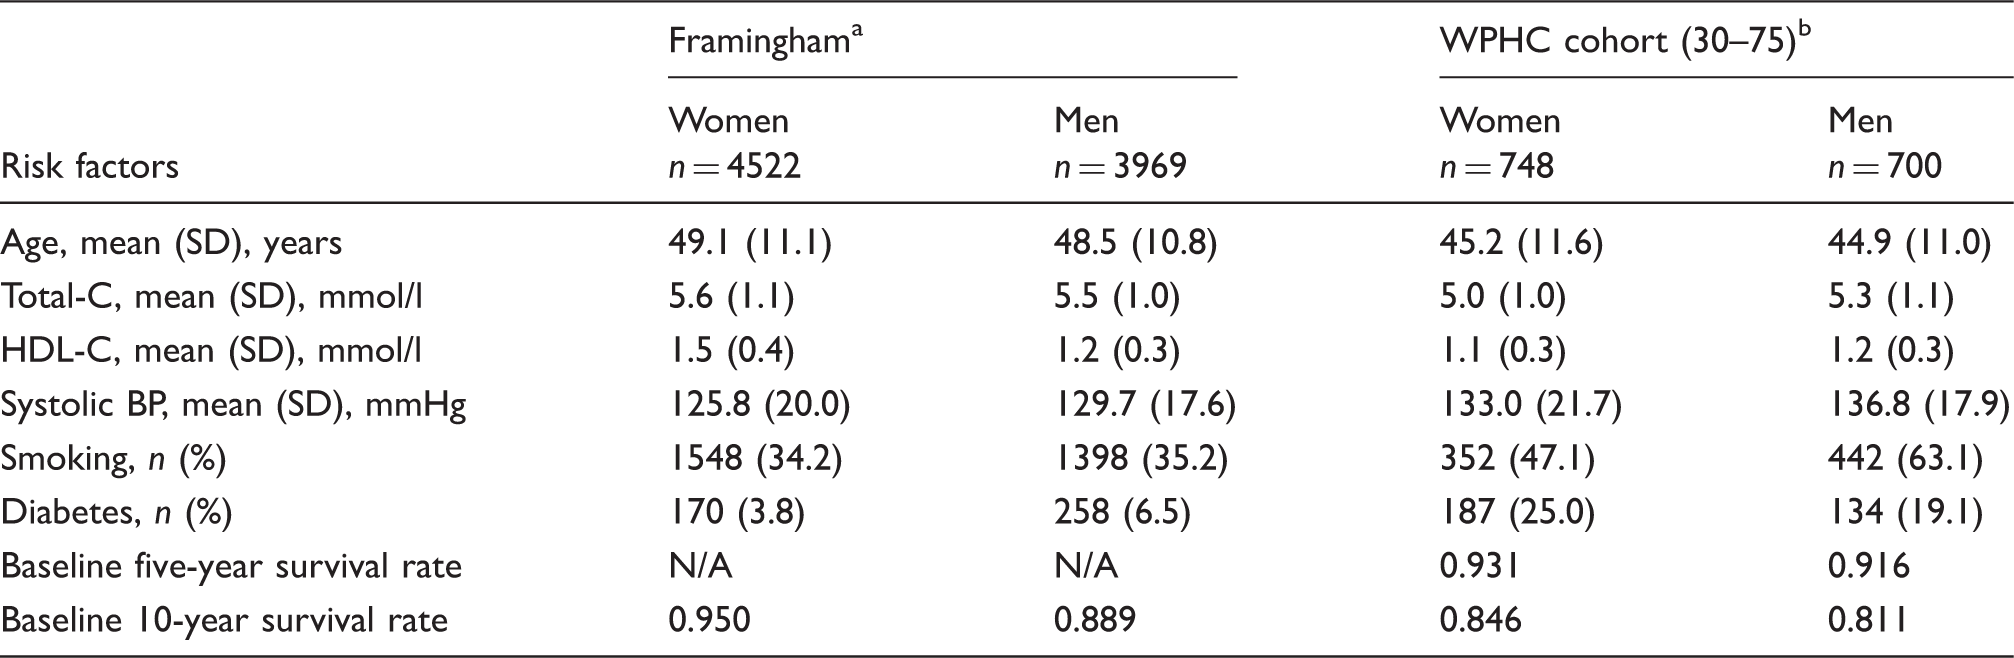
Adapted from data in D’Agostino. 7
The WPHC values were used for recalibration of the 2008 Framingham model.
WPHC: Well Person’s Health Check; SD: standard deviation; Total-C: total cholesterol; HDL-C: high-density lipoprotein cholesterol; BP: blood pressure; N/A: not applicable
Five-year and 10-year probability of CVD events in the WPHC Indigenous sample, observed and predicted probabilities using three different Framingham models.
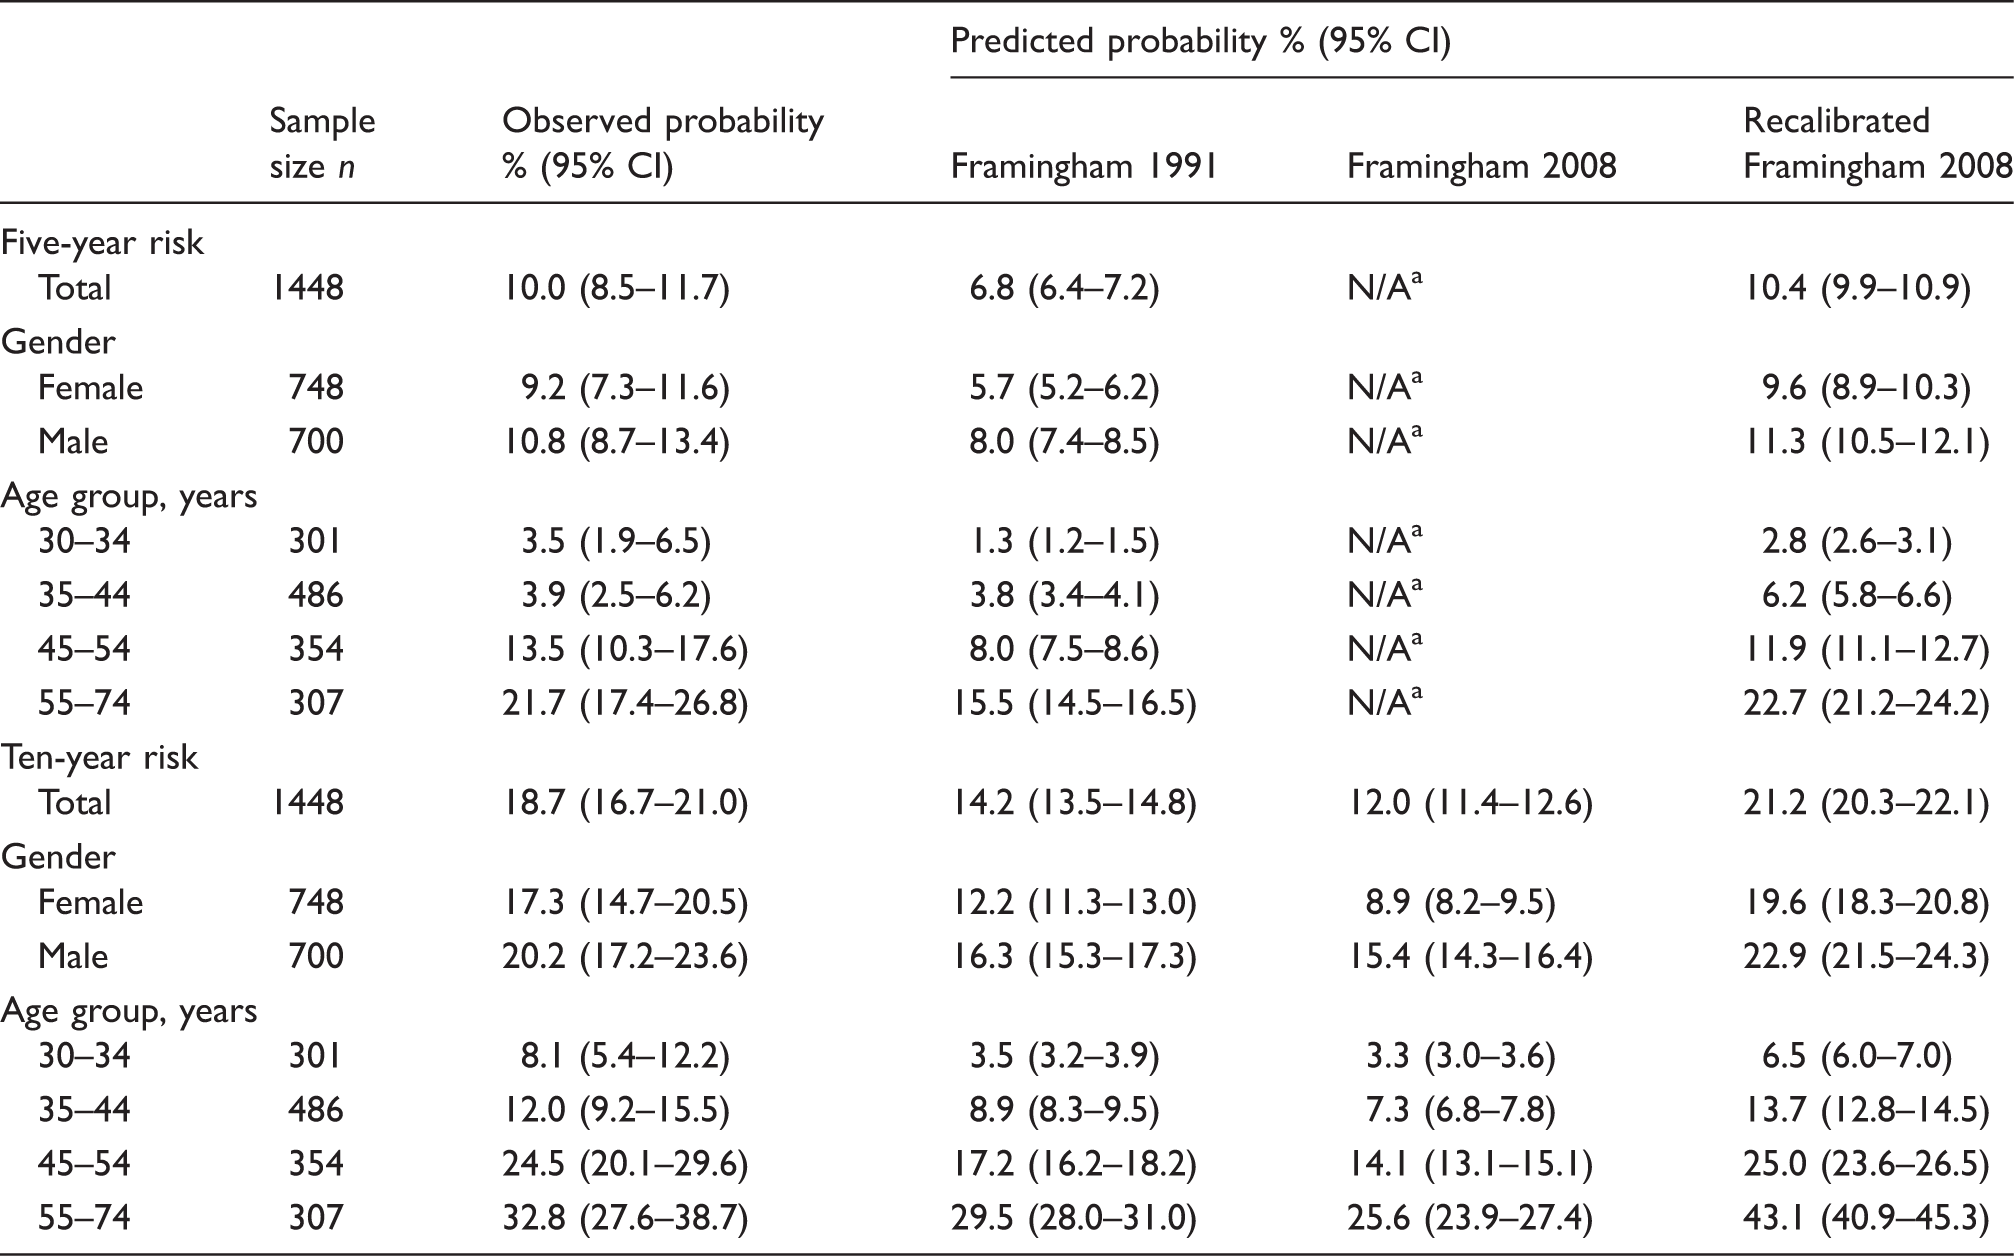
The baseline five-year survival rate was not reported in the D’Agostino 2008 study. Therefore, we were unable to calculate five-year risk using the original Framingham 2008 model.
CVD: cardiovascular disease; WPHC: Well Person’s Health Check; CI: confidence interval; N/A: not applicable
The overall predicted five-year CVD risk using the 1991 Framingham model was 6.8% (95% CI: 6.4–7.2). The predicted 10-year risk was 14.2% (95% CI: 13.5–14.8) and 12.0% (95% CI: 11.4–12.6) using the 1991 and 2008 Framingham models, respectively. All predictions significantly underestimated the observed CVD probabilities in the WPHC cohort by around one-third, with differences being 3.2% (95% CI: 1.9–4.5) for five-year risk and 4.5% (95% CI: 2.9–6.3) to 6.7% (95% CI: 5.0–8.5) for 10-year risk. Sensitivity analyses which estimated predicted risk by adjusting the prevalence of ECG-LVH or hypertension produced similar results and are reported in the Supplementary Material.
After baseline risk recalibration, five-year total and age- and sex-specific predicted risks were similar to the observed results (Table 2). The predicted 10-year probability of CVD events using the recalibrated model was higher than the observed risk, mainly because of overestimation in the 55–74 year age group (Table 2). Compared with the predictions from the original 1991 Framingham model, after recalibration 165/1096 people in the low five-year CVD risk (<10%) category and 146/186 people in the moderated five-year CVD risk (10%–15%) category moved to a higher risk category; the predicted number of people with high five-year CVD risk (>15%) almost doubled, from 166 to 322, in the cohort (p < 0.001). The probabilities of CVD events using the imputed data were similar and are reported in the Supplementary Material.
Performance of the original and recalibrated Framingham models in predicting five-year and 10-year CVD events.
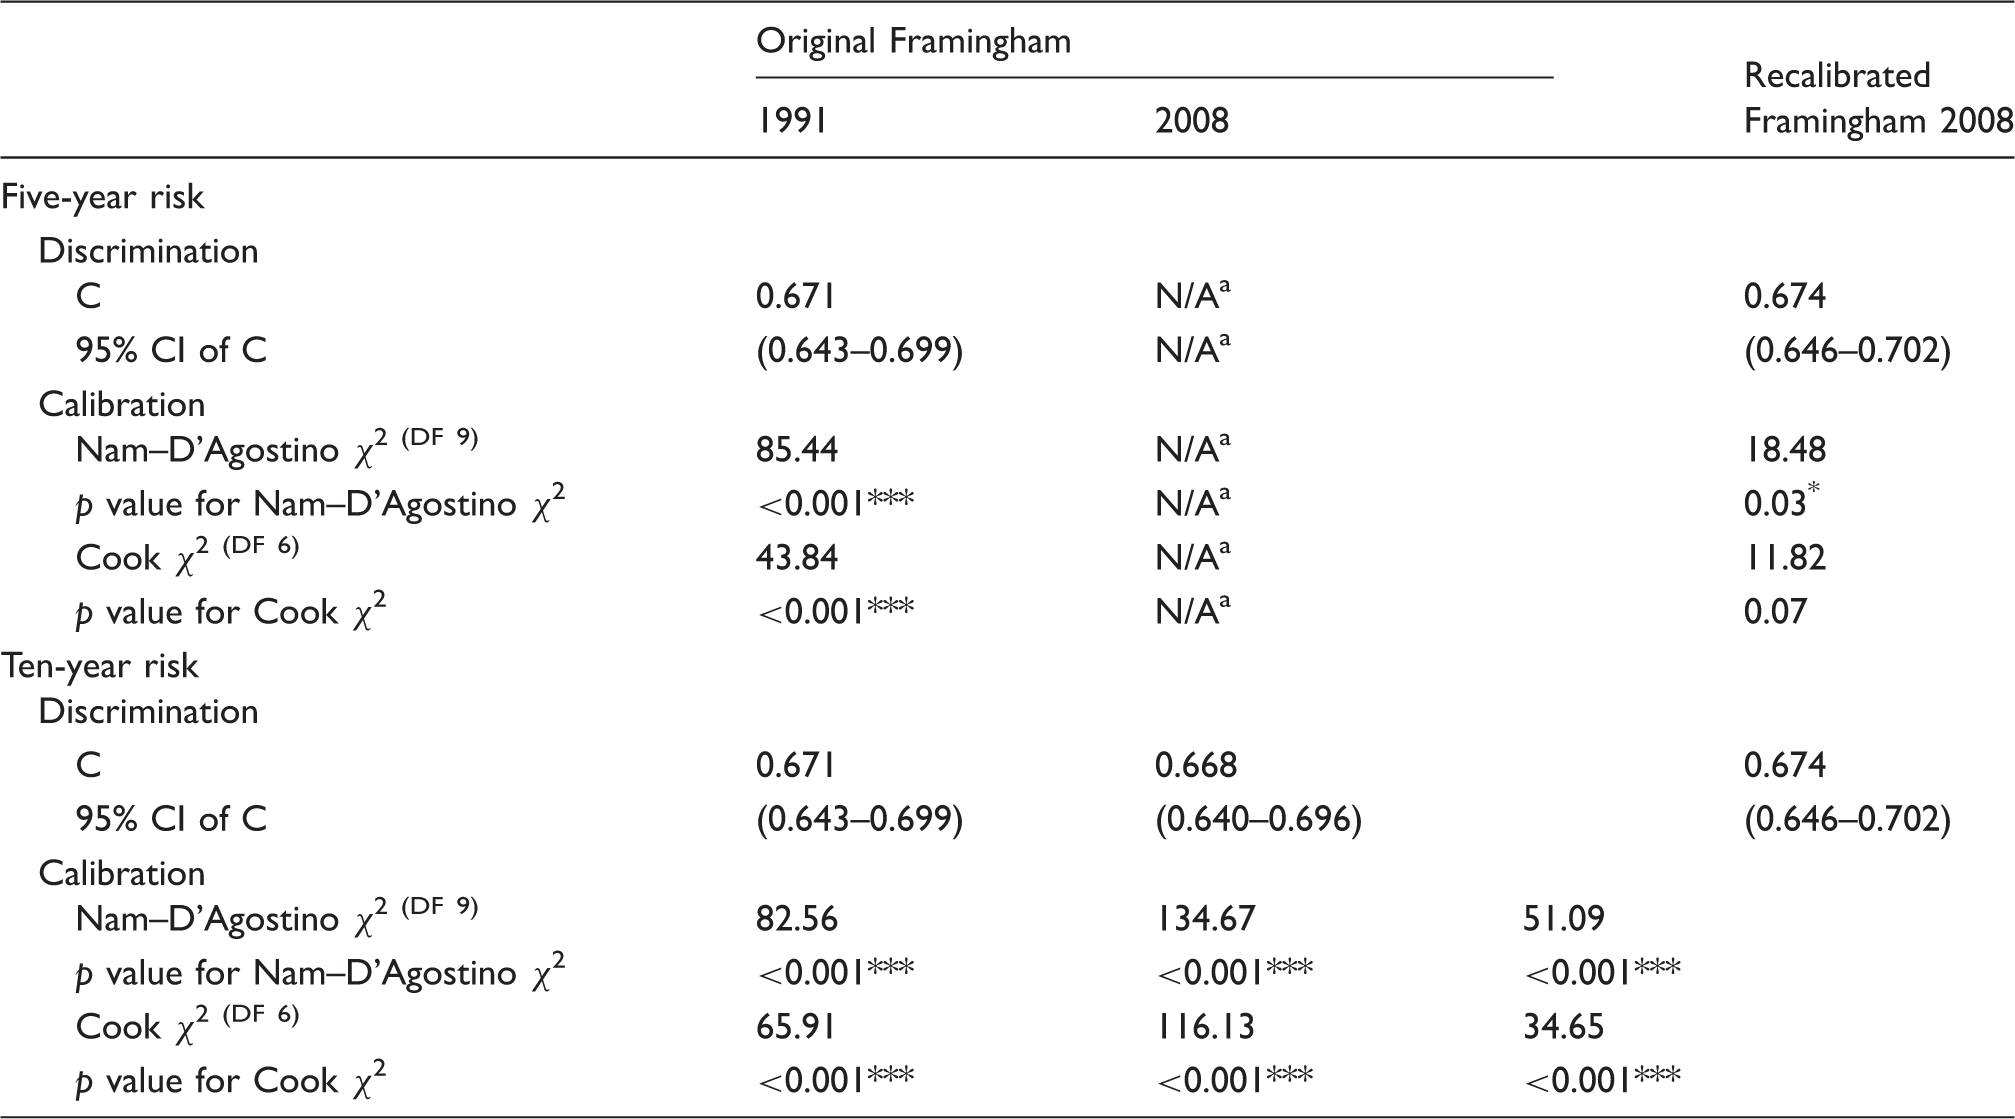
The baseline five-year survival rate was not reported in the D’Agostino 2008 study. Therefore, we were unable to calculate five-year risk using the original Framingham 2008 model. *P < 0.05 ***P < 0.001
CI: confidence interval; C: C-statistics; DF: degree of freedom; N/A: not applicable
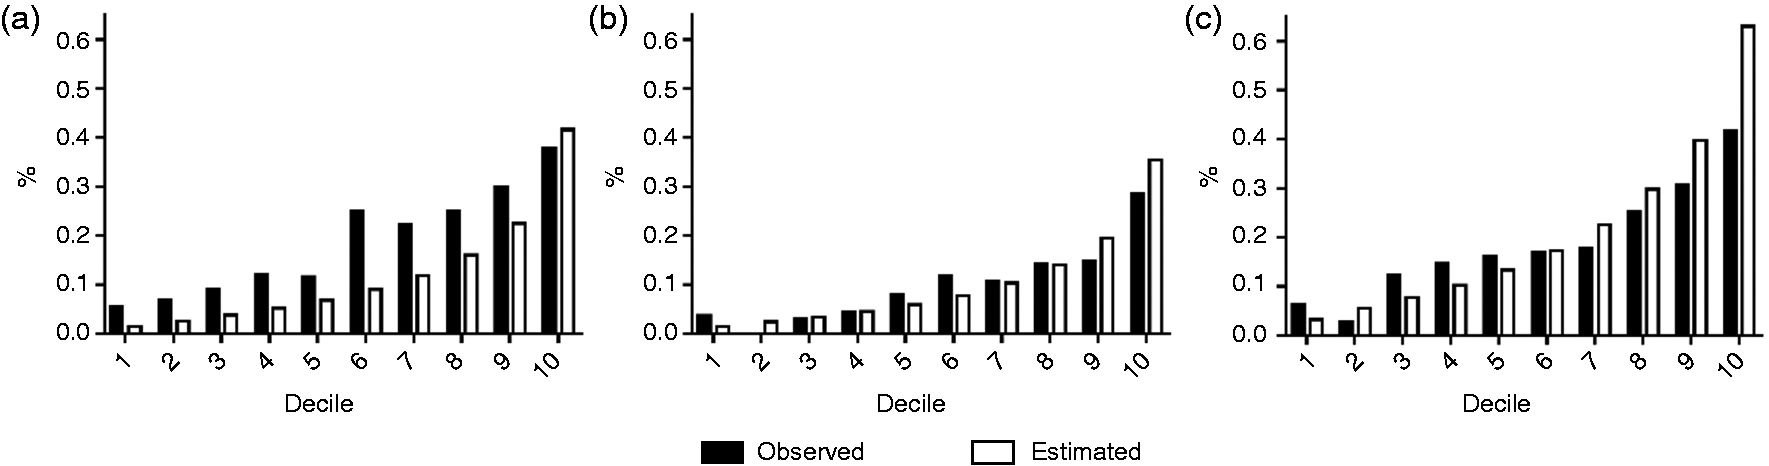
Calibration by decile for cardiovascular disease (CVD) risk of the original and recalibrated 2008 Framingham model. Horizontal-axes refer to decile of predicted risk based on the 2008 Framingham CVD model; vertical-axes refer to observed and model-based predicted probabilities of CVD event. (a) Original model (10-year risk), (b) Recalibrated model (five-year risk) and (c) Recalibrated model (10-year risk).
Based on the recalibrated 2008 Framingham model, a five-year absolute CVD risk chart was built for the Australian Indigenous population (Figure 2). Predictions for people aged between 30 and 34 years were included because of the high CVD risk levels for certain populations in this age range (e.g. smokers with diabetes). A sensitivity analysis (reported in the Supplementary Material) showed that varying HDL levels by ± 0.6 mmol/l produced only a small change of risk scores that would have a minimal impact on the classification of standard risk charts.
Five-year cardiovascular risk charts based on the recalibrated Framingham model.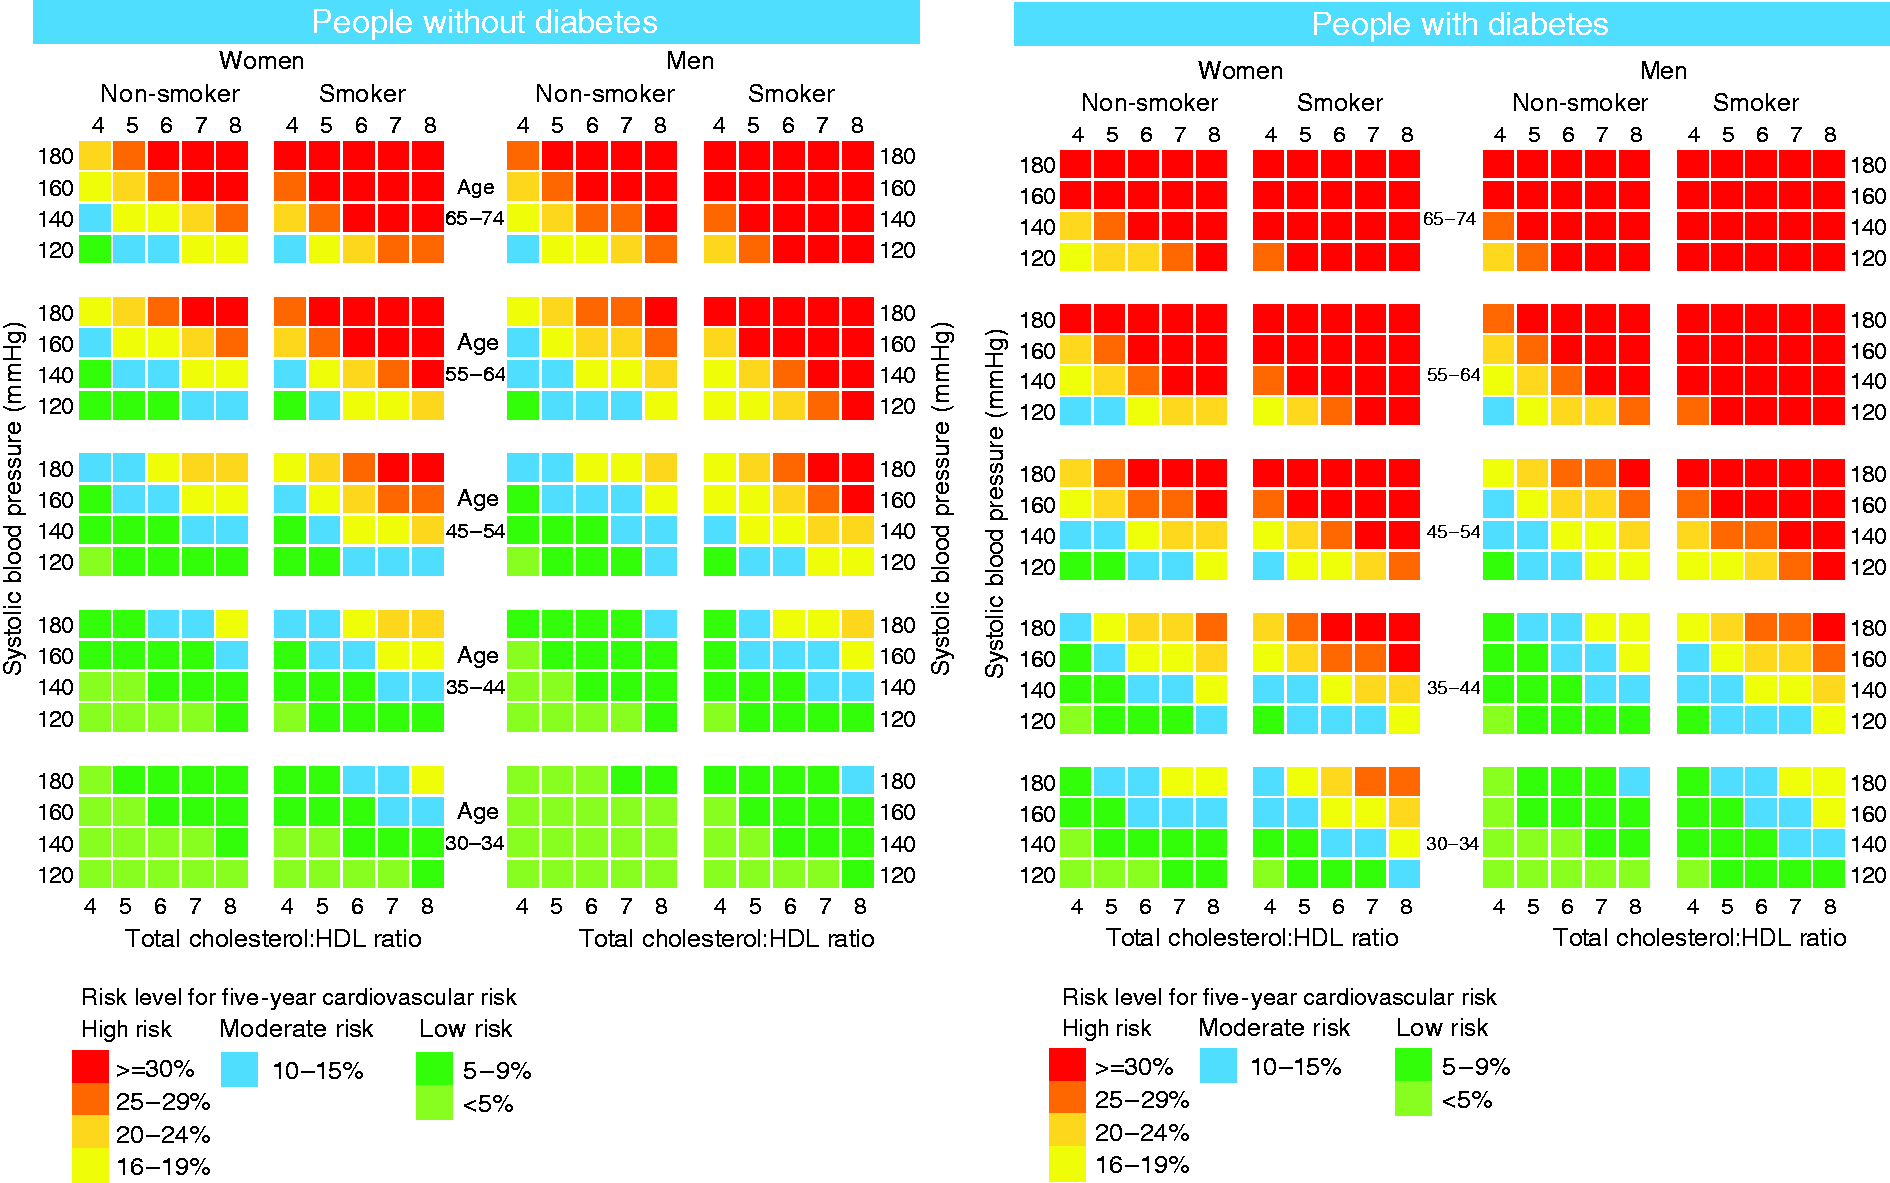
Discussion
The 1991 and 2008 Framingham CVD models substantially underestimated the absolute CVD risk in the Australian Indigenous cohort used in our study. Both models showed a lack of calibration to the observed CVD probabilities. Using the baseline risk from our study population we recalibrated the five-year CVD risk to a level considered acceptable by the developers of the Framingham model. 8 The recalibrated equation was used to calculate the first CVD risk chart based on empirical validation using long-term follow-up data from an Indigenous Australian population.
The high CVD risk among Indigenous people presented in this study is not unique in Australia. The Strong Heart Study found that CHD rates in American Indians exceed rates in other US populations and may more often be fatal. 20 A study in Canada found that Aboriginal people had a significantly higher frequency of CVD compared with Europeans (18.5% vs. 7.6%). 21 Although a variety of CVD risk models are available, few have been based on or calibrated using Indigenous-specific observed data. In the Strong Heart Study, both recalibration of the Framingham model and development of a specific risk equation for the American Indians have been conducted to help better stratify the CHD risk in this population.8,22 As far as we are aware there is no similar study for Indigenous Australians. So, instead of trying more CVD risk models which were built based on other populations, we feel it is important to generate/recalibrate a prediction tool based on Indigenous Australian data. We hope this study represents a first step to producing a more accurate estimate of CVD risk for Indigenous Australians.
Implications
There is an important practical application of this research, as a previous study on CVD risk identification and management in Indigenous Australians showed that more than half of this population were not screened for CVD as recommended in national guidelines for cardiovascular risk management. 23 Current guidelines for remote health services in Indigenous communities use a CVD Risk Assessment tool which is an adaptation of the general Australian CVD charts based on the 1991 Framingham model, 19 with a 5% upwards adjustment and additional estimates for a younger cohort aged 20–44 years. 24 In this study we provide a risk chart derived from the recalibrated Framingham model based on the actual risk observed in a remote Indigenous population and so provide evidence that enables prediction of risk to be refined.
The more accurate calculation of CVD risk will enable better identification for Indigenous Australians in primary prevention. However, the assessment of CVD risk is just one component of a wide range of strategies to improve Indigenous health and thereby achieve the Council of Australian Governments’ target on closing the gap in life expectancy. 25 To tackle the large numbers of high CVD risk patients more resources are required. This will need co-ordination with a range of primary care and allied health practitioners. Key to this will be the development of early risk intervention teams as well as broader community strategies such as improving infrastructure to promote healthy behaviours in Indigenous communities.
Future studies
After baseline calibration, there was no significant difference between the predicted and the observed five-year CVD risks. However, overestimation occurred when using the recalibrated 10-year prediction model, mainly because of overestimation in the older age group. Hence we produced five-year absolute CVD risk charts only. Unlike most guidelines in other countries that dictate therapeutic intervention strategies be based on 10-year CVD risk predictions, 26 currently Australian guidelines for primary prevention of cardiovascular disease are based on five-year CVD risk predictions. We believe the five-year risk charts produced in this study can provide a reference to identify Indigenous Australians with high CVD risk. However, future research should focus on generating more accurate predictions for 10-year CVD risk, so clinical decisions can be made based on both short-term and long-term risk predictions.
According to the data released by the Australian Bureau of Statistics, it was estimated that in 2011 there were 669,900 Indigenous people in Australia, accounting for 3% of the total Australian population; the largest population of Indigenous Australians lived in New South Wales (31.1%) and Queensland (28.2%); 34.8% of all Indigenous Australians lived in major cities of Australia, 43.8% people lived in inner or outer regional Australia and 21.4% lived in remote Australia. 27 Based on the Australian Aboriginal and Torres Strait Islander Health Survey in 2013, there was no significant difference in various health conditions and risk factors for Indigenous people across different states/territories in Australia. 28 While the present study used a cohort from North Queensland, our results are consistent with a previous study that used an Indigenous cohort from remote regions of central Australia and also showed that the Framingham model underestimated CHD rates. 13 Currently there is no corresponding study available on the CVD risk of Indigenous Australians in non-remote areas and so further external validation of our recalibrated model is required to determine the clinical utility of these risk charts in other Indigenous populations.
After adjustment of the baseline risk of the Framingham model in this study, calibration of the model largely improved but discrimination had no significant change. Previous studies have shown that other risk factors, such as urinary albumin creatinine ratio, waist circumference and triglycerides, also contributed to the development of CVD in a population with a high prevalence of diabetes.22,29,30 Social determinants such as education have also been reported as relevant to CVD risks.31,32 Another possible risk factor is rheumatic heart disease, which can increase the risk for certain types of CVD (heart failure and stroke) and has high prevalence and mortality rate among Australian Indigenous people.33,34 This suggests that further recalibration which includes other predictors of CVD risk or the development of a new model specifically for the Australian Indigenous population which incorporates these risk factors should be a research priority. It would also be interesting to look at the population attributed risk for each of the traditional and new risk factors in the Indigenous population, which would provide evidence to promote more targeted strategies to reduce CVD risks.
Strengths and limitations
Strengths of the present study include the use of a relatively large baseline sample, long follow-up and objective measures (rather than self-reported) of baseline risk factors. There are also some limitations of our study. The participants of this study were from remote Indigenous communities in Far North Queensland who volunteered to participate in a population screening program. The mode of recruitment may have influenced the representativeness of the sample, which would impact on generalizability if other factors not contained in the Framingham models influence risk (e.g. body mass index) and differ between the sample and the population. External validation on our recalibrated Framingham model should be conducted in future studies involving other Indigenous populations (e.g. Indigenous Australians living in urban areas). Second, parametric uncertainty was not considered in this study when comparing observed and predicted CVD probabilities, as no variance–covariance matrices were reported for the original Framingham CVD models. 35
Conclusion
In conclusion, we found that both the 1991 and 2008 Framingham model underestimated the CVD risk in the Australian Indigenous population by about one-third on average. A recalibrated equation was used to calculate the first risk chart based on empirical validation using long-term follow-up data from remote Indigenous communities in Far North Queensland.
Footnotes
Author contribution
XH, RM, TL and PC contributed to the conception or design of the work. XH, RM, TL, MW, AT, ML and PC contributed to the acquisition, analysis or interpretation of data for the work. XH, TL and PC drafted the manuscript. RM, MW, AT, ML and PC critically revised the manuscript. All of the authors gave final approval and agreed to be accountable for all aspects of work ensuring integrity and accuracy.
Declaration of conflicting interests
The author(s) declared no potential conflicts of interest with respect to the research, authorship, and/or publication of this article.
Funding
The author(s) disclosed receipt of the following financial support for the research, authorship, and/or publication of this article: The research reported in this presentation is a project of the Australian Primary Health Care Research Institute, which is supported under the Australian Government's Primary Health Care Research, Evaluation and Development Strategy. The information and opinions contained in it do not necessarily reflect the views or policy of the Australian Primary Health Care Research Institute or the Department of Health and Ageing. This study is supported by the Australia National Health and Medical Research Council project ‘Building a simulation model to improve cardiovascular disease risk prediction and treatment for Indigenous Australians’ (NHMRC/1107140). TL receives salary support as the HCF Research Foundation Postdoctoral Research Fellow.
References
Supplementary Material
Please find the following supplemental material available below.
For Open Access articles published under a Creative Commons License, all supplemental material carries the same license as the article it is associated with.
For non-Open Access articles published, all supplemental material carries a non-exclusive license, and permission requests for re-use of supplemental material or any part of supplemental material shall be sent directly to the copyright owner as specified in the copyright notice associated with the article.