
Abstract
The financial and public health crises that have impacted the global economy in the past two decades have heightened awareness of the importance of financial literacy for consumers, businesses, and governments. This study uses secondary school teacher and student pretest and posttest scores on the Test of Financial Literacy to identify persistence and changes in learning for teachers and students by content standard. Using non-random data collected as part of Mississippi's Master Teacher of Personal Finance standards-based teacher training program, results show that teacher participants know a lot about personal finance prior to the training and learn more during the training while their students do not know very much about personal finance prior to starting a class that includes this content and know a little more when they finish the class. Disaggregating teacher and student results shows that teacher knowledge about financial investing is relatively low, and student learning in investing, saving, and insuring is also low. The study highlights the need for implementation guidelines for teachers and required assessment for students. Specifically, the guidelines and assessment could be used to reallocate scarce resources more effectively to teach these content areas where deficiencies are identified.
This paper uses disaggregated pre- and posttest personal finance scores from secondary teachers who participated in a standards-based training and their students who were taught lessons from a standards-based curriculum to identify value added by standard for both groups. The study uses results from participants in the United States (US) constituent state of Mississippi's Master Teacher Personal Finance Program (MTPF) where knowledge was assessed using the Test of Financial Literacy (TFL). Both the MTPF curriculum and the TFL are aligned with the Council for Economic Education's National Standards for Financial Literacy (CEE, 2013). This study extends the work of Saunders and Powers (1995) by applying it to personal finance content and also using both teacher and student assessment results for each content area to identify patterns of persistence and change in learning. Conclusions from comparing disaggregated assessment results of teachers and their students lead to recommendations about the allocation of content coverage in the teaching of high-school personal finance to increase student learning. Results suggest that scarce resources for teaching high-school financial literacy may be more effective in increasing student knowledge if more coverage is allocated to content about saving, financial investing, and risk and insurance.
Although research findings on the effectiveness of financial literacy education have been mixed, a recurring conclusion is a need for personal finance education that provides teachers with a rigorous, well-organized plan accompanied by high-quality training and materials that are tied to state or national core content. Without state standards in financial literacy, the state of Mississippi created a new course that included personal finance content and used the national financial literacy standards as a guide. Analysis of this program provides a broader focus with applicability to states or countries without specific standards as well as those where standards are comparable to or patterned after the CEE's national standards (CEE, 2013).
Prior research
There is no more effective incident than a global crisis to bring attention to the importance of financial literacy. During the past 10–15 years, the worldwide financial crises of 2007–2009 and the coronavirus disease-2019 (COVID-19) global pandemic of 2020 have forced consumers, businesses, and governments to make difficult financial decisions and have highlighted the need for financially literate global citizens. During the past two decades, there has also been an increase in the delivery of financial literacy education and in research about its effectiveness. In 2000, there were seven states in the US that required a high-school course containing personal finance content to be offered (NCEE, 2005) while the number has increased to 24 states by 2020 (CEE, 2020). According to the Organisation for Economic Co-operation and Development's International Network on Financial Education (OECD/INFE), financial education is now recognized as a “core component of the financial empowerment of individuals and the overall stability of the financial system” (OECD, 2017: 3). The OECD/INFE developed and piloted a toolkit to measure financial literacy and financial inclusion in 2010, and, by 2015–2016, approximately 40 countries participated in an international survey of adult financial literacy competencies (OECD, 2018). In the latest round, results from 26 participating countries and economies across Asia, Europe, and Latin America show that financial literacy continues to be low among these economies (OECD, 2020). In a multi-country comparison of financial literacy of high-school students from New Zealand, Japan, and the US, Cameron et al. (2013) found that levels were poor in all three countries and substantially worse in New Zealand and the US, than in Japan.
Following the worldwide financial crises in 2007–2009, studies have linked financial literacy and personal financial resilience (e.g. Hasler and Lusardi, 2019), and this link has been confirmed by more recent results. Using data from the 2020 Teachers Insurance and Annuity Association of America (TIAA) Institute-Global Financial Literacy Excellence Center (GFLEC) Personal Finance (P-Fin) Index, Lusardi et al. (2020) show that many families in the US were financially fragile well before the COVID-19 pandemic wreaked havoc on the economy. The study also shows that financial fragility is strongly linked to financial literacy and that many Americans are not prepared to endure financial crises. This link underscores the importance of financial literacy education and is supported by findings about a variety of financial behaviors as well. Consumers with lower levels of financial literacy are less likely to plan for retirement (Lusardi and Mitchell, 2017), are more likely to borrow at higher interest rates (Huston, 2012), and are less likely to participate in the stock market (Van Rooij et al., 2011).
The evidence of widespread financial illiteracy and an increase in financial education in schools illustrates that improving financial decision making is a priority in many societies. Better management of financial resources can increase social welfare, and starting early offers an opportunity to start with a “blank slate” as described by Batty et al. (2015), so that educators can avoid having to correct misconceptions or bad habits already learned at home. Financial education, depending on the curriculum used, can also help children have more knowledge of and understanding about the world in which they live and prepare them to be engaged citizens (Davies, 2015).
Findings from research into the effectiveness of financial education have been mixed. While some studies (e.g. Amagir et al., 2018; Harter and Harter, 2009; Walstad et al., 2010) have shown that specific programs have positive effects on student knowledge of personal finance concepts, others (e.g. Mandell, 2008; Matheson et al., 2020; Peng et al., 2007) have found little to no support for the conclusion that financial education improves student knowledge or prepares students to be financially literate. Walstad et al. (2017) evaluated financial education for a variety of groups and issues and found financial education to have positive outcomes but that the outcomes vary for different groups. Totenhagen et al. (2015) also performed a comprehensive review of literature investigating financial education for young students and identified characteristics that lead to positive outcomes. Studies of the effectiveness of financial education on financial behaviors have shown that young people and adults who have received financial education are subsequently more likely than others to exhibit positive behaviors in some areas of financial decision making (e.g. budgeting and saving) but not in others (e.g. use of credit and credit default) (Bruhn et al., 2016; Kaiser and Menkhoff, 2020). In studying the effects of mandating financial education for high-school graduation, Urban et al. (n.d.) conclude that while a mandate does not necessarily improve financial behaviors, implementing the mandate through a “rigorous educational program that is tailored to a state's population” (Urban et al., n.d.: 22) can have positive outcomes.
Despite mixed results, the overarching conclusion is that effective financial education is aligned to standards and benchmarks, taught by a knowledgeable instructor, begun early, and addresses diverse backgrounds and levels of knowledge. Teachers play a critical role in this prescription for effective financial education but may lack financial literacy (De Beckker et al., 2019; Harter and Ratliff, 2020) or confidence in their ability to teach financial education (Sawatzki and Sullivan, 2017). Therefore, effective training accompanied by high-quality curriculum materials is essential. As Compen et al. (2019) noted in a literature review of the role of teacher professional development in financial literacy education, there is a lack of assessment results of teachers’ skills regarding financial education, in particular. They recommend that this should be a starting point for teacher professional development initiatives. This analysis of the effectiveness of the Mississippi MTPF program adds to this literature.
This study supports the findings that students who are taught by teachers who received standards-based training and used standards-based materials to teach their students do perform better from pretest to posttest on a knowledge test. The analysis extends work that has been done in financial literacy education by offering a new look at disaggregated pre- and posttest scores of teachers and their students. Both the assessment and the curriculum used in this project are aligned with national standards that offer a comprehensive guide to what high-school students should know to be financially literate. By examining disaggregated results for both teachers and students, the study identifies value added by content standard. The results lead to recommendations about effective use of scarce resources in high-school financial education.
Study design and data
A pretest–posttest research design was employed to investigate impacts of a standards-based teacher training program on teacher and student knowledge in personal finance. Data were collected during 2018–2020 as part of the implementation of a new College and Career Readiness high-school class in Mississippi (State Treasury, 2018). During 2018, the Mississippi Council on Economic Education (MCEE) worked with the Federal Reserve Bank of St. Louis to develop a Master Teacher of Personal Finance training program to prepare teachers to teach the new class that included personal finance content. The Federal Reserve Bank of St. Louis developed a Master Teacher Personal Finance curriculum for use in the high-school classroom (Federal Reserve, 2018). Economic education specialists from the Federal Reserve Banks of Atlanta and St. Louis worked with MCEE to prepare Mississippi teachers to use this curriculum to teach the new course.
A total of 70 teachers participated in professional development training during the summers of 2018 and 2019 and then were expected to teach the program in their secondary classes during the academic year following the training. They completed a pretest before beginning the 5-day MTPF teacher training and completed a posttest at the end. Teachers were allowed to choose which and how many lessons they used from the curriculum as they taught the high-school course to their secondary students during the following academic year and pre- and posttested their students. After using the curriculum with students, they completed a follow-up survey to describe their use of the curriculum.
Of the 70 teachers who participated in the teacher training, 34 used the MTPF curriculum with their students and completed the assessment procedures. Participation was capped at 30 teachers for the pilot program in 2018, and 27 teachers completed the training. In 2019, 43 teachers completed the training. Most of the attrition occurred in the second year and at various stages as some teachers did not use the curriculum, some pretested students only, some pre- and posttested students but did not complete the teacher follow-up survey, and some did not test students at all. The MTPF program did not incentivize or require use of the curriculum and student testing, instead leaving the choice up to teachers. The unexpected COVID-19 global pandemic very likely decreased participation in the second year. There were only three teachers who fully participated in the project during the spring semester of 2020. During this time, schools had to move to online instruction as the pandemic shut down traditional, in-person instruction throughout the country. There is no way to know whether the teachers and their students who did not fully participate were systematically different from those who stayed in the program, but there is no particular reason to expect that they were. A small number of teachers who did not complete the program offered that teacher reassignments and job changes led to their attrition.
From these 34 teachers, there were 567 students with matched scores on the completed pretest and posttest. To count the assessments as completed, students had to provide answers for at least 23 of the 45 questions. If students did not answer at least half of the test, the response was not counted as complete even if the student submitted it. As is common with this type of study, there were a variety of reasons why some students did not complete all of the assessments and surveys including illnesses or other reasons for missing school on a test day or moving into or out of the class or school between the pretest and the posttest. Also, Mississippi Student Identification Numbers were used to combine pretest and posttest results, and these numbers were entered by students. Some observations were lost because of typographical errors and students not including all of the digits. Some students may not have known their identification numbers and left these blank or typed unusable responses.
Teacher and student knowledge was measured using the standardized, 45-question, multiple-choice TFL as a pretest and a posttest. This test was created to measure the achievement of high-school students in units or courses that emphasize content and instruction in personal finance. It was designed to assess student understanding of the content contained in the National Standards for Financial Literacy (CEE, 2013). Evidence describing statistical reliability and content and construct validity is provided in the Test of Financial Literacy Examiner's Manual (Walstad and Rebeck, 2016).
The National Standards for Financial Literacy include benchmarks in each of six major content areas for personal finance instruction (earning income, buying goods and services, saving, using credit, financial investing, and protecting and insuring). The Master Teacher Personal Finance curriculum is aligned with the standards and, specifically, with the 12th-grade benchmarks associated with those standards. The framework for the course content is intended to provide teachers and students with a foundation in decision making and “transitions that build and refine personal finance knowledge and skills” (Federal Reserve, 2018: 4). Therefore, curriculum creators added an additional standard in decision making that is presented prior to introducing the six standards that make up the national standards. Both the curriculum and the assessment used in this study are aligned with the standards.
Descriptive results
As part of the pretest, teachers and students were asked demographic questions. Descriptive statistics for the teachers are provided in Table 1. The training completed by these teachers was voluntary; so, the participants are likely those who have an interest in personal finance content and/or are assigned to teach it. This is not a random sample, and, if there is bias in the sample, it could arguably go either way in terms of pretest results. That is, the teachers in our sample might be more knowledgeable about or have more interest in personal finance education—or, they may be teachers who have less knowledge of or interest in the subject but have been tasked with teaching it as part of the new College and Career Readiness course requirement in Mississippi. Either way, the teachers are motivated to learn the content so posttest results are likely biased in the direction of overestimating knowledge as compared to a typical Mississippi teacher of personal finance content.
Mean values of scores and descriptive statistics for teachers (standard deviation in parentheses).
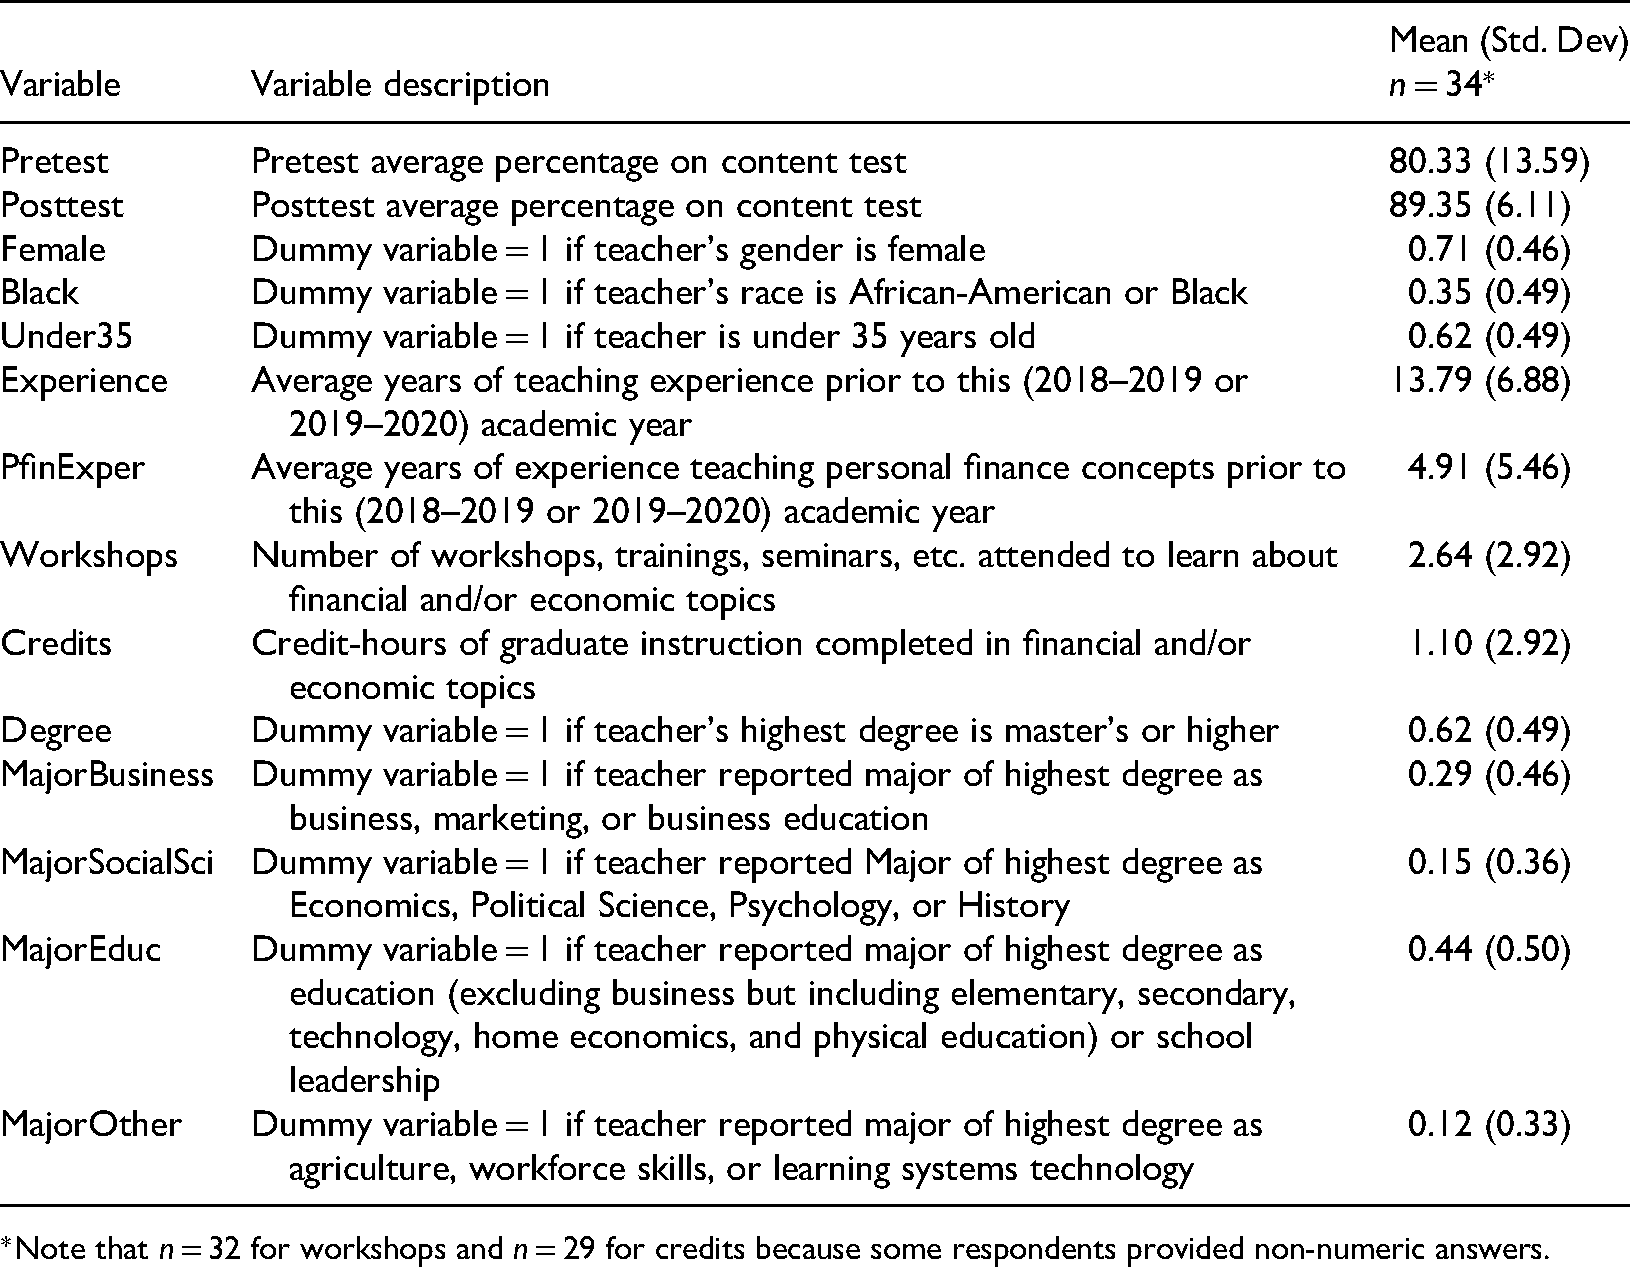
*Note that n = 32 for workshops and n = 29 for credits because some respondents provided non-numeric answers.
Examining Table 1, we see that nearly three-fourths of the teachers in the study are female, about 35% are Black, and about 62% are below the age of 35 years. While the sample is not random, the demographics are comparable to those statewide where about 80% of Mississippi public school teachers are female and 27% are Black (Skinner, 2019). Although we cannot compare the percentage of teachers in the sample who are under 35 years with a state or national average because it is unavailable for this same cutoff, about 71% of public-school teachers in the US are under 50 years old (Ryberg, 2020). Teachers in this sample average about 14 years of teaching experience with an average of nearly 5 years of teaching in the area of personal finance. The average number of workshops, trainings, seminars, etc. attended to learn about personal finance concepts is almost 3 while the average number of graduate credits earned in the content area of personal finance is 1.10. About 62% of the teachers have a master's degree or higher, which is comparable to 57% of teachers nationwide who had this same level of education in 2017–2018 (NCES, 2018). Most of the teachers in this sample have studied either business content areas (29%) or education (44%) as the major area of study in their highest degree program.
Teachers earned an average of 80% on the TFL as a pretest and an average of 89% on the posttest TFL. Using a paired t-test to compare the pre- and postscores, the t-statistic of 3.67 with a p-value of 0.000 shows that the increase in score from the beginning of the five-day training to the end is statistically significant. Keeping in mind that we do not have a random sample, the result at least suggests that the increase in score from pretest to posttest is not attributable to chance and that the teachers did learn more about personal finance content during the training. Given that teachers who attended the voluntary training are likely those who either are already knowledgeable about the content or those who have been assigned to teach it and need to learn it, the result that there was a detectable gain in achievement for this group is notable. It is not entirely surprising, though, because the Mississippi Council on Economic Education requires the teachers to pass the test with a score of at least 80% before they can become a certified Master Teacher of Personal Finance. They can take the test multiple times to achieve this score, and only the score from the first attempt is included in this analysis. It is possible that the teachers are more highly motivated by this incentive than they might be in other teacher training scenarios.
Table 2 provides descriptive statistics for the student sample. About one-half of the students were female, and 60% were Black while about 75% were in high school as opposed to middle school. According to the Mississippi Department of Education, for the 2019–2020 school year, 49% of students enrolled in public schools were female and 48% were Black or African-American (MDE, 2021); so, while our sample is representative in terms of student gender there is a higher percentage of Black students than in the public school system at large. Less than one-half of the students in our sample lived primarily with both parents, which is lower than the estimated 56% of Mississippi children who lived with two parents in 2015–2019 (Kids Count Data Center, 2021). However, there is no way to know what percentage of those children were of secondary school age.
Mean values of scores and descriptive statistics for students (standard deviation in parentheses).
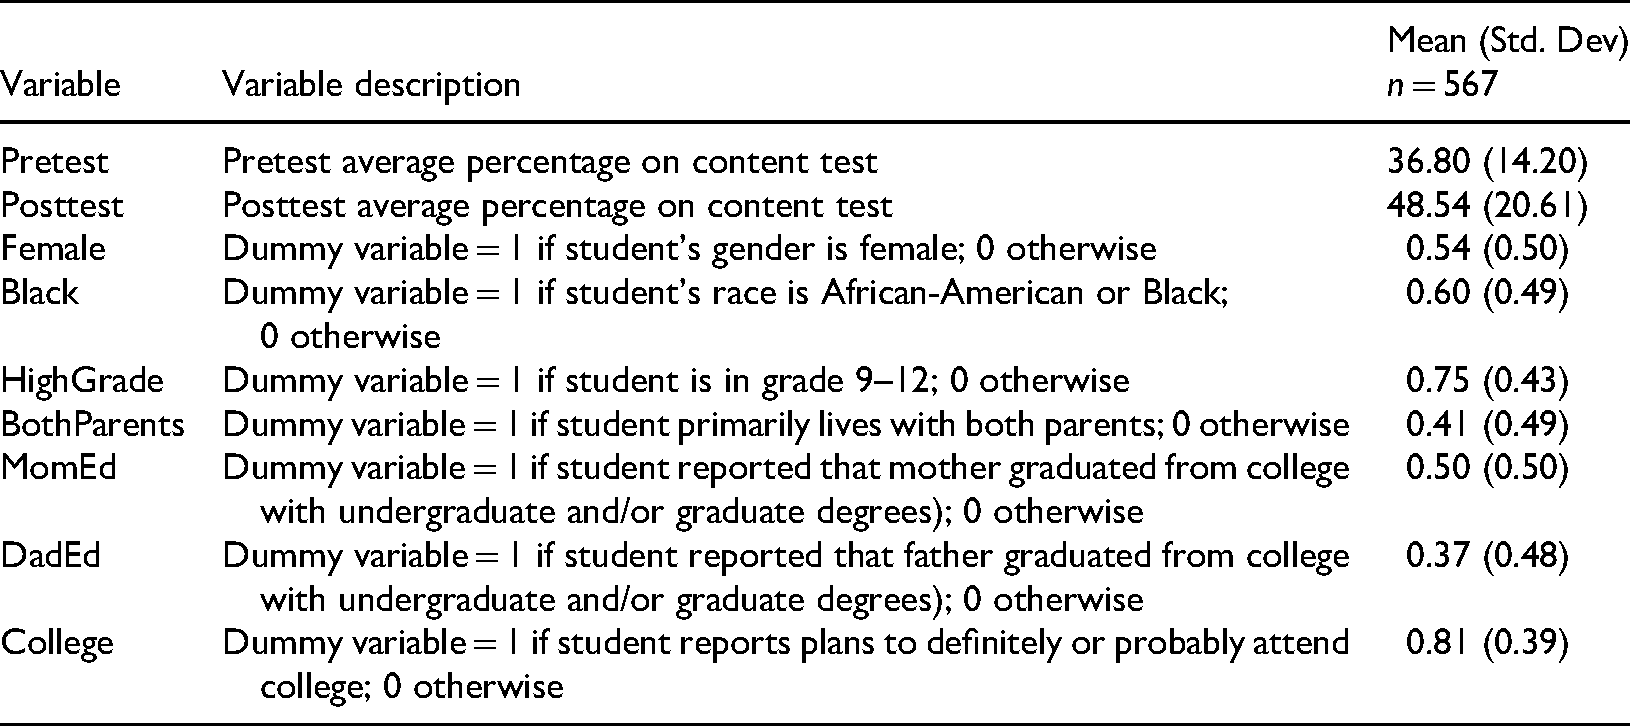
About 81% of the students reported they will definitely or probably attend college, and, of the students who reported parents’ levels of education, 50% said their mothers had at least a bachelor's degree while 37% said the same for their fathers. These percentages are considerably higher than the 23% of female and 18% of male Mississippians who earned bachelor's degrees or higher as reported in the 2020 American Community Survey (TownCharts, 2021). The self-reported sample data suggest that students in this sample live in households that are more educated than a typical Mississippi household. Considering that our sample may be overrepresentative of students who are Black, students who do not live with both parents, and students whose parents are college-educated, these differences could lead to biases toward higher scores or lower scores, overall, as compared to a randomly selected sample with no clear indication of one direction or the other.
Quantitative measures of changes in student understanding of personal finance concepts were captured with the TFL administered before and after the concepts were taught in the classroom. It is clear, and not surprising, that Mississippi students are not as knowledgeable about personal finance as the teachers who participated in this project. While the average pretest score of 37% and the average posttest score of 49% are low, there is a 32% improvement from the pretest to the posttest. As a point of reference for the Mississippi student assessment results, the results can be compared to the sample results included in the TFL Examiner's Manual. The test was administered to a sample of high-school students, the majority of whom had received instruction in personal finance or economics either during the school year or in a prior year. There is no assertion that the sample is representative of the target population, but the results are “suggestive of the type of test results that would be obtained from many students” (Walstad and Rebeck, 2016: 12). Their results include 1218 students from 48 high schools, 73% of which had received instruction in economics or personal finance. The mean was 52% for the students who had received instruction and 45% for students who had not received instruction in personal finance. Comparing the average score for students with no instruction with the pretest average for the Mississippi students, the national sample group average of 45% is higher than the Mississippi students’ pretest average of 37%, but, comparing the average score for the national group that received instruction with the posttest average for the Mississippi students, the national sample average of 52% is much closer to the Mississippi students’ posttest average of 49%. Of course, what type of instruction occurred or how much time was spent on the content is unknown, but this does provide a relative standard to which the results from the students in Mississippi can be compared. Taking into account that Mississippi's poverty rate is the highest in the US (US Census, 2019a), the percentage of the population that is non-White is fourth highest in the US (World Population Review, 2021), and the state has the lowest percentage of the population 25 years or older with a bachelor's degree (US Census, 2019b), the improvement in learning is particularly striking. Bumcrot et al. (2011) found that statewide poverty levels are inversely related to states’ financial literacy scores and observed lower financial literacy levels among women, those with low levels of education, and African-Americans and Hispanics. The increase from a lower average pretest score to nearly the same as the national sample average posttest score in a state with such low indicators is persuasive support for high-school financial literacy education.
As in the teacher training, the same test was used for both the student pretest and the student posttest. Using a paired t-test to compare the pre- and postscores, the t-statistic of 14.70 with a p-value of 0.000 shows that the increase in score from the pretest to the posttest is highly statistically significant. Even though the sample is not random, the statistical significance is compelling. The result suggests that teachers who were trained in and used the curriculum to teach their students did see increases in student scores from pretest to posttest that are not likely attributable to chance.
Analysis of disaggregated assessment scores
A disaggregation of test scores provides the opportunity to study the change in knowledge or understanding that occurred for teachers and students from the time they started the program to the end. By separating knowledge that participants already have in the subject matter from positive gains in learning, we can identify value added. Because the same test was used as the pretest and posttest, we can analyze the pattern of pretest and posttest responses to individual test items and create scores that measure different learning outcomes as outlined by Saunders and Powers (1995) and also used by Walstad and Wagner (2016). They define positive learning (PL) as gains in understanding that would be reflected as not answering a question correctly on the pretest but answering it correctly on the posttest. Retained learning (RL) would occur when the teacher answers the question item correctly on both the pretest and the posttest while negative learning (NL), or loss of understanding, would occur if the teacher answered the question correctly on the pretest but then missed it on the posttest. Zero learning (ZL), or continued misunderstanding, occurs when the teacher misses the test item on both the pretest and the posttest.
Table 3 shows the change in performance from the pretest to the posttest in terms of response patterns defined as PL, RL, NL, and ZL. All of the scores are presented as percentages. These results show that the teacher training was effective in terms of increasing teacher knowledge. They were already knowledgeable about much of the content as shown by RL being the highest score, by far, on both the pretest and the posttest. PL did occur, and that is the second highest score. There is little ZL and even less NL, which indicates that the curriculum and training are successful in increasing teacher knowledge as measured by the TFL.
Teacher and student assessment results by type of learning (standard deviation in parentheses).
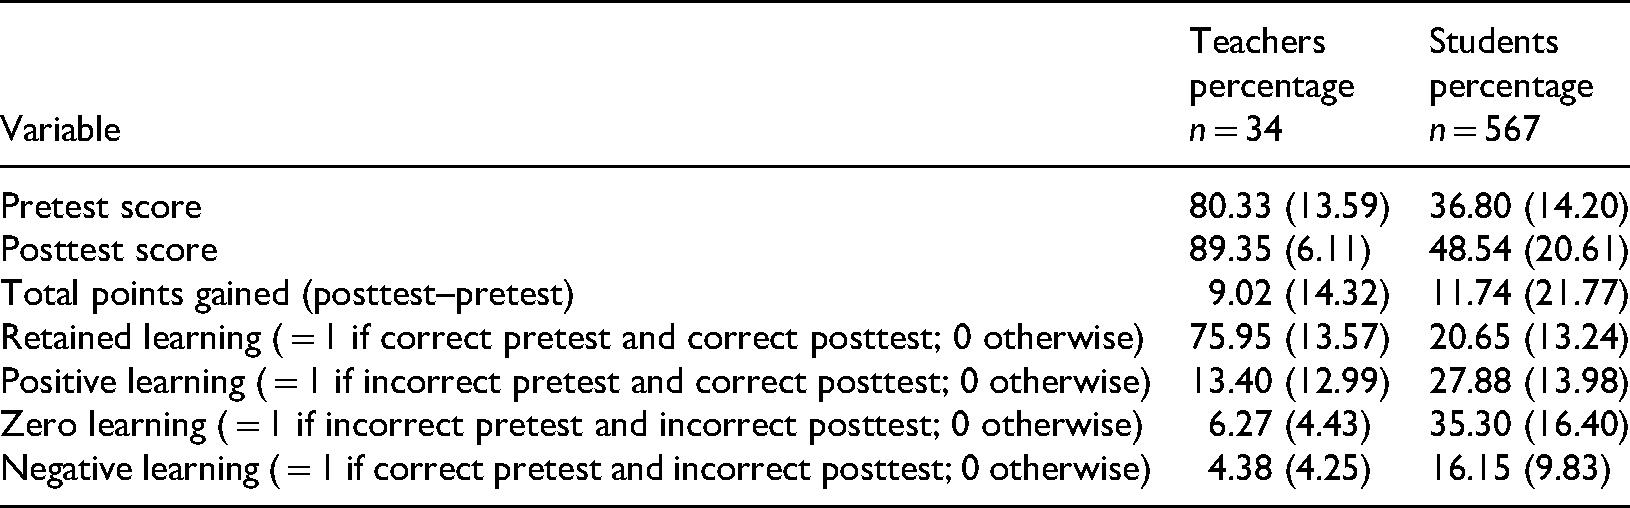
Table 3 also shows the change in performance for students from the pretest to the posttest in terms of PL, RL, NL, and ZL. RL occurs on about 21% of the assessment, and PL is higher at 28%. It is of concern that NL does offset more than half of the PL, and this is an important finding that would be missed if we focused only on examining gains from pretest to posttest instead of disaggregated response patterns. We also see that ZL, or continued misunderstanding, is the highest score. This is not entirely surprising given the use of the research-based TFL assessment where scores are expected to be much lower than those typical of teacher-created tests. The TFL also incorporates all of the national standards while individual teachers might not have taught lessons covering each standard. It is also possible that high-school students have acquired misconceptions about some financial concepts, and these persist, as was the case for students from Belarus, Japan, and the US in Borodich et al. (2010).
Figure 1 depicts the breakdown of RL, PL, NL, and ZL for both teachers and students for visual comparison. The only type of learning with a higher average for teachers than for students is RL, illustrating that teachers knew a lot about this content, and the learning persisted from the beginning to the end of the training. The type of learning with the highest average percentage for students is ZL, where they missed questions on the pretest and missed the same questions on the posttest. The lowest average type of learning for both groups is NL, and this indicates that the teaching and training that occurred both in the summer teacher training program and, then, in the teachers’ own classrooms added value.
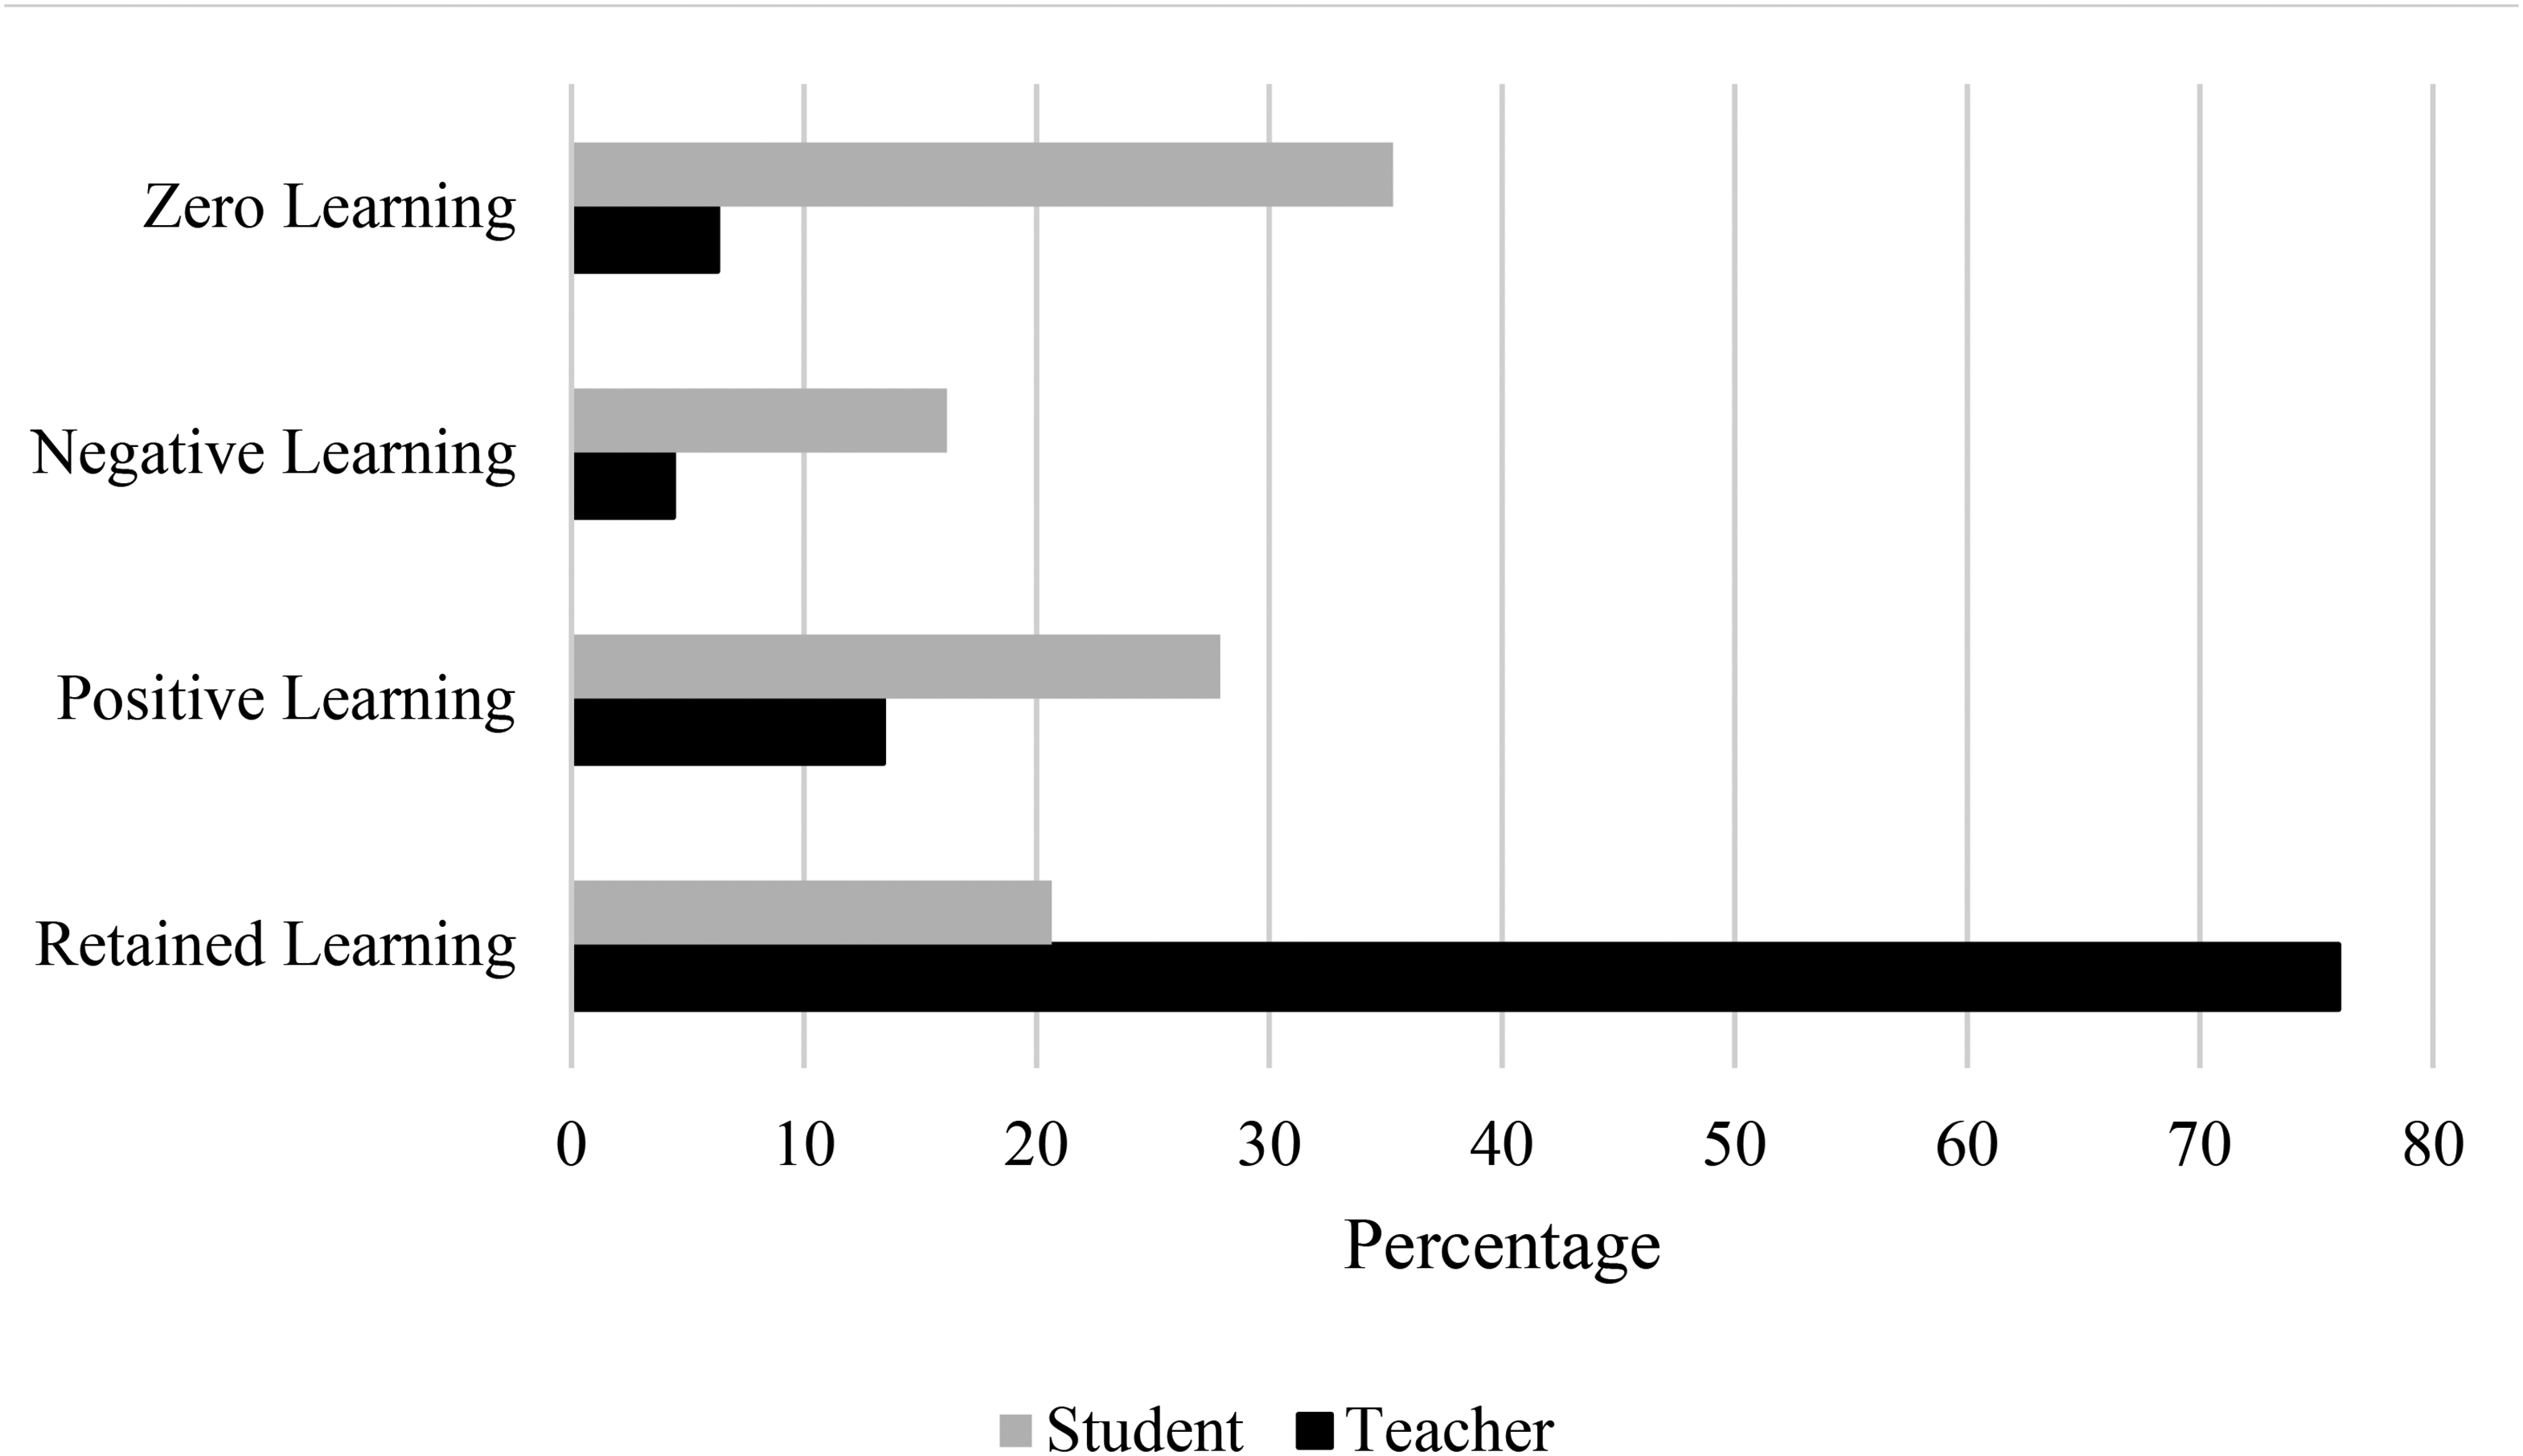
Teacher and student disaggregated test scores.
Table 4 shows the average gains from pretest to posttest by each of the personal finance standards. We see that there are gains in average score for all of the standards for both teachers and students. The largest gains for teachers are in the content areas of decision making, earning income, investing, and protecting and insuring. The lowest gain in average score was in the area of buying goods and services. This is where teachers had the highest average score on the pretest, so the small gain is not surprising.
Teacher and student gains from pretest to posttest by standard.
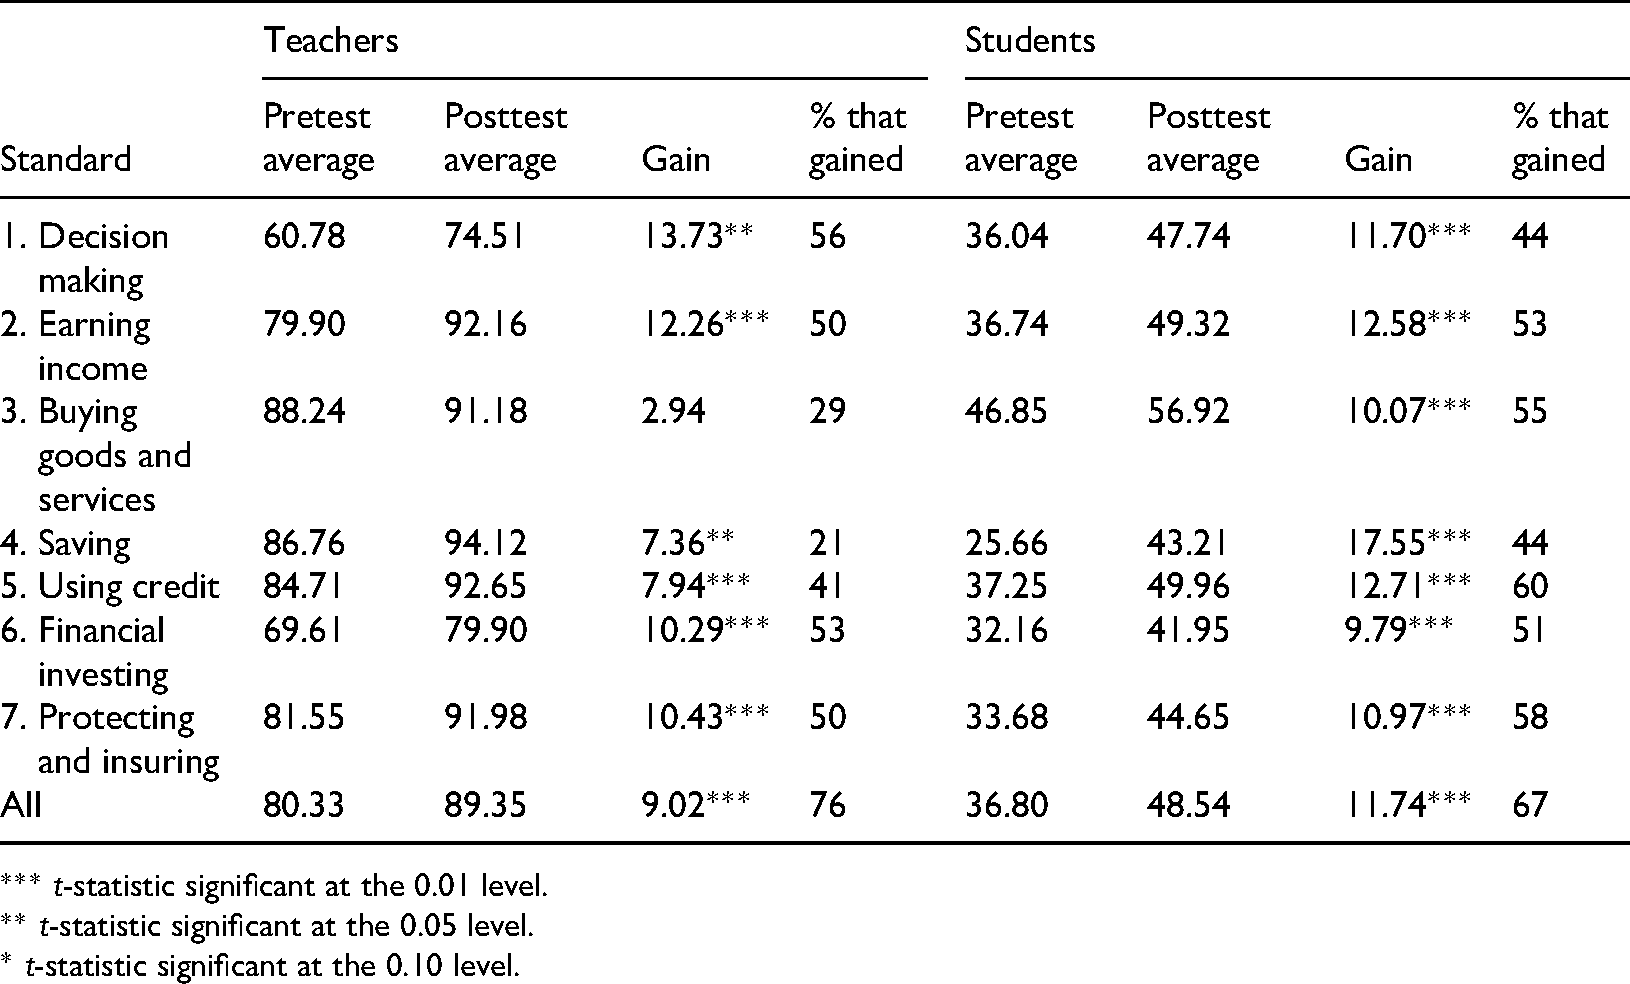
*** t-statistic significant at the 0.01 level.
** t-statistic significant at the 0.05 level.
* t-statistic significant at the 0.10 level.
Examining average student gains by content standard, Table 4 shows that the largest gains in average score for students are in the content areas of decision making, earning income, saving, and using credit. The lowest gains in average score for students are in content related to buying goods and services, financial investing, and protecting and insuring. As was the case for teachers, students also had a relatively high average pretest score in buying goods and services, so the smaller gain is not surprising. However, the average score on questions related to financial investing was low on the pretest, and the smallest overall gain was in this content area. Teachers also had low average scores on questions related to financial investing. Students scored low on questions related to protecting and insuring on the pretest, and the gain in average score was also relatively low in this area. The content covered in both standards 6 and 7 covers concepts with which secondary students may have less practical experience than others.
As shown in the column titled “% that Gained” for teachers and students in Table 4, the increase in average scores is not attributable to gains by only a few of the participants. This column shows the percentage of the total number of teachers and students that experienced a positive gain from the pretest score to the posttest score for a particular standard and overall. We see that, overall, 76% of teachers and 67% of students did increase their scores on the posttest while different percentages improved scores in specific content areas. The distributions of the gain in percentage points over all of the participants are illustrated in Figures 2 and 3 below.
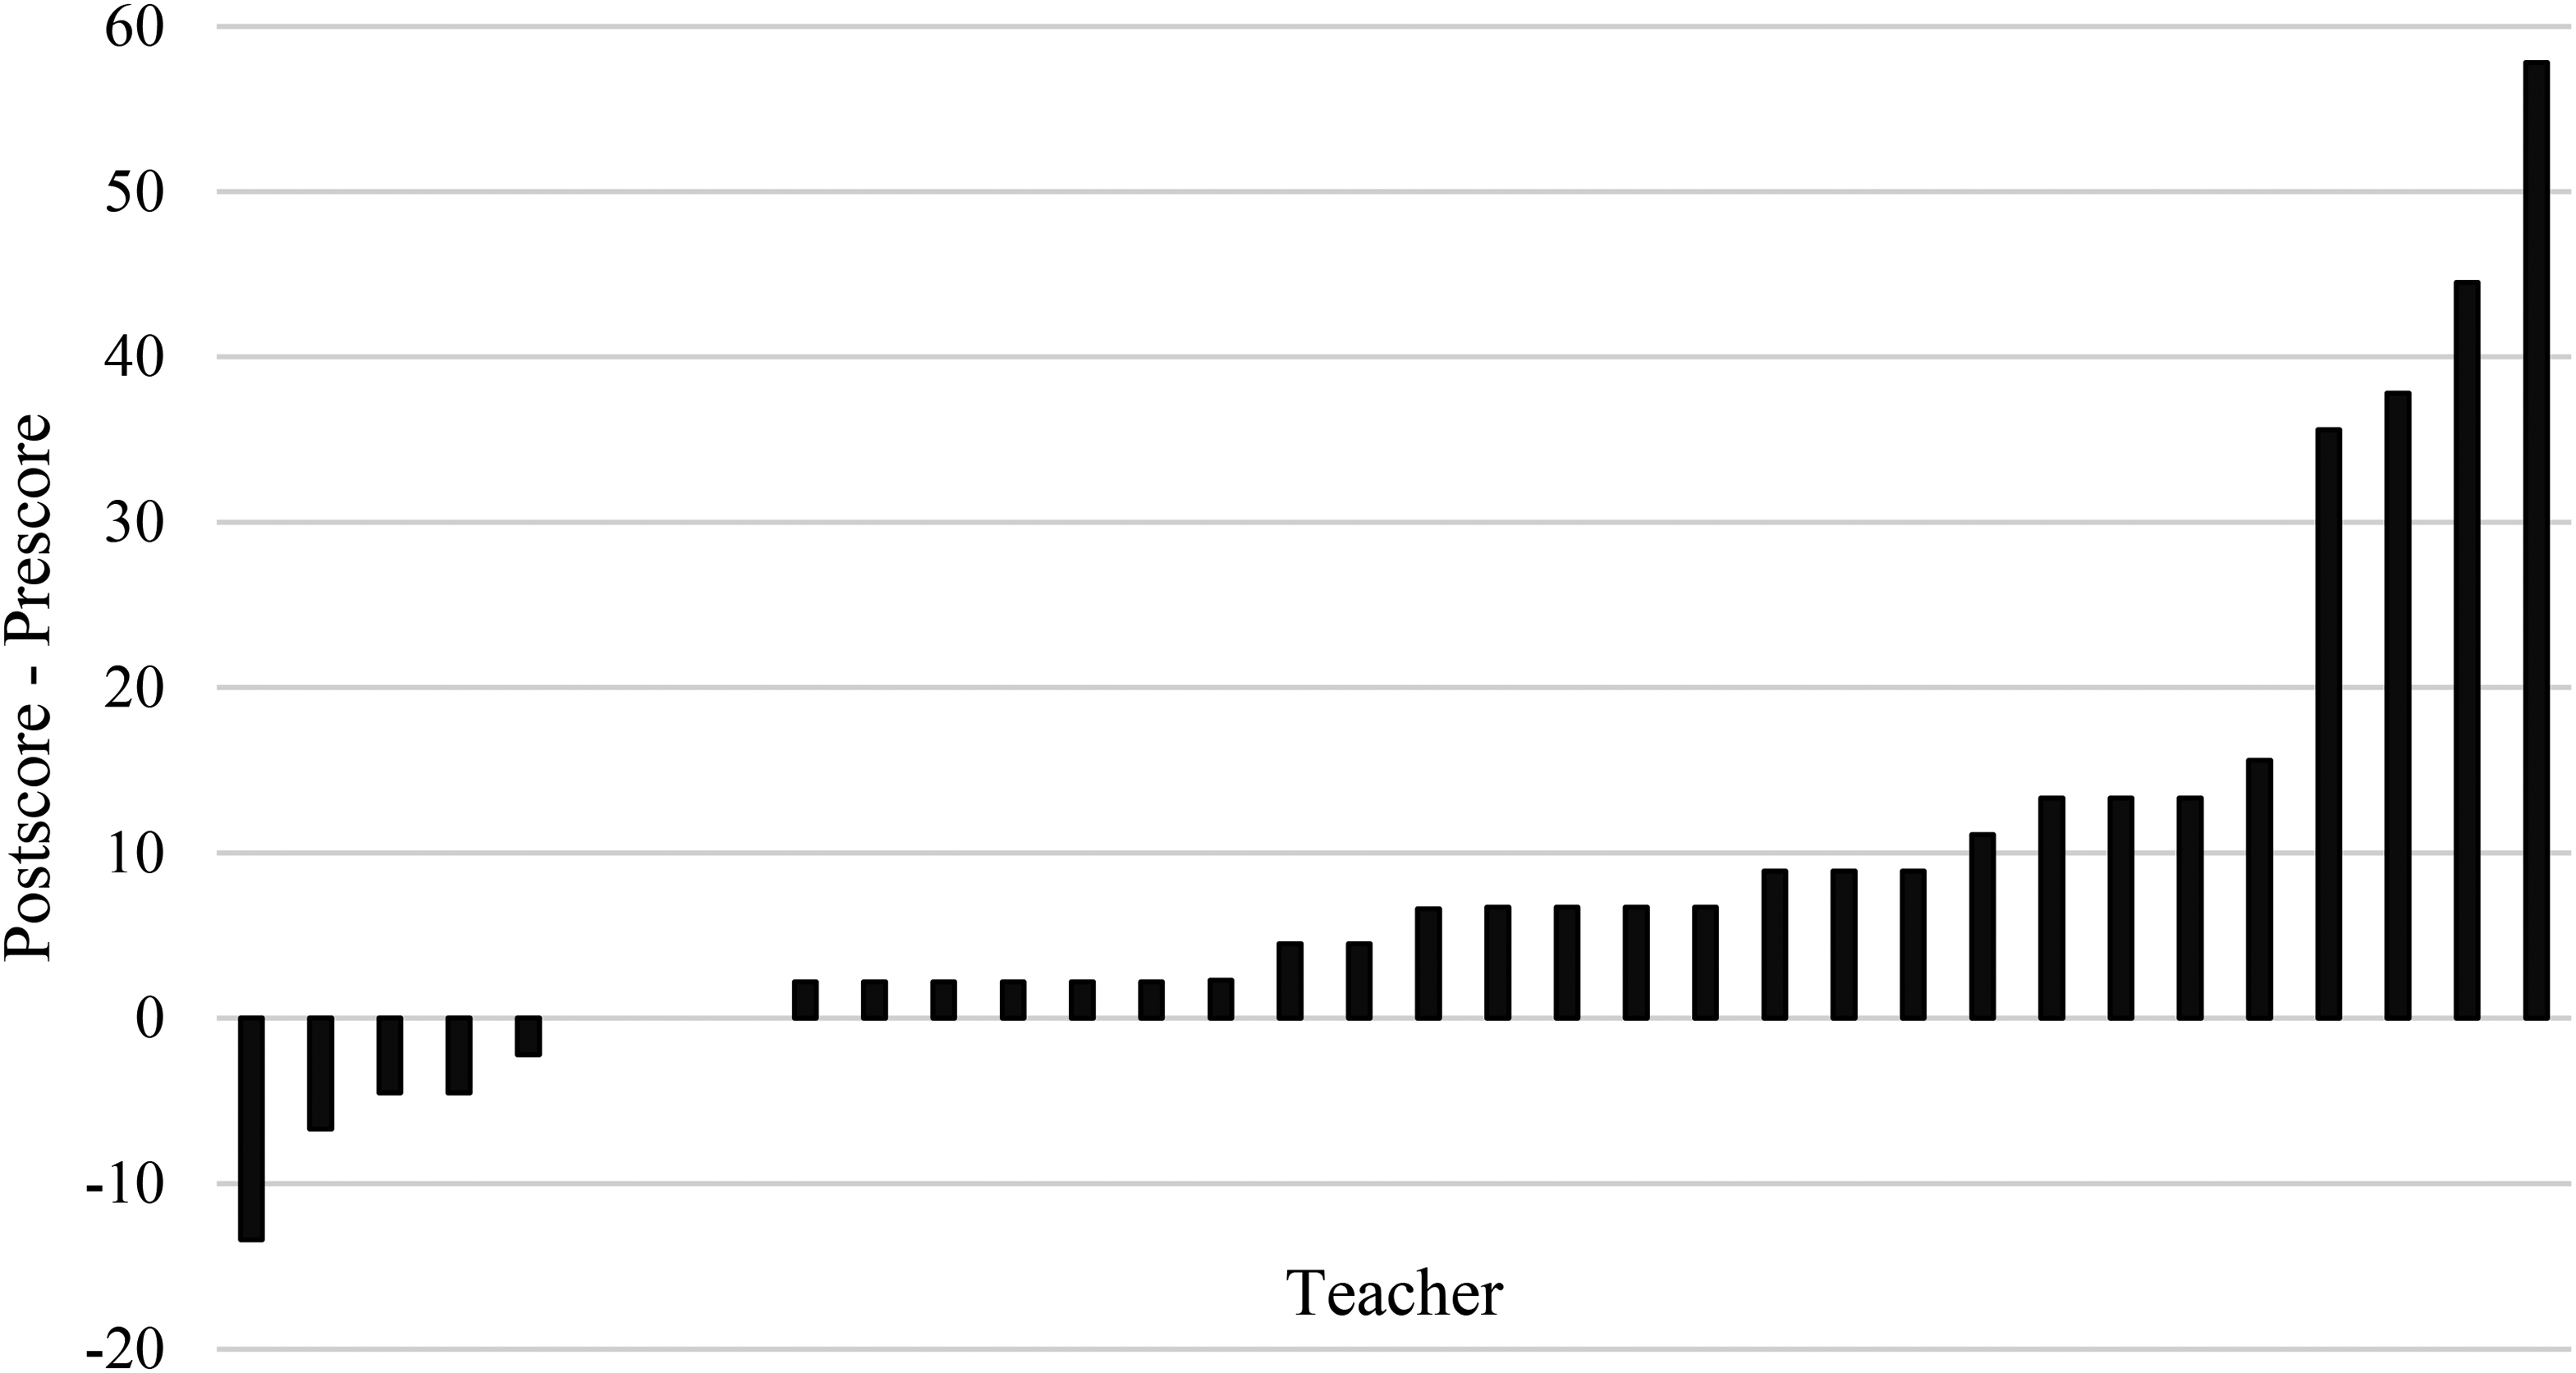
Teacher gains from pretest to posttest.
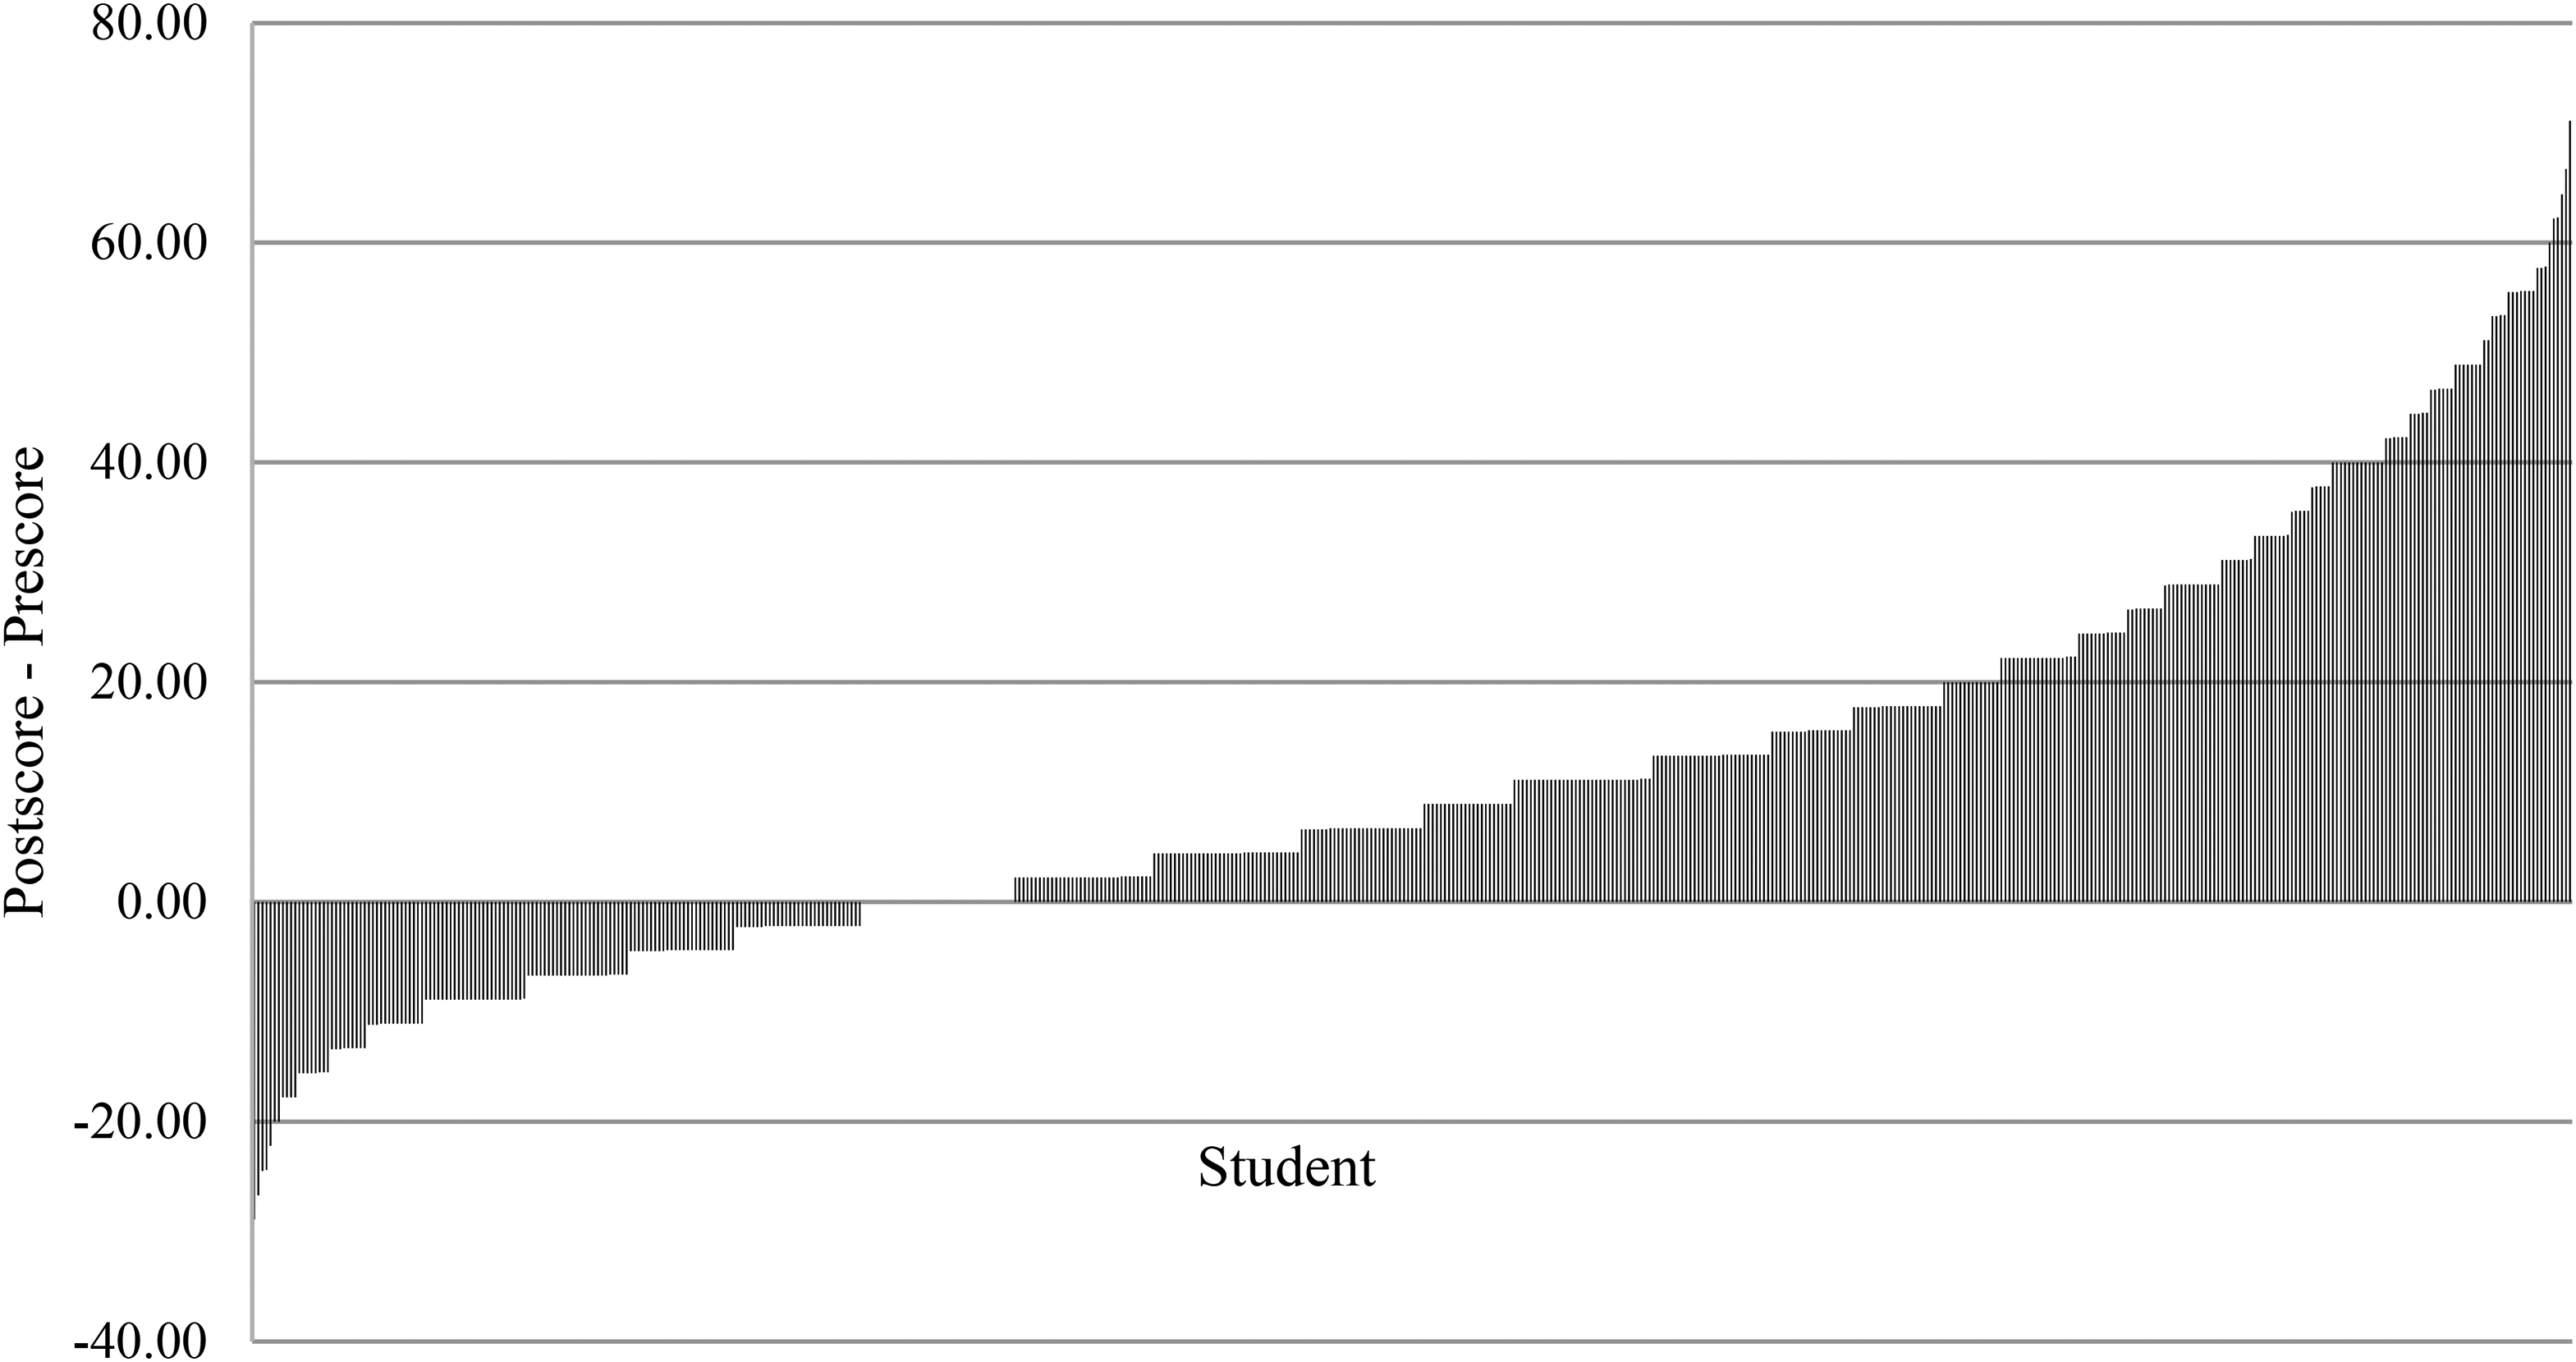
Student gains from pretest to posttest.
While we see that teachers primarily exhibited RL and students primarily exhibited ZL, Figures 4 and 5 illustrate more specifically how the types of learning determined from disaggregating the test scores are spread over the content standards. To analyze the differences in disaggregated scores by standard and type of learning, we follow procedures used by Saunders and Powers (1995) and use a t-test to test a null hypothesis that, for a given response pattern (or type of learning), the mean percentage for an individual content standard is equal to the mean percentage for all of the other content standards combined. This analysis can be used to refine teacher training and reallocate efforts in teaching financial literacy to improve knowledge outcomes. Educators who teach teachers and secondary teachers themselves can increase value-added by reallocating efforts away from areas where RL is high and toward content areas where NL or ZL is high. This information is also helpful when deciding how many content areas to cover in a limited amount of instruction time. It may be most effective to teach areas where PL has been shown to be high.
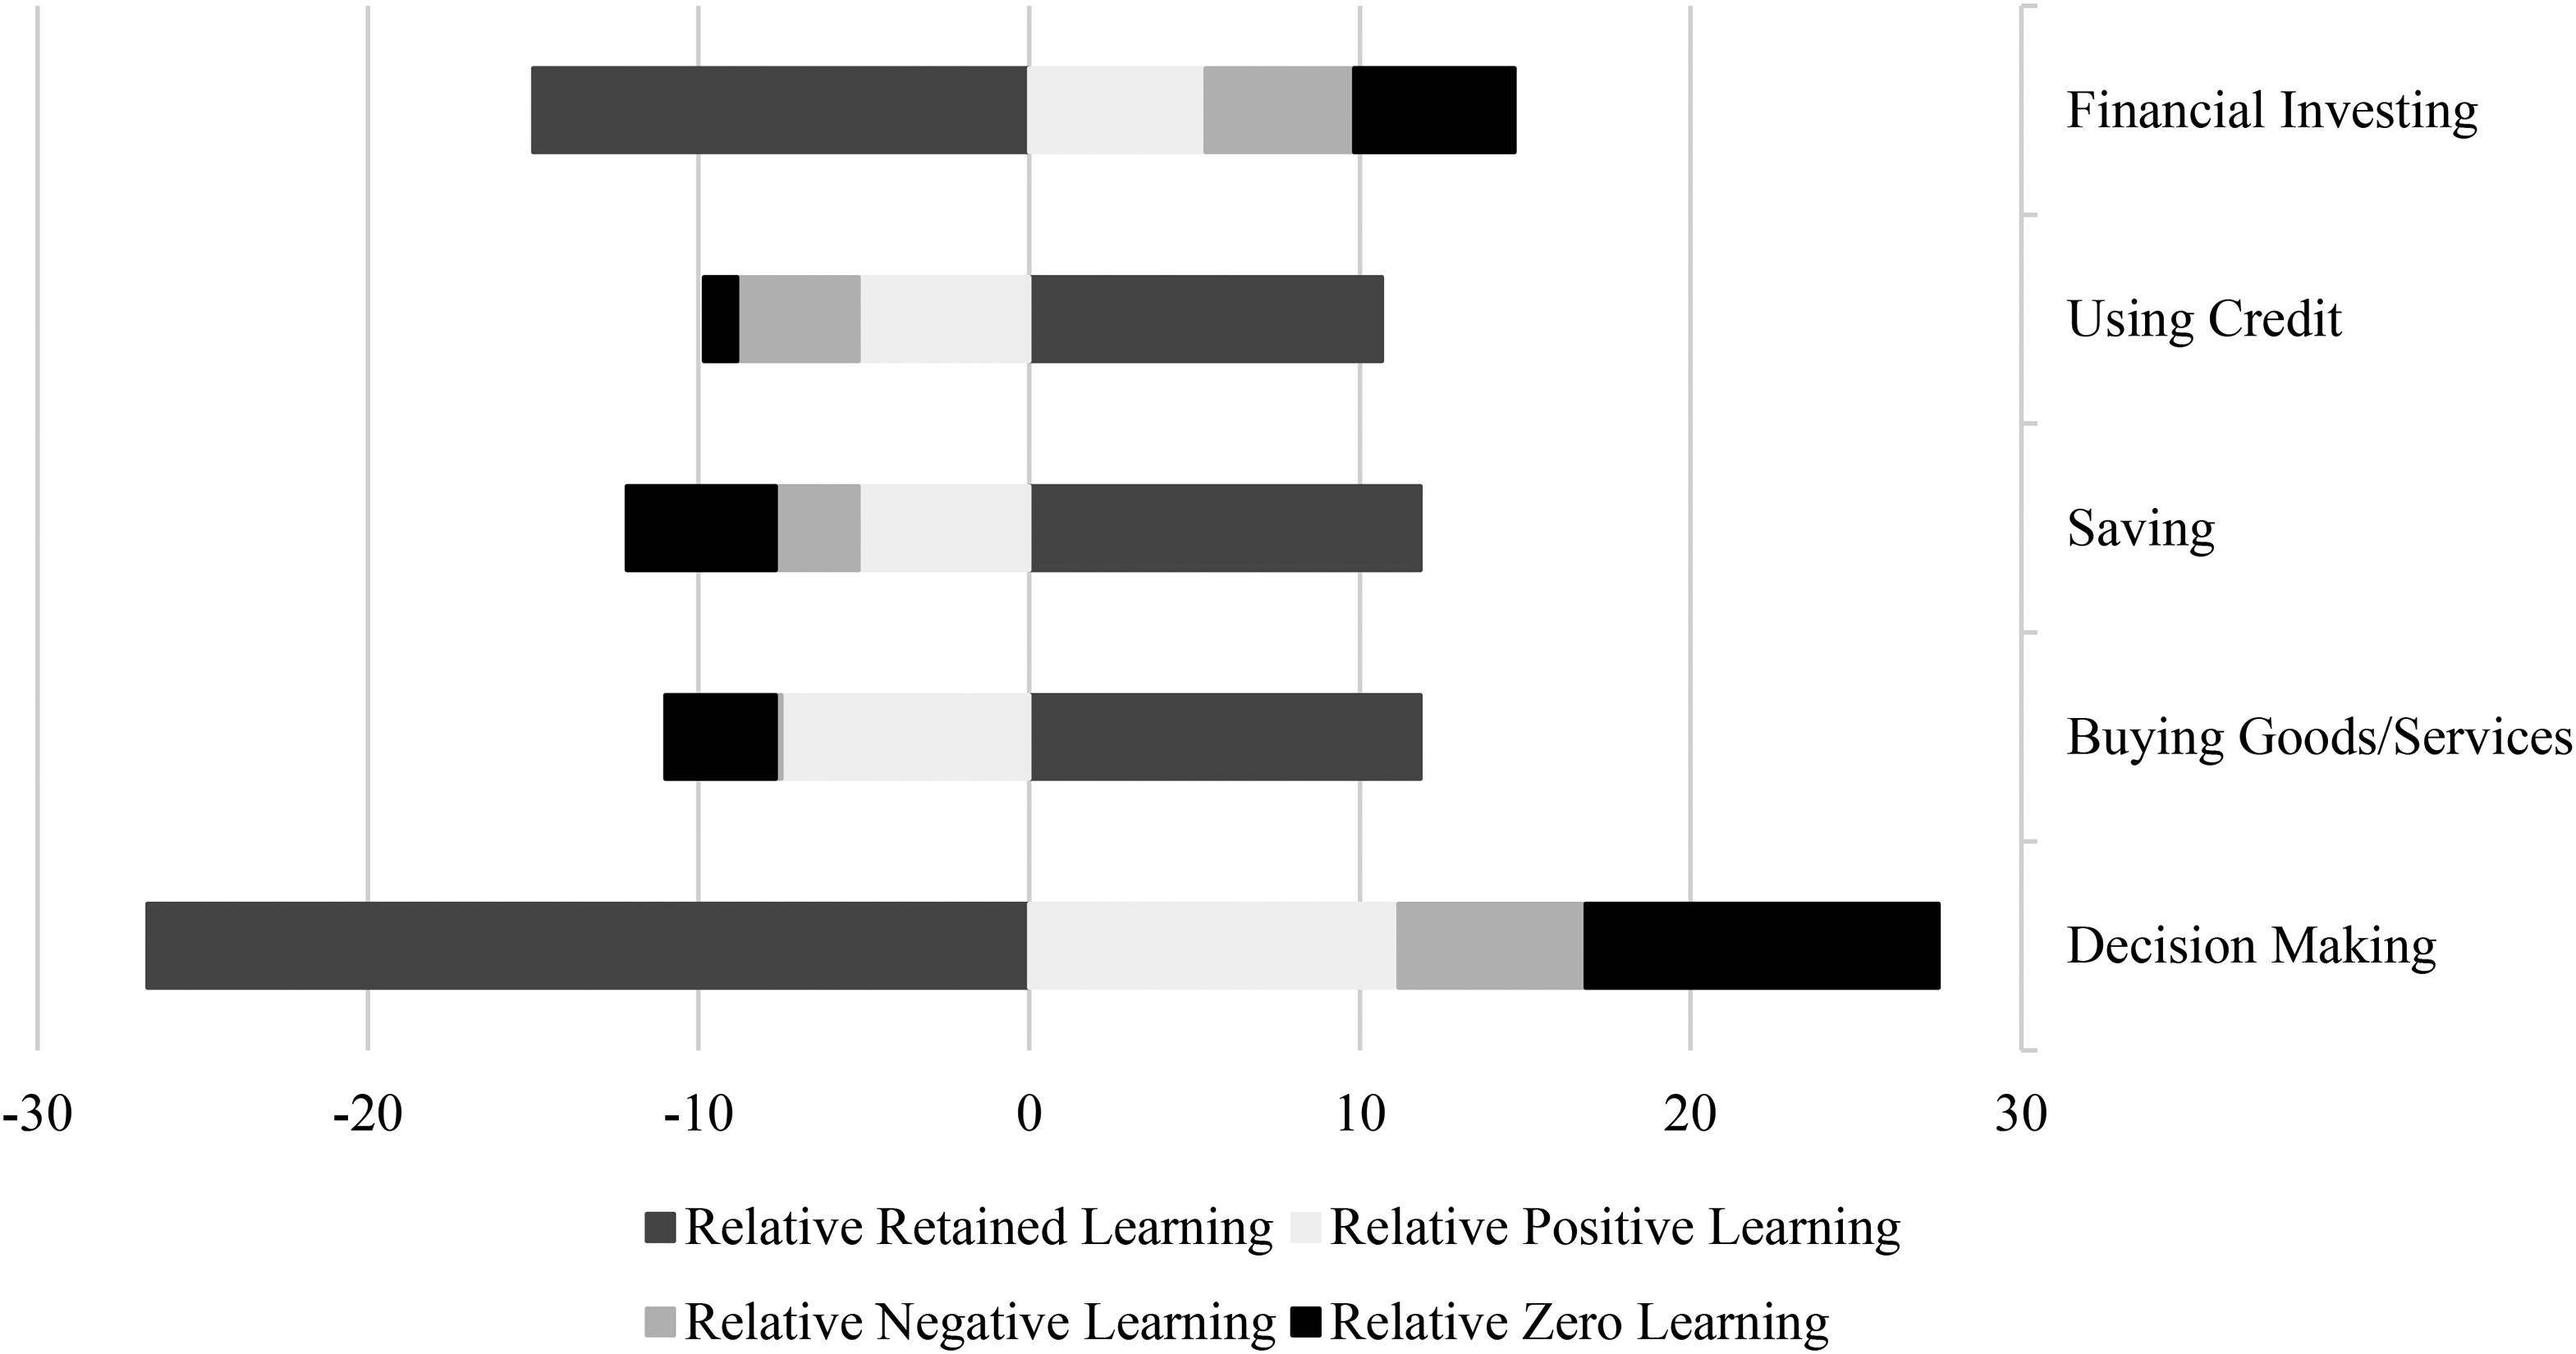
Teacher relative assessment gains and losses by standard and type of learning.
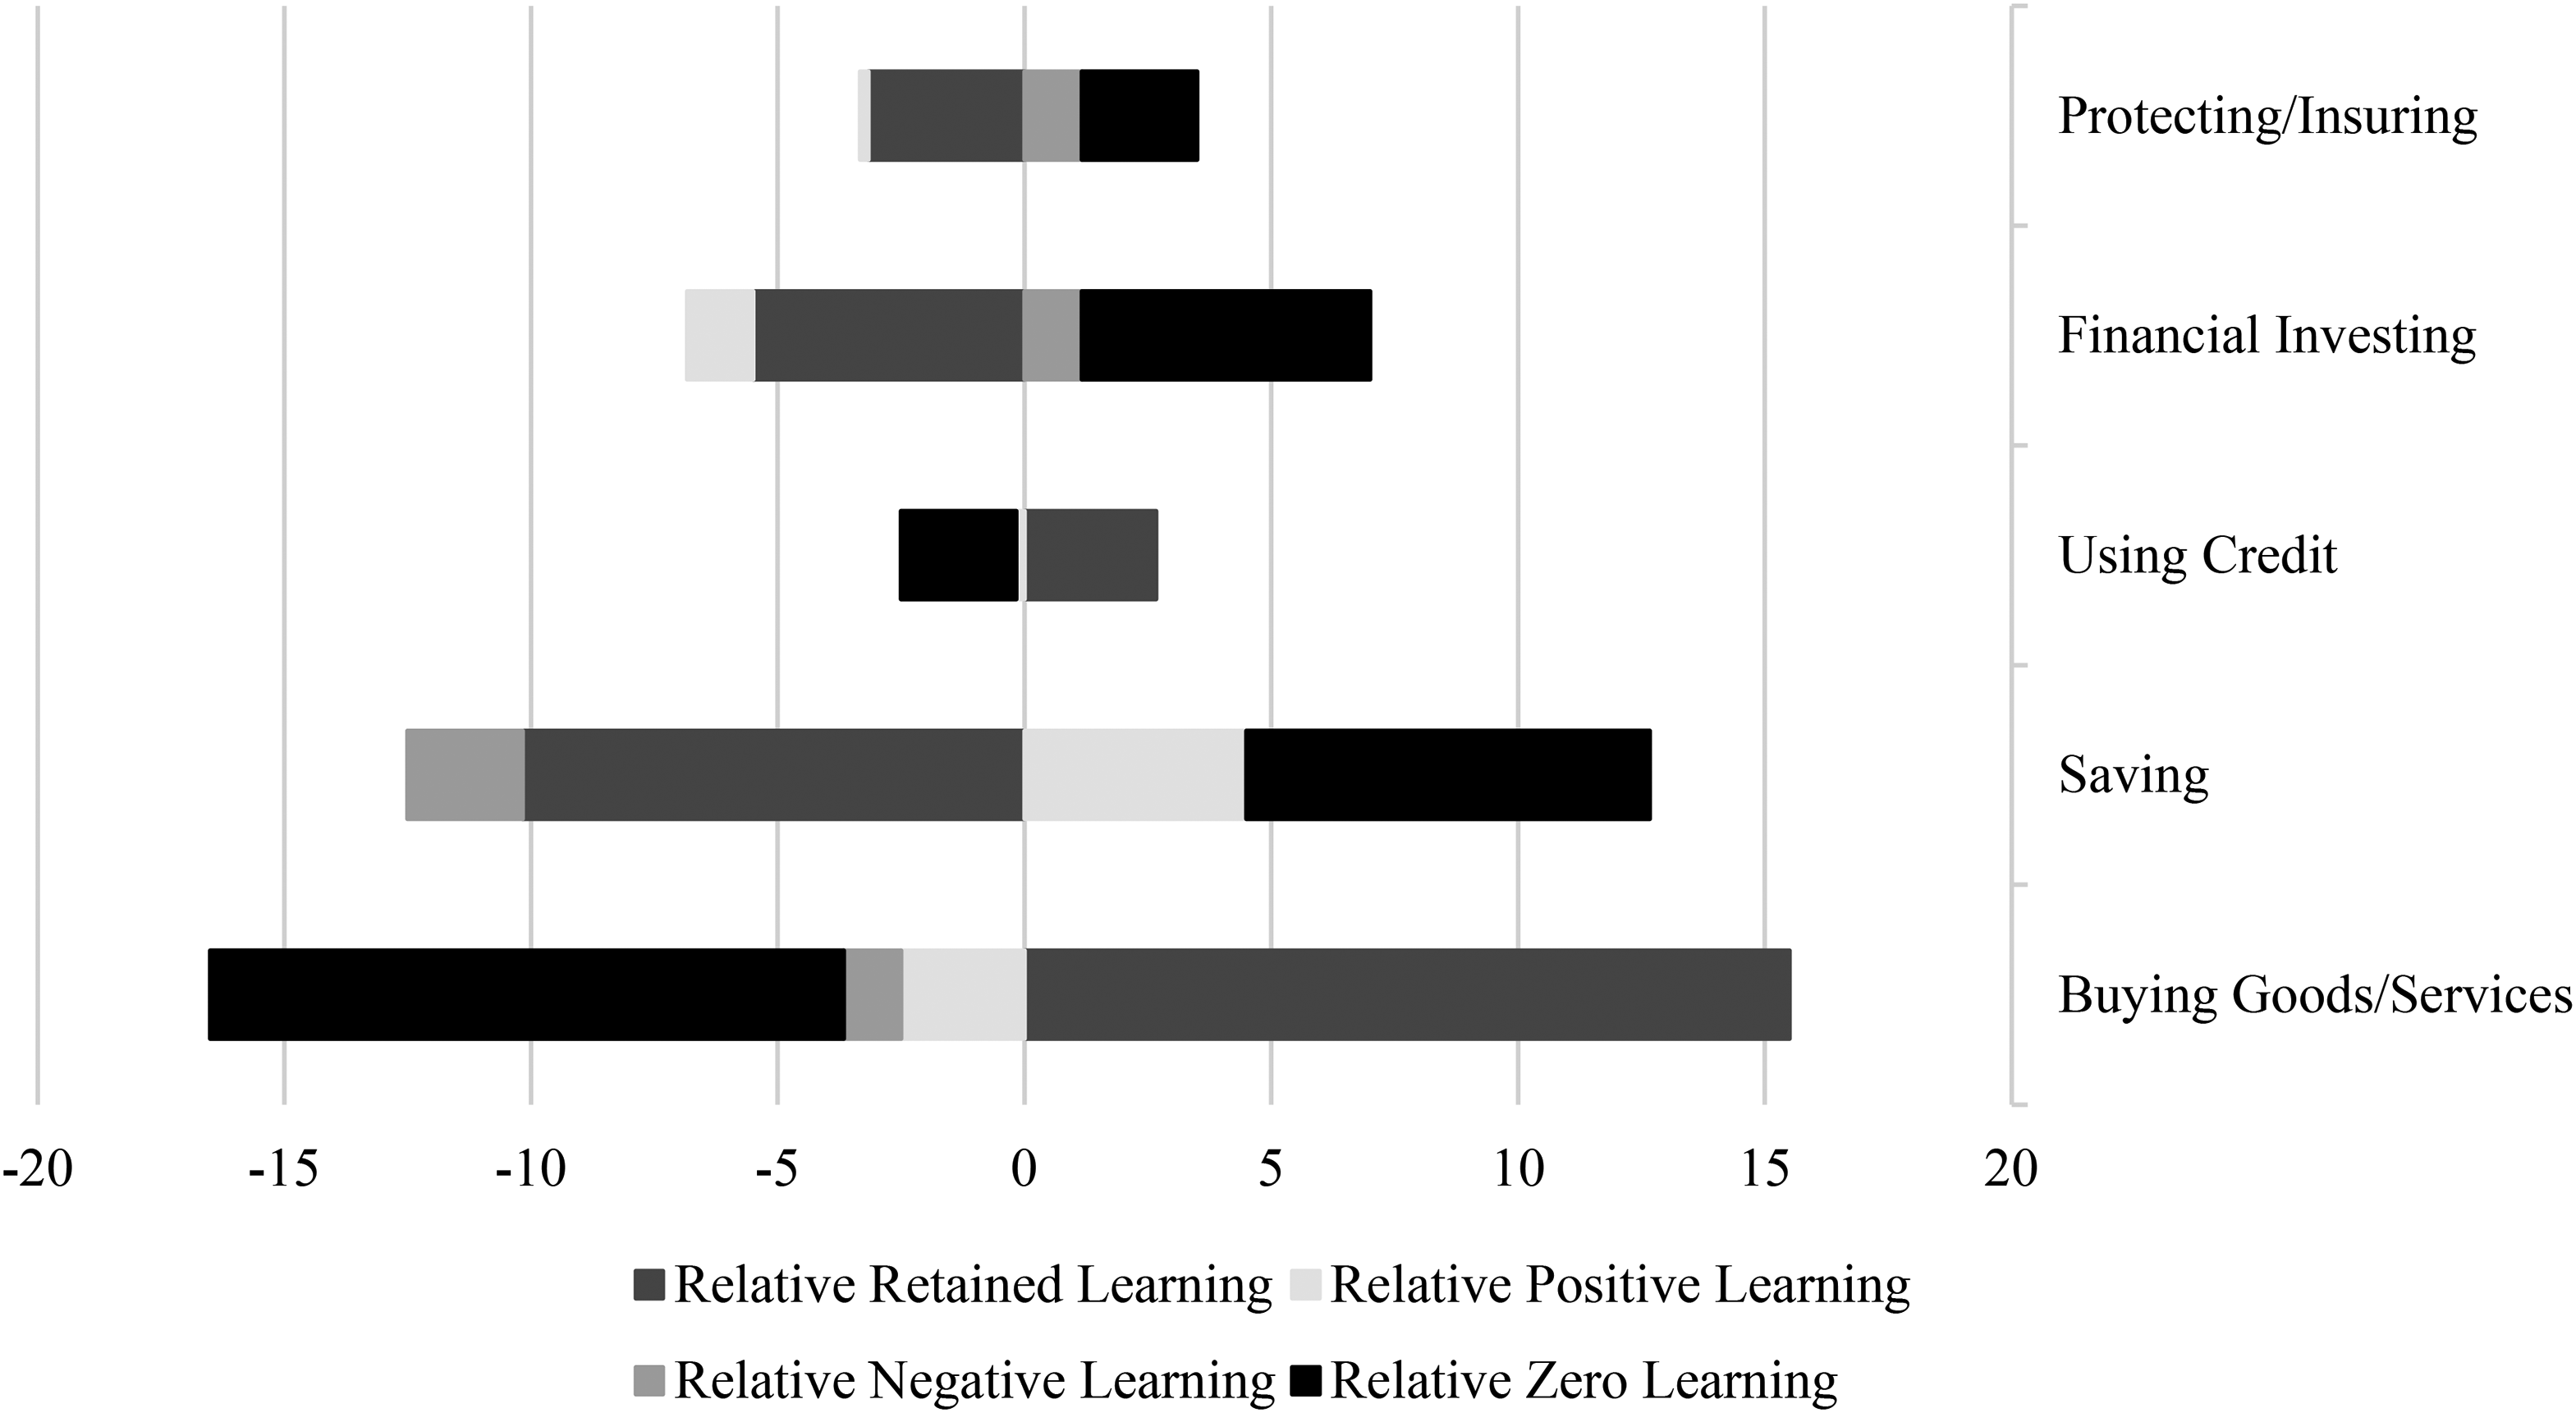
Student relative assessment gains and losses by standard and type of learning.
Full results from the hypothesis testing are available from the author, and those that are statistically significant are illustrated in Figures 4 and 5. Starting from zero in the middle of the figure, a positive difference shows a type of learning in that content area that was statistically significantly higher than the average of that type of learning in the other content areas. Likewise, a negative difference shows a type of learning in that content area that was statistically significantly lower than the average of that type of learning in the other content areas. Analyzing teacher results, Figure 4 shows that disaggregated results were similar for the standards that covered decision making and financial investing where teachers had statistically lower levels of RL and statistically higher levels of PL. Before training, teachers were less knowledgeable in these content areas than in others and did exhibit improvements from pretest to posttest, on average. There are also significantly higher levels of both NL and ZL in these same areas, which suggests that it might take longer than a 5-day training for teachers to learn the content well enough to avoid answering incorrectly on the posttest. More emphasis on these topics and more practice could lead to lower levels of each of these response patterns. Statistically significantly higher levels of RL in buying goods and services, saving, and using credit show that teachers are already knowledgeable in these areas, and the knowledge persists from the beginning to the end of the training.
Examining the types of learning that occurred by standard for students, Figure 5 shows that for buying goods and services and using credit, students had statistically significantly higher levels of RL as compared to the other content areas. They had higher average levels of knowledge in these areas before studying personal finance, and the knowledge persisted. For standard 4, which covers saving, students experienced a statistically higher level of PL, although there was a higher level of ZL, too. Student results for financial investing and protecting and insuring differ from the results for saving in that the PL is not statistically higher in either of these content areas. Students have a low average level of RL in financial investing and protecting and insuring and statistically significantly higher levels of NL and ZL in these areas. They are missing questions about these content areas on the posttest. These may be areas where there are preexisting misconceptions or where students lack practical experience that could lead to better understanding.
Comparing the teacher and student results in these figures, we can conclude that teachers were least knowledgeable about decision making before the training and did show some positive learning by the posttest. Teachers and students already knew a lot about buying goods and services and using credit, and, while teachers knew a lot about saving, students learned more in this content area. Teachers and students both exhibited low levels of knowledge about financial investing, which persisted. While there was no detectable change in learning for teachers in the area of protecting and insuring, students had statistically higher levels of NL and ZL in this content area, too.
Since teachers were not required to use all of the lessons in the MTPF curriculum and they could pick and choose lessons, it is possible that they taught more of the content with which they were knowledgeable and/or more comfortable. If this is the case, then the content areas where teacher knowledge performance is highest would coincide with the areas where the teachers used more of the lessons. In Figure 6, teacher and student average posttest scores are depicted for each content standard, and the average of the percentage of teachers who used each lesson related to that standard is included as a separate column. So, for Standard 1, teachers earned an average of 75% on posttest questions related to that standard, students earned an average of 48% on the same questions, and the average of the percentage of teachers who used each of the four lessons from the curriculum that were related to this decision making standard is 55%.
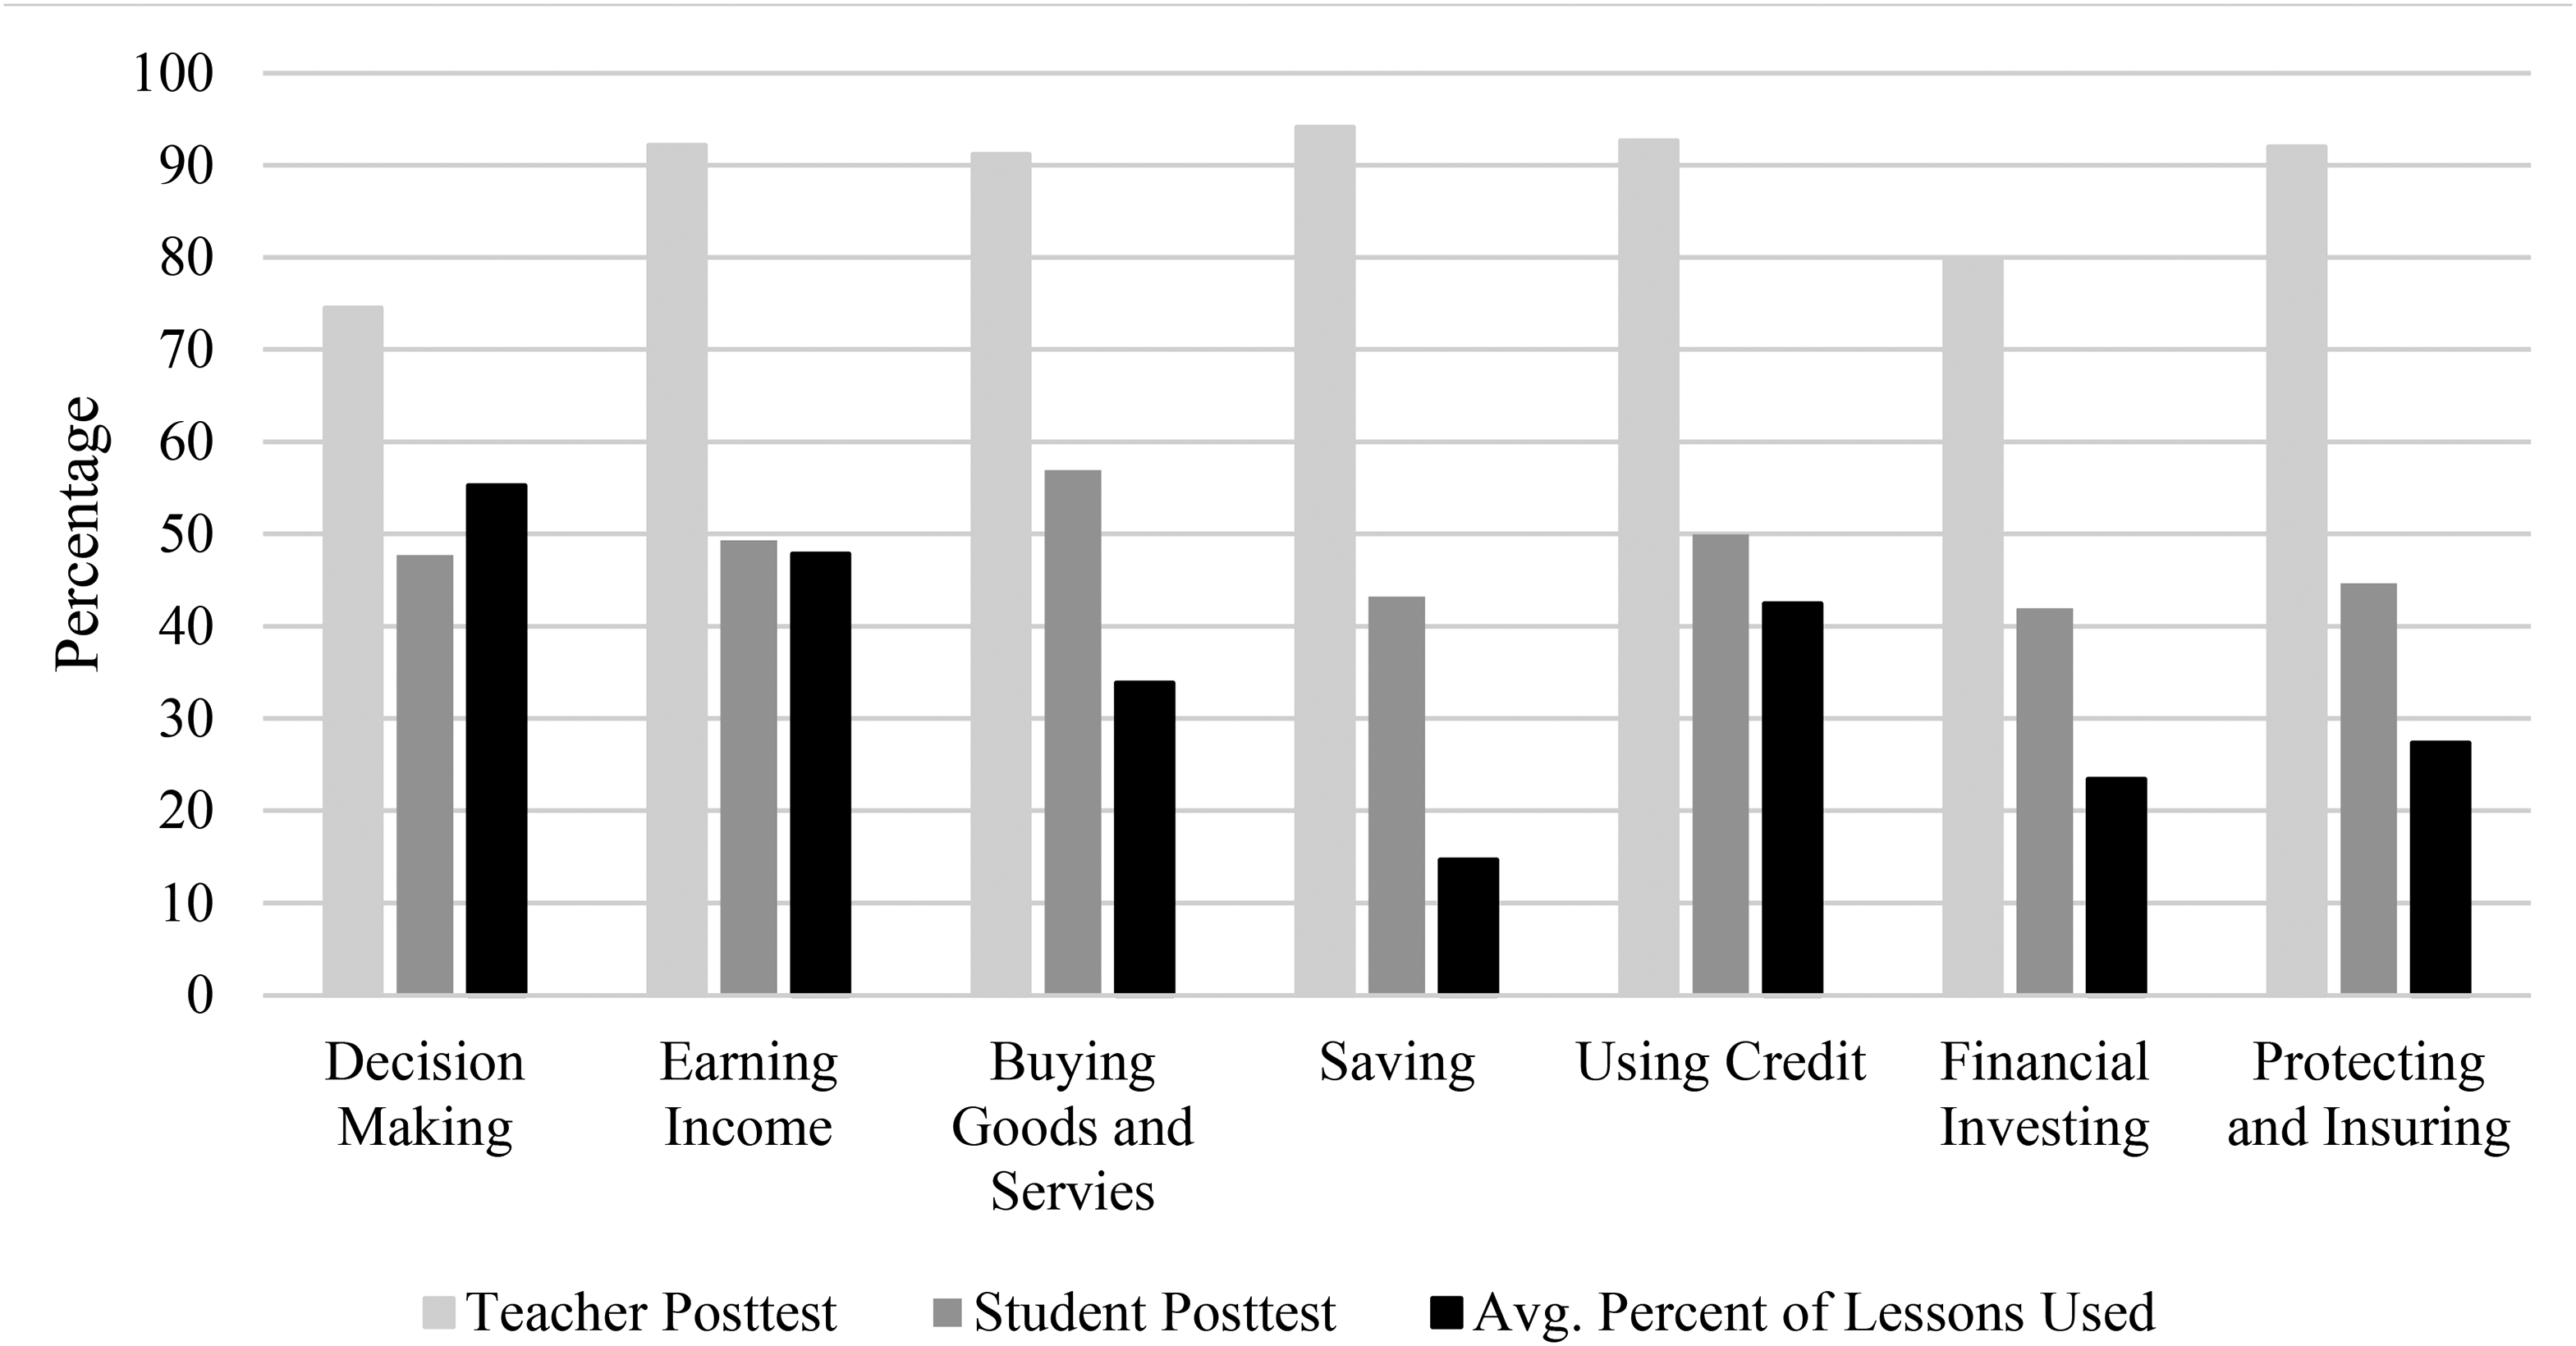
Teacher average posttest scores, student average posttest scores, and average percentage of teachers Who used lessons for each standard.
This figure shows, again, that the lowest posttest averages for teachers were on questions related to the decision making and financial investing standards. For students, again, the lowest posttest averages were on questions related to saving, financial investing, and protecting and insuring. Examining the usage of lessons for the different standards, the lowest average percentage of teachers who used the lessons, for each standard, occurs with saving, financial investing, and protecting and insuring. While this does not coincide with the content areas where teacher knowledge is lowest, these are the same areas where student scores are lowest. It is not possible to know why the teachers did not use more of the lessons in these particular content areas, but teachers do face tradeoffs in allocating scarce classroom time across the content standards. Perhaps they did not devote as much time to material such as bond markets, retirement planning, the time value of money, and other topics from these standards because they perceived them to be more complicated or time-consuming to teach and learn at the high-school level.
Conclusion
This study of the implementation of personal finance education in Mississippi is based on a curriculum and assessment that are each aligned with the National Standards for Financial Literacy. These standards offer a comprehensive guide to what high-school students should know to be financially literate. Disaggregated test results suggest that teacher knowledge, as measured by the TFL, might be increased by devoting more time in teacher training to the content areas of decision making and financial nvesting. Student knowledge, as measured by the same assessment, might be increased by devoting more instruction to the content areas of saving, financial investing, and protecting and insuring. This could require reallocating instructional effort from other areas where teachers and students are already knowledgeable, or it may require more instructional effort be spent on financial literacy, as a whole, to provide more coverage of these concepts.
The literature on effective financial education has shown positive outcomes when teachers are provided with a rigorous, well-organized plan that is accompanied by high-quality training and materials that are tied to standards. Teachers face many requirements and restrictions in their teaching, which can make it difficult to implement a required set of lessons. However, as states mandate financial education and adopt standards in this content area, they should consider including an implementation plan for teachers and a required assessment of students. The implementation plan should be based on the standards and include a pacing guide that provides a minimum requirement for how much time teachers should spend on the content related to each standard. Without these guidelines, the disaggregated test results from this study show that there are consequences. Namely, for this sample, the areas where teachers chose to teach fewer lessons coincide with the areas where student learning is lowest. If teachers initially lack knowledge or confidence in some of the areas, classroom instruction might be strengthened by using simulations or guest speakers. As teachers become more knowledgeable about the content by teaching it from year to year, student performance should also improve.
As is often the case with this type of study, the time frame measures only short-term results. Therefore, conclusions drawn from this project should be viewed with caution when generalizing beyond this period of time and location. However, this exploration into disaggregated assessment results does provide additional support for efforts to teach personal finance to secondary students and also points out a need for larger scale studies of the effectiveness of training. The results suggest that the MTPF program was successful at increasing knowledge for this sample of teachers and students. The gains in financial knowledge shown in this study are particularly compelling given that the state's population is disadvantaged as compared to the US, as a whole. In linking disaggregated assessment results for teachers and students, this study adds to the literature on effective financial education by identifying a need for more structure to guide content coverage in high-school classes. Specifically, implementation guides and required student assessments are examples of the types of resources that could be used to direct more coverage of those content standards where response patterns show NL or ZL for students. Future analyses with the data will examine response patterns of teachers and students among various demographic groups.
Footnotes
Acknowledgement
Thank you to two anonymous referees for helpful comments and suggestions. All views expressed are those of the author and not of the Federal Reserve Bank of St. Louis or the Federal Reserve System.
Author statement
All views expressed are those of the author and not of the Federal Reserve Bank of St. Louis or the Federal Reserve System.
Declaration of conflicting interests
The author declared no potential conflicts of interest with respect to the research, authorship, and/or publication of this article.
Funding
The author received no financial support for the research, authorship, and/or publication of this article.