
Abstract
Fluid challenge during right heart catheterization has been used for unmasking pulmonary hypertension (PH) related to left-sided heart disease. We evaluated the clinical and hemodynamic factors affecting the response to fluid challenge and investigated the role of fluid challenge in the classification and management of PH patients. We reviewed the charts of 67 patients who underwent fluid challenge with a baseline pulmonary arterial wedge pressure (PAWP) of ≤ 18 mmHg. A positive fluid challenge (PFC) was defined as an increase in PAWP to > 18 mmHg after 500 mL saline infusion. Clinical characteristics and echocardiographic and hemodynamic parameters were compared between PFC and negative fluid challenge (NFC). PFC was associated with female sex, increased BMI, and hypertension. A greater rise in PAWP was observed in PFC (6.8 ± 2.3 vs. 3.8 ± 2.7 mmHg, P = 0.001). A larger increase in PAWP correlated with a lower transpulmonary gradient (r = –0.42, P < 0.001), diastolic pulmonary gradient (r = –0.42, P < 0.001), and pulmonary vascular resistance (r = –0.38, P < 0.001). We found 100% of the patients with PFC were classified as WHO group 2 PH compared to 49% of the NFC patients (P < 0.001). Fewer patients with PFC were started on advanced PH therapies and more were discharged from PH clinic. A PFC and the magnitude of PAWP increase after saline loading are associated with parameters related to left heart disease. In our population, fluid challenge appeared to influence the classification of PH and whether patients are started on therapy or discharged from clinic.
Keywords
Introduction
Pulmonary hypertension (PH) can occur as a consequence of several conditions. 1 The most common form of PH is pulmonary hypertension associated with left heart disease (PH-LHD).2–4 PH-LHD arises from increased pulmonary venous pressures.5–7 Often, the increase in pulmonary arterial pressures is simply related to passive transmission of high pulmonary venous pressure (isolated post-capillary PH).8,9 However, in some cases pulmonary arterial remodeling can develop from venous congestion, resulting in a pre-capillary component to the PH.9–13
Differentiating pre-capillary and post-capillary PH relies on pulmonary arterial wedge pressure (PAWP). A mean pulmonary arterial pressure (mPAP) of ≥ 25 mmHg with PAWP >15 mmHg is required for diagnosis of PH-LHD.2,14 However, a normal PAWP does not exclude PH-LHD as a PAWP <15 mmHg can be seen in resting or volume deplete states. The current medical therapies approved for pulmonary arterial hypertension (PAH) can be ineffective or potentially have adverse effects when administered to patients with left-sided heart disease or valvular heart disease.15–17 Therefore, there has been an interest in using fluid loading with saline to unmask occult post-capillary PH.18–21
There has been a lack of consensus on the role of fluid challenge in identifying PH-LHD. 22 There is still uncertainty about the volume of infusate or the cut-off PAWP value for a pathological response.19,23 In addition, the diagnostic relevance and impact of fluid challenge on clinical decision-making remains unknown. In this retrospective study, hemodynamic responses to fluid challenge in a cohort of patients referred for right heart catheterization (RHC) were examined. Finally, we evaluated the influence of fluid challenge on the classification and management of a real-world PH population.
Methods
Study population
This was a retrospective, single-center study approved by clinical research ethics board at the University of British Columbia. Clinic charts of patients referred to our PH clinic from 1 July 2013 to 30 April 2017 were reviewed. Vancouver General Hospital Pulmonary Hypertension clinic is the sole PH referral center for the province of British Columbia in Canada with a large referral base of 4 million. All the RHCs for our patients were performed by a single operator (NB). All the patients who underwent fluid challenge during RHC between the study period and had a PAWP ≤15 mmHg at baseline were included in this study. The diagnosis of PH required a mPAP ≥25 mmHg. There were 92 patients referred for evaluation of PH who underwent fluid challenge of whom 67 patients met our inclusion criteria. The decision to perform fluid challenge was left at the discretion of operator (NB) or the referring physicians and was mostly performed in patients with risk factors for left heart disease but normal resting hemodynamics. All patients received 500 mL of normal saline over 5 min. A positive fluid challenge (PFC) was defined as an increase in PAWP to >18 mmHg with saline infusion while in negative fluid challenge (NFC) PAWP remained ≤18 mmHg. Those patients who underwent fluid challenge but had a PAWP >15 mmHg at baseline were excluded. In cases in which left heart catheterization was concurrently performed with RHC, we also excluded the patients with discordant PAWP and left ventricular end-diastolic pressure (i.e. PAWP of ≤15 mmHg and LVEDP of >15 mmHg).
Patient characteristics, echocardiography, and hemodynamics
Co-morbidities were assessed through a structured chart review. Obesity was defined as a body mass index (BMI) of ≥30 kg/m2 based on the National Institute of Health guidelines. 24 Arrhythmia was described as any history of sustained arrhythmia. In the vast majority of our patients, this was atrial fibrillation or flutter with similar distribution between the PFC and NFC cohorts (Table S1 Supplementary Appendix).
All patients had a two-dimensional transthoracic echocardiogram within a year of RHC. Right ventricular (RV) function was qualitatively assessed as either normal, mildly, moderately, or severely dysfunctional by the interpreting echocardiographer. All the other parameters were measured according to the American Society of Echocardiography guidelines.25,26
During RHC, the zero line was set at the mid-thoracic height. All measurements were obtained from hemodynamic tracing at end-diastole and at end-expiration. Only four of the patients (three in the NFC and one in the PFC) were in an atrial fibrillation rhythm at the time of RHC. In patients with atrial fibrillation, all pressures were carefully measured as averages over 3–5 RR intervals depending on the heart rate, to ensure accuracy of the recordings. Cardiac output (CO) was measured via the thermodilution method. There were no patients with significant unrepaired intracardiac shunts in our analysis. The transpulmonary gradient (TPG), diastolic pulmonary gradient (DPG), and pulmonary vascular resistance (PVR) were calculated in the standard manner, as previously described. 27 The left ventricular end-diastolic transmural pressure (LVTMP) was calculated as PAWP – RAP. 28
We also examined the relationship between change in PAWP for patients with lower baseline DPG, TPG, and PVR compared to higher values. Low DPG, TPG, and PVR were defined as a DPG < 7 mmHg, TPG < 12 mmHg, and PVR ≤3 Wood units, respectively. These thresholds were chosen based on values commonly chosen in the literature.1,9,29 Patients were seen in follow-up after fluid challenge by one of the three experienced PH specialists (NB, JS, RL). The physicians’ World Health Organization (WHO) PH classification, assessment, and management plan was determined from the chart notes from the visit immediately following the RHC with fluid challenge.
Statistical analysis
All data were analyzed with IBM SPSS statistical software package. Continuous variables were measured as means ± standard deviations and categorical variables were measured as percentages. The PFC and NFC groups were compared with the independent two-sample t-test or non-parametric Mann–Whitney–Wilcoxon test when normal distribution was not achieved. Using linear regression, we investigated the association between the change in PAWP with fluid and DPG, TPG, and PVR. The Pearson correlation coefficient (r) was calculated to assess the strength of association. For all comparisons, statistical significance was determined as a P value of < 0.05.
Results
Baseline demographic, echocardiographic, and hemodynamic data.
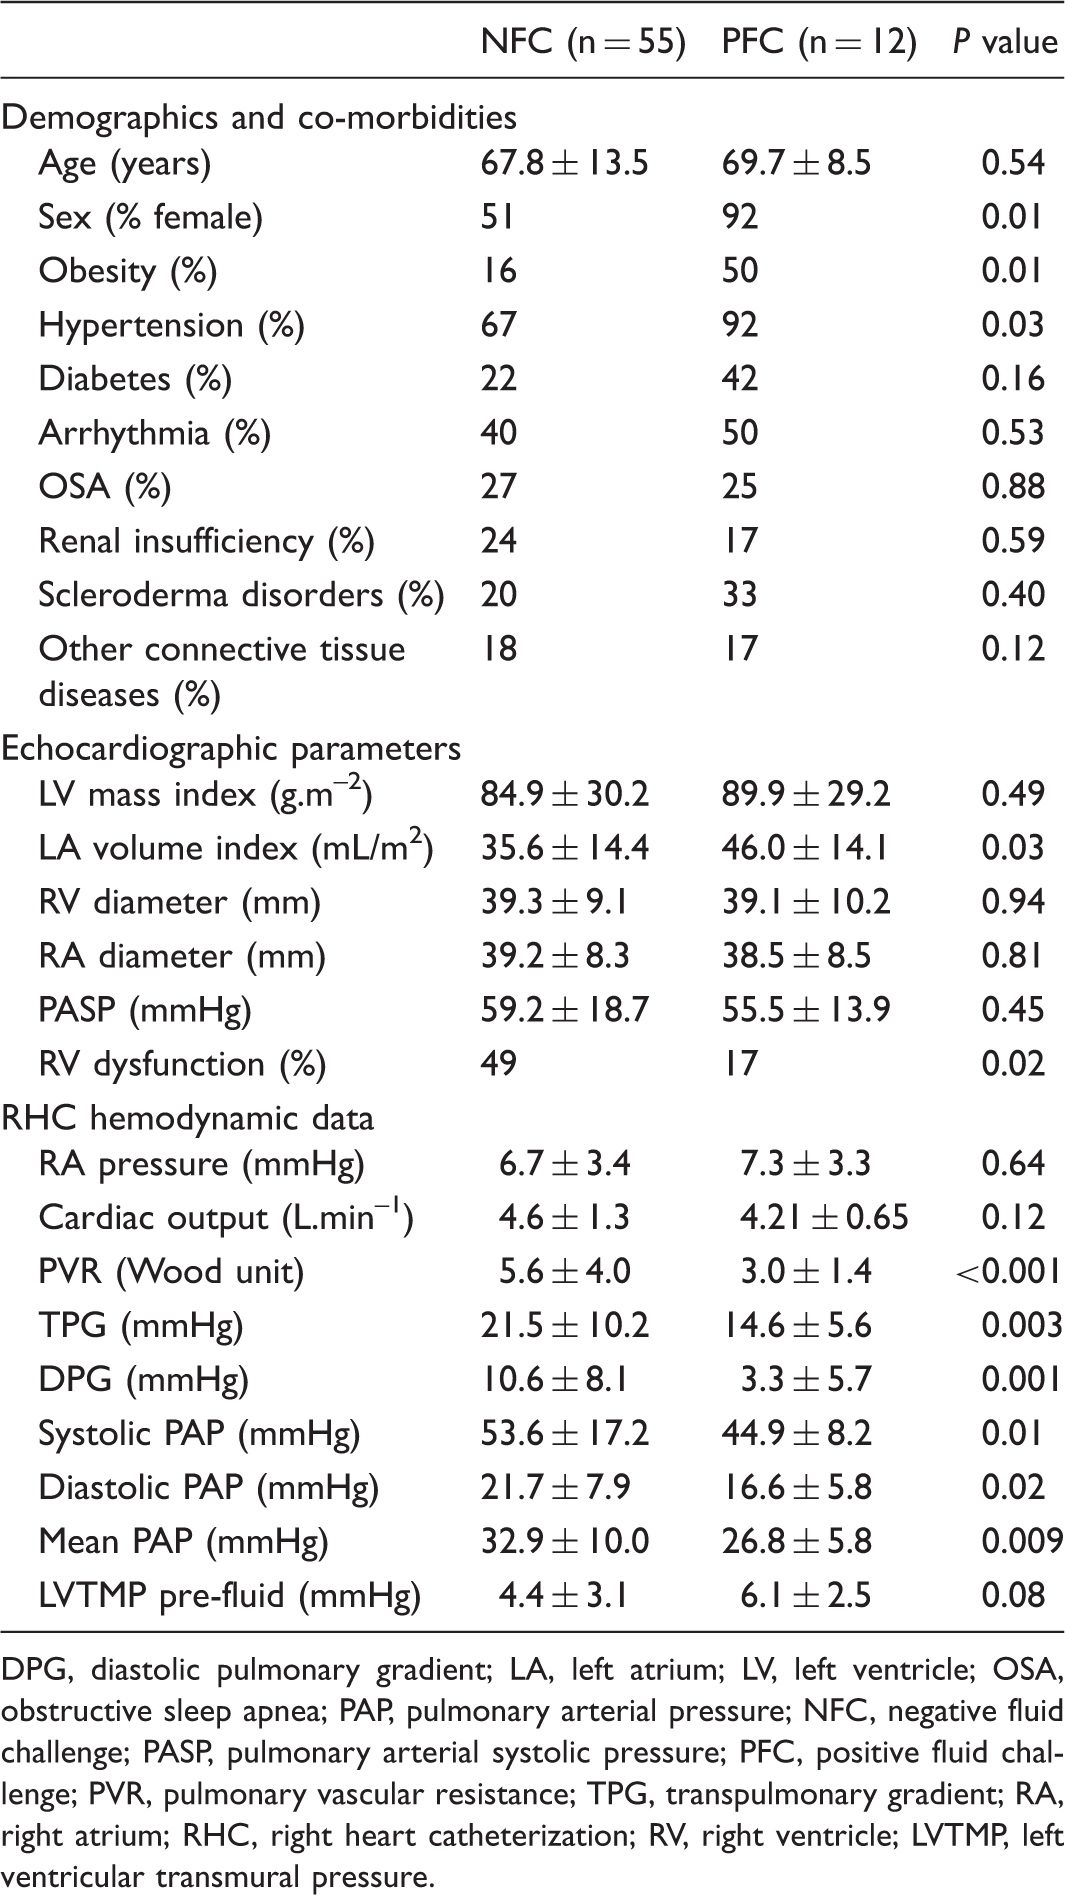
DPG, diastolic pulmonary gradient; LA, left atrium; LV, left ventricle; OSA, obstructive sleep apnea; PAP, pulmonary arterial pressure; NFC, negative fluid challenge; PASP, pulmonary arterial systolic pressure; PFC, positive fluid challenge; PVR, pulmonary vascular resistance; TPG, transpulmonary gradient; RA, right atrium; RHC, right heart catheterization; RV, right ventricle; LVTMP, left ventricular transmural pressure.
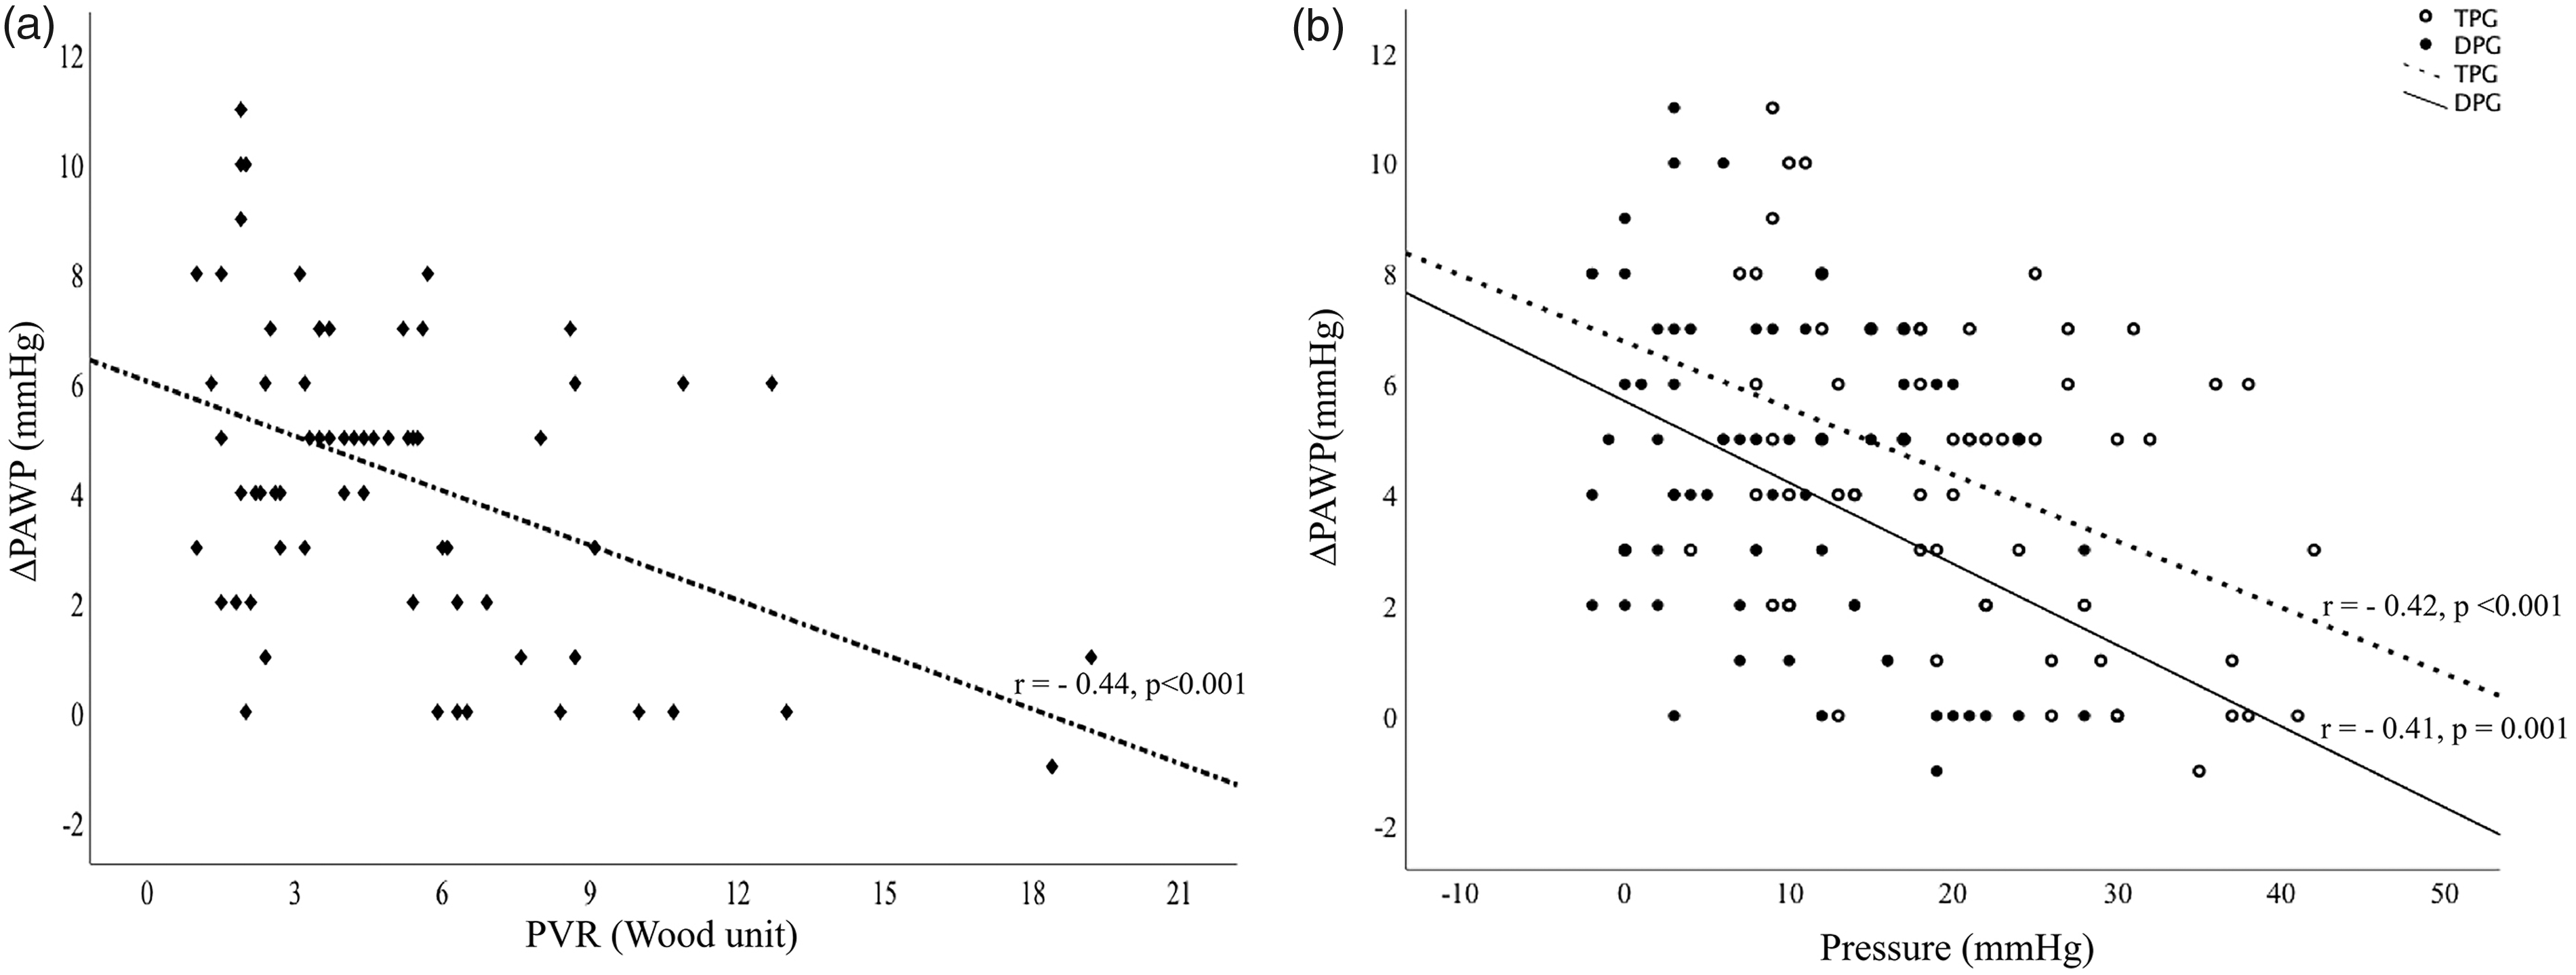
Hemodynamic data obtained during RHC are also summarized in Table 1. Although there was no difference in pulmonary artery systolic pressure (PASP) on echocardiography, pulmonary arterial pressures measured during RHC were significantly lower in the PFC patients compared to NFC. PAWP was higher in PFC both at baseline (13.3 ± 1.8 vs. 11.1 ± 2.5, P < 0.001) and after fluid challenge (20.2 ± 0.7 vs. 14.9 ± 2.8, P < 0.001). As expected, PFC was associated with a significantly greater increase in PAWP after fluid challenge compared to NFC (6.8 ± 2.3 vs. 3.8 ± 2.7, P value = 0.001) (Fig. 1a). This was independent of the starting PAWP value. As shown in Fig. 2, there was a moderate but statistically significant inverse correlation between change in PAWP with saline infusion and baseline DPG, TPG, and PVR. This indicates that parameters related to pre-capillary PH are associated with lesser increases in PAWP with fluid challenge. Similarly, larger increases in PAWP were related to parameters associated with isolated post-capillary PH (IpcPH), such as DPG < 7 mmHg (Fig. 1b). Of 41 patients with apparent PAH at baseline (i.e. mPAP ≥25 mmHg, PAWP < 15 mmHg, and PVR >3 Wood units), 18 (44%) patients met hemodynamic criteria for combined pre- and post-capillary PH (CpcPH) after fluid challenge (Figure S2 Supplementary Appendix).
Change (Δ) in PAWP after 500 mL of saline infusion (a) in patients with PFC and NFC and (b) in patients with DPG ≥ 7 mmHg and DPG < 7 mmHg. There was a greater increase in PAWP after fluid challenge in PFC compared to NFC and in patients with normal DPG (i.e. < 7 mmHg) compared to DPG ≥ 7 mmHg. mΔPAWP = mean (PAWPpost-fluid – PAWPpre-fluid). CI, confidence interval. Relationship between (a) ΔPAWP* and PVR and (b) ΔPAWP and TPG (empty circles) and DPG (bold circles). A line of best fit was drawn as a linear correlation between ΔPAWP and DPG (solid line), TPG (dashed line), and PVR. Pearson correlation coefficient (r) revealed a moderate inverse relationship between ΔPAWP and both TPG/DPG and PVR. *ΔPAWP = (PAWPpost-fluid – PAWPpre-fluid).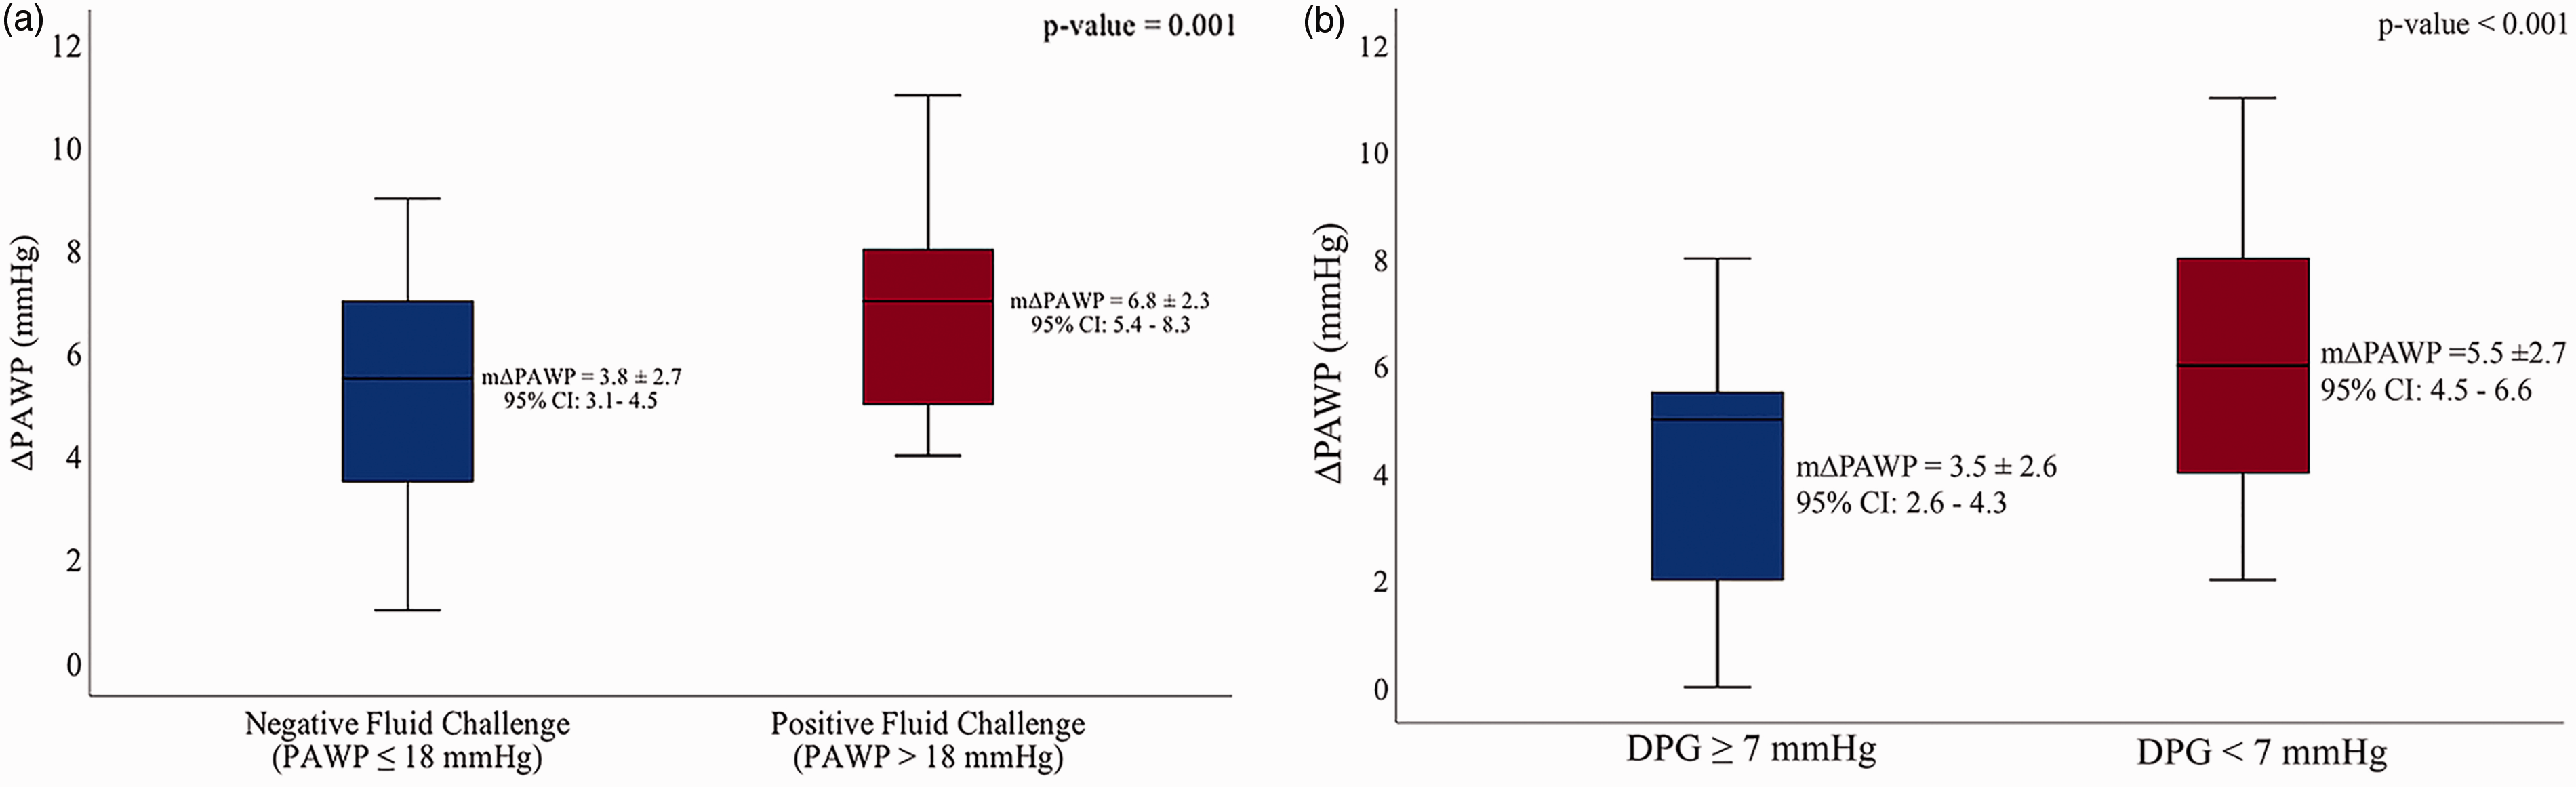
Physicians’ classification and management of patients after fluid challenge.
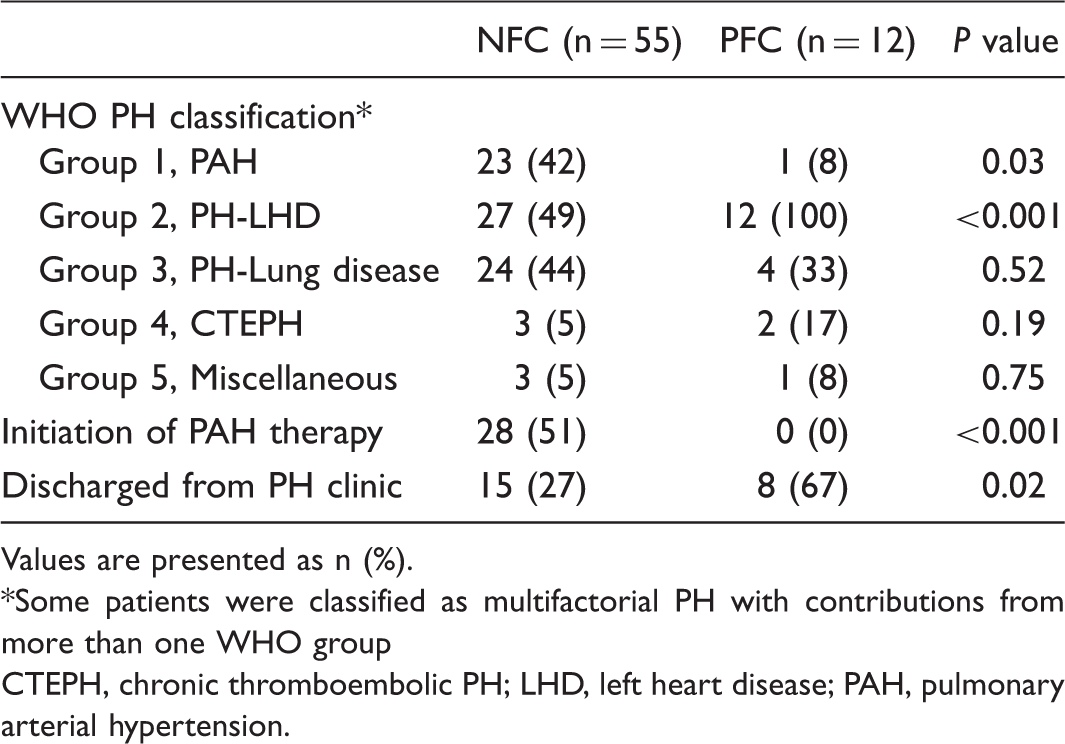
Values are presented as n (%).
Some patients were classified as multifactorial PH with contributions from more than one WHO group
CTEPH, chronic thromboembolic PH; LHD, left heart disease; PAH, pulmonary arterial hypertension.
In a sensitivity analysis, we used a threshold of 15 mmHg for PFC, as this was the threshold used in some previous studies. The results did not change appreciably and are presented in the Supplementary Appendix.
Discussion
In our population of patients being evaluated for PH, patients with a PFC had a higher prevalence of several demographic, echocardiographic, and hemodynamic features associated with left heart disease. This is similar to the findings of previous studies that investigated the clinical characteristics of patients with PH-LHD.30–32 However, certain key variables related to diastolic dysfunction, such as diabetes and age, did not correlate with PFC. Such discrepancies have also been observed in other studies and are thought to be due to the small number of patients who underwent fluid challenge.18,20 The observed distinct sex distribution in the hemodynamic response to saline loading could be due to the sex-related differences in left ventricular diastolic indices. 33 The higher prevalence of heart failure with preserved ejection fraction (HFpEF) and more pronounced impairment in left ventricular relaxation in women suggest that fluid challenge might be higher yield in women.33–35 As expected, PFC was associated with structural changes in the left heart including left atrial dilatation. We did not note any difference in RA and RV size; this may have been on the basis of low sample size or mixed pre-capillary and post-capillary phenotype in the PFC group. However, we also found that RV dysfunction was less common in PFC. It is not entirely clear whether the presence of RV dysfunction attenuates the increase in preload to the left heart associated with a fluid bolus or whether patients in the NFC group had an enriched population of advanced pre-capillary PH with RV dysfunction. The latter hypothesis would be supported by the higher pulmonary pressures noted during RHC in the NFC group. Based on our findings, however, systolic pulmonary artery pressure (sPAP) measurement by echocardiography might be less useful in predicting response to saline loading as there might be possible sources of pressure underestimation particularly in patients with RV dysfunction. 36
Currently, post-capillary PH is further classified into IpcPH with a normal DPG and PVR, and CpcPH with a DPG ≥7 mmHg or PVR >3 Wood units.1,2,37 In the past, the TPG was also used as a discriminatory variable. 38 The association we found between low DPG, TPG, PVR, and response to saline loading demonstrates that a PFC is more likely when hemodynamic measures of pre-capillary PH are less elevated. Additionally, we observed that the magnitude of the increase in PAWP had an inverse correlation with baseline DPG, TPG, and PVR. This finding suggests that the change in PAWP may provide added discriminatory power over and above the final PAWP achieved post fluid challenge. Further research is required to determine whether the magnitude of the change in PAWP with saline loading should be incorporated into the definition of a PFC.
On the basis of hemodynamics alone, for a threshold of 15 mmHg and 18 mmHg for PFC, approximately 1/2 and 1/6 of our study patients meeting the hemodynamic criteria for PAH at baseline would be reclassified as CpcPH after fluid challenge, respectively. This suggests substantial implications to diagnosis and therapy. We found evidence for this in the specialists’ classification and approaches to therapy and follow-up. Patients with PFC were more commonly diagnosed with PH-LHD. We found that fewer patients with PFC were started on PAH therapies and were more likely to be discharged from clinic. These observations should however be taken with caution as this was a retrospective analysis and there were likely additional factors influencing the physicians’ clinical diagnosis and management. It should also be noted that the presence of elevated PA pressures, low wedge pressure, and elevated PVR does not necessarily secure a diagnosis of PAH. 39 While hemodynamics are an essential component of PAH diagnosis, they are not absolute. Many of the patients in our study who underwent saline loading had phenotypic risk factors for LHD despite normal PAWP at baseline, and a NFC does not necessarily imply a classification of PAH or initiation of pulmonary vasodilator therapy. Furthermore, some of the patients in our study where classified as having WHO group 3 or group 4 PH. The role of fluid challenge in these populations is not well established.
It should be noted that at present there is a lack of consensus on how a fluid challenge is best performed and interpreted. In this study, we chose 18 mmHg as our PAWP threshold for defining a hemodynamically significant fluid challenge. A lower threshold of 15 mmHg was used in earlier studies with fluid challenge.18,20 However, increases in filling pressures to >15 mmHg have been shown in healthy individuals with 1–2 L of saline infusion, 19 and similarly might be seen after 500 mL of volume loading in some individuals without left heart disease. 23 Consequently, an upper limit of 18 mmHg has recently been proposed. 21 When we used the traditional cut-off value of 15 mmHg for PAWP, 57% of patients were classified as having PFC, but the baseline clinical associations and hemodynamic responses to saline loading remained largely unchanged. Additionally, the use of a weight-based volume of infusion rather than a fixed 500-mL load has been suggested.19,22 There has been recent evidence emerging on the potential prognostic relevance of fluid challenge which further calls for additional standardization in fluid-loading protocols. 40
Limitations
We acknowledge that our study has several limitations. First, this was a retrospective, single-center review with a limited sample size. The small sample size could explain the fact that we did not find significantly higher prevalence of some of the established risk factors for left-sided heart disease. Second, the decision to perform a fluid challenge was left to the discretion of the referring PH specialist or the PH specialist performing the RHC. Thus, there may have been a selection bias and fluid challenge might have been performed more commonly in patients with risk factors for LHD. Third, a PAWP cut-off for a pathologic response to saline loading is not yet well standardized. To account for this, we analyzed our data at PAWP threshold of 18 mmHg and 15 mmHg and found similar results. Finally, our specialists’ classification and management of PH patients undergoing fluid challenge are unlikely to be purely ascribable to the hemodynamic responses to saline loading. Nonetheless, the specialists in our center were all unanimous in the diagnosis of PH-LHD and decision against starting PAH therapy when PAWP rose above 18 mmHg with fluid challenge, highlighting a consistent diagnostic approach. However, further prospective analysis on the utility of fluid challenge and the effect it has on physicians’ clinical decision making is required.
Conclusion
A PFC was associated with many clinical, echocardiographic, and hemodynamic factors related to left-sided heart disease. However, not all risk factors correlated. Extent of change in PAWP may be useful in the interpretation of the fluid challenge results. In our population, fluid challenge results were associated with measurable changes in classification of PH and whether patients are started on therapy or discharged from clinic. However, further work is needed before implementing updated guidelines around the role of saline loading in routine hemodynamic assessment of PH.
Footnotes
Conflict of interest
The author(s) declare that there is no conflict of interest.
Funding
This research did not receive any specific grant from funding agencies in the public, commercial, or not-for-profit sectors.