
Abstract
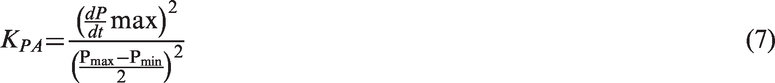
We hypothesized that KPA, a harmonic oscillator kinematics-derived spring constant parameter of the pulmonary artery pressure (PAP) profile, reflects PA compliance in pediatric patients. In this prospective study of 33 children (age range = 0.5–20 years) with various cardiac diseases, we assessed the novel parameter designated as KPA calculated using the pressure phase plane and the equation KPA = (dP/dt_max)2/([Pmax – Pmin])/2)2, where dP/dt_max is the peak derivative of PAP, and Pmax – Pmin is the difference between the minimum and maximum PAP. PA compliance was also calculated using two conventional methods: systolic PA compliance (sPAC) was expressed as the stroke volume/Pmax – Pmin; and diastolic PA compliance (dPAC) was determined according to a two-element Windkessel model of PA diastolic pressure decay. In addition, data were recorded during abdominal compression to determine the influence of preload on KPA. A significant correlation was observed between KPA and sPAC (r = 0.52, P = 0.0018), but not dPAC. Significant correlations were also seen with the time constant (τ) of diastolic PAP (r = −0.51, P = 0.0026) and the pulmonary vascular resistance index (r = −0.39, P = 0.0242). No significant difference in KPA was seen between before and after abdominal compression. KPA had a higher intraclass correlation coefficient than other compliance and resistance parameters for both intra-observer and inter-observer variability (0.998 and 0.997, respectively). These results suggest that KPA can provide insight into the underlying mechanisms and facilitate the quantification of PA compliance.
Lower pulmonary arterial (PA) compliance has recently been shown to be strongly associated with worse survival in patients with various cardiac diseases, including pulmonary arterial hypertension (PAH), 1 congenital heart disease, 2 and left ventricular dysfunction.3,4 Consequently, accurate determination and serial follow-up of PA compliance are important in the management of patients with heart failure. However, despite its potential importance for right ventricular (RV) performance and clinical outcomes, PA compliance is not routinely measured because precise and reproducible quantitative assessment remains challenging. Vascular compliance is traditionally expressed as the change in volume per unit change in pressure (dV/dP).1–4 Since the accurate measurement of PA volume change and RV ejection volume are quite difficult, the reproducibility regarding the assessment of PA compliance would be low.
Although the clinical utility of cardiac catheterization is well established, the analysis of hemodynamic data in the pressure phase plane (PPP), a plot of the time derivative of pressure (dP/dt) versus time-varying pressure (P(t)), has been limited to selected clinical research themes. PPP-derived vascular compliance analog parameters were first reported by Chung et al. 5 In this work, they utilized the known relation between the model stiffness (inverse of compliance) and the geometric attributes of the loops generated by the motion of the harmonic oscillator in the kinematic phase plane and applied them to the similarly shaped loops observed in the PPP generated by physiological aortic pressure data. This kinematic approach was used to derive and validate the determination of aortic stiffness. 5 However, no studies have investigated the feasibility of the PPP-derived vascular compliance analog for applying the PA compliance measurement.
Therefore, the aim of this clinical investigation was to determine the feasibility of the novel PPP-derived parameter analog for assessing PA compliance.
Methods
Study population
The participants in this prospective study were 33 consecutive pediatric patients (mean age ± standard deviation [SD] = 3.8 ± 5.1 years, age range = 0.5–20 years) who were suspected to have pulmonary hypertension (PH) before a cardiac catheterization examination. To test the generality of the PPP-derived parameter, the participants were chosen to be clinically heterogeneous. All patients had been scheduled for evaluations of their circulatory condition. The patients could be categorized as follows: idiopathic PAH (n = 5), preoperative atrial septal defect (n = 5), preoperative ventricular septal defect (VSD) (n = 11), postoperative VSD (n = 10), and postoperative complete atrioventricular septal defect (n = 2). Patients with significant pulmonary stenosis and/or regurgitation were excluded.
Data collected from December 2014 to December 2016 were analyzed. All study protocols conformed to the ethical guidelines of the Declaration of Helsinki (1975) and were approved by the Institutional Review Board of the Tokushima University Hospital. Written, informed consent for their children to participate in the study was provided by the parents.
Cardiac catheterization
Cardiac catheterization and angiography (Integris Allura 9 Biplane; Phillips Medical Systems, Best, The Netherlands) proceeded using 4–6 Fr catheters.
Data were acquired during routine cardiac catheterization. PA pressure (PAP) measurement was performed using a high-fidelity manometer-tipped 0.014-inch pressure wire (PressureWire Aeris; St Jude Medical, Inc., St. Paul, MN, USA). Recordings were made with respiration suspended at the end of expiration. All hemodynamic data were acquired at a sampling rate of 100 Hz before the administration of any contrast agents. PA blood flow was estimated using the Fick principle. Stroke volume indexed to body surface area (BSA), expressed in mL/m2, was calculated based on the pulmonary blood flow in 1 min divided by the heart rate (HR). The pulmonary vascular resistance index (PVRI; expressed in Wood Units ċ m2) was calculated as the mean PAP (mPAP) minus PA wedge pressure (PAWP) divided by the pulmonary blood flow indexed to BSA (PVRI; expressed in Wood Units ċ m2).
Traditional catheterization-based measures of PA compliance
PA compliance has traditionally been calculated using two methods: designated systolic PA compliance (sPAC), which is determined from measures of pulse pressure and stroke volume indexed to BSA and expressed as stroke volume / Pmax – Pmin (mL/mmHg ċ m2),1–4 where Pmax – Pmin is the difference between the minimum and maximum PAP; and diastolic PA compliance (dPAC), which is estimated based on a two-element Windkessel model that assumes that compliance and hemodynamic resistance are constant during the measurement.6,7 PA compliance can also be estimated based on the PAP profile during diastole. The time constant (τ) of the exponentially decaying curve can be obtained from a mathematical fitting curve calculated from diastolic PAP. dPAC (mL/mmHg ċ m2) is calculated from PVRI and the PA time constant (τ),

Pressure phase plane (PPP)
PAP data (P(t)) were converted to digital data with a sampling frequency of 100 Hz (Fig. 1a), and to suppress small noise, continuous time derivative of pressure (dP/dt) versus time datasets were digitally smoothed using a five-point average (Fig. 1b). dP/dt versus P(t) phase plane-derived analogs of PA compliance parameters were used. The kinematic phase plane for a simple harmonic oscillator plots velocity (dx/dt) versus position (x(t)) of the harmonic oscillator (Fig. 1c), the kinematics of which is governed by the (mass-normalized) equation of motion as follows:
Kinematic pressure phase plane analysis. (a) Representative time course of PAP; (b) pulmonary arterial dP/dt obtained from the pressure contour shown in (a); (c) kinematic phase plane trajectory for an undamped, linear harmonic oscillator with a definite spring constant. Note that the major and minor diameters of the ellipse can be used to obtain the spring constant of the oscillator using Eqs. 3–5; (d) PPP loop of a patient with normal PAP shown in (a) and (b). The red dotted line indicates a linear fit to determine the pulmonary arterial diastolic time constant (slope −1/τ). The arrow indicates the dicrotic notch. Several cardiac cycles inscribed clockwise are shown; (e) PPP loop obtained from a postoperative ventricular septal defect patient with elevated PAP; (f) PPP loop generated by PAP obtained from a patient with IPAH.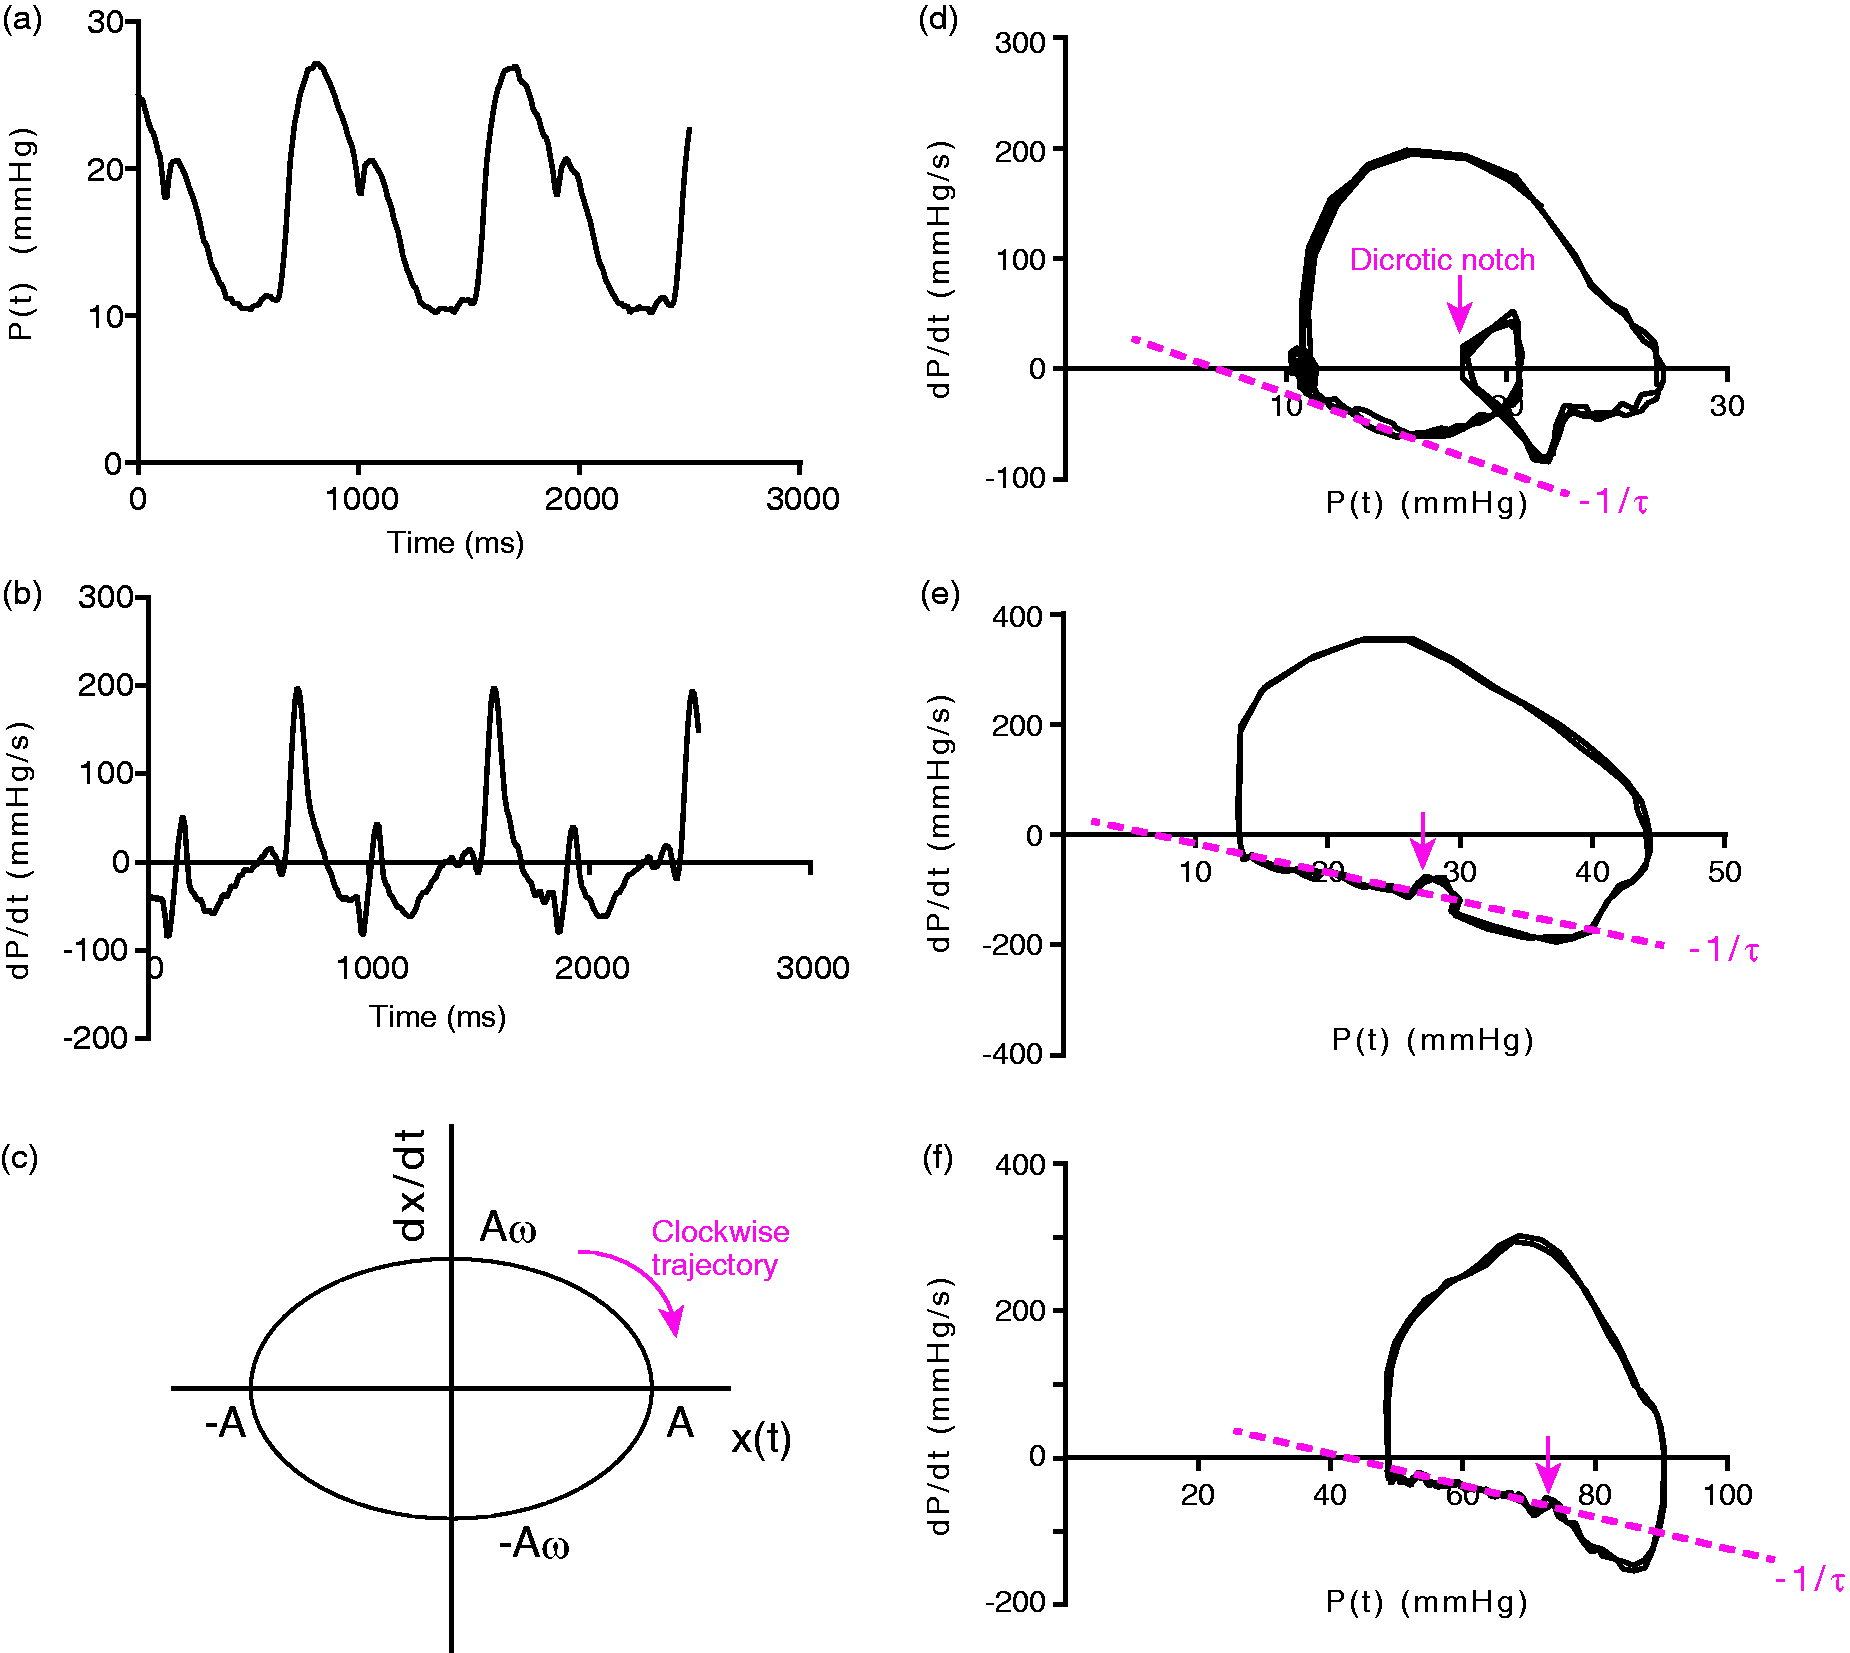


PPP-derived compliance analog
Based on a consideration of the geometric features of the loop inscribed in the kinematic phase plane for an ideal oscillator, a method was proposed for deriving a compliance analog from the same geometric features of the PPP loop generated by the PA. Assuming undamped (c = 0) oscillation and suitable initial conditions, the solution to Eq. 2 is as follows:


Therefore, spring constant can be derived from the square of the ratio of the maximum y-axis position of the loop (Aω) to half the width on the x-axis (A).
5
Consequently, by replacing x and dx/dt with P and dP/dt, the PPP-derived compliance analog can be defined as the square of the peak derivative of pressure divided by half the difference between the minimum and maximum pressure ([Pmax – Pmin]/2) or:
We can then obtain PPP-derived values for vascular compliance from data in the upper half of the phase plane during early systole by using the analogous features of the loop inscribed by the PAP contour. Therefore, for each child, we analyzed ten cardiac cycles of PAP data (P(t)) and PPP, and then averaged the results.
Influence of preload on the PPP-derived compliance analog
We also assessed the influence of preload on the PPP-derived compliance analog. Data measured during an increase in venous return by means of abdominal compression was used to determine the influence of preload on KPA. Therefore, PAP was measured in 11 children.12,13
Statistical analysis
All data are expressed as means ± SD or as medians with the 5th to 95th percentiles. The Wilcoxon–Mann–Whitney test was used to determine statistical significance. Linear regression analysis was performed, followed by the calculation of Pearson’s correlation coefficients, to investigate correlations between KPA and pulmonary hemodynamic parameters. All statistical data were analyzed using Prism (version 6.0; GraphPad Software, San Diego, CA, USA) and JMP 11 (SAS Institute, Inc., Cary, NC, USA), and P values < 0.05 were considered statistically significant.
Intra-observer variability was assessed by one investigator (YH) conducting offline measurements on the same patients eight weeks apart, and inter-observer variability was assessed by a second investigator (AO) who was unaware of the previous results and performed the same measurements on ten randomly selected participants. Intra-observer and inter-observer agreement was assessed using the intraclass correlation coefficient (ICC). In addition, agreement between investigators was tested using Bland–Altman analysis by calculating the bias (mean difference) and 1.96 SD around the mean difference.
Results
Clinical characteristics of the participants (n = 33).
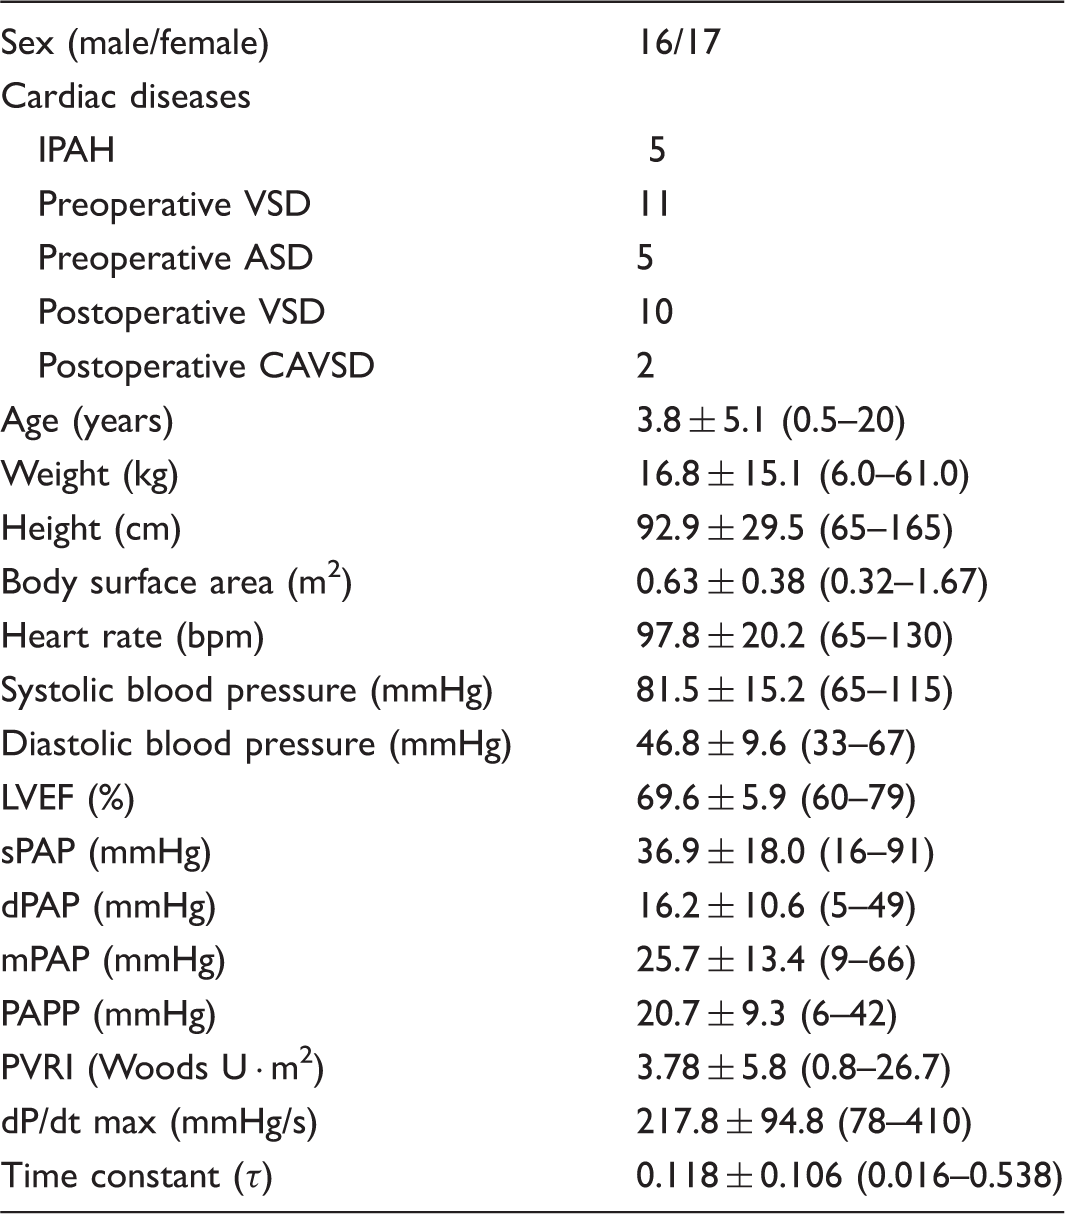
Values are presented as mean ± SD; the range for each variable is indicated in parentheses.
ASD, atrial septal defect; CAVSD, complete atrioventricular septal defect; dPAP, diastolic pulmonary arterial pressure; dP/dt max, peak positive value of time derivative of pulmonary arterial pressure; IPAH, idiopathic pulmonary arterial hypertension; LVEF, left ventricular ejection fraction; mPAP, mean pulmonary arterial pressure; PAPP, pulmonary arterial pulse pressure; PVRI, pulmonary vascular resistance indexed for body surface area; sPAP, systolic pulmonary arterial pressure; VSD, ventricular septal defect.
Validation of the PPP-derived compliance analog KPA
KPA showed significant negative correlations with sPAP and mPAP (r = −0.45, P = 0.0090 and r = −0.41, P = 0.0152, respectively) (Fig. 2a and 2b). KPA, the PA compliance analog during the early ejection period, showed a significant correlation with sPAC (r = 0.52, P = 0.0018), but not with dPAC (Fig. 2c and 2d). Furthermore, significant correlations were observed with both τ and PVRI (r = −0.51, P = 0.0026 and r = −0.39, P = −0.0242, respectively) (Fig. 2e and 2f).
Relationship between the pulmonary arterial compliance analog KPA and hemodynamic parameters. Relationships were plotted between (a) KPA and sPAP, (b) mPAP, (c) sPAC, (d) dPAC, (e) the time constant (τ), and (f) the PVRI.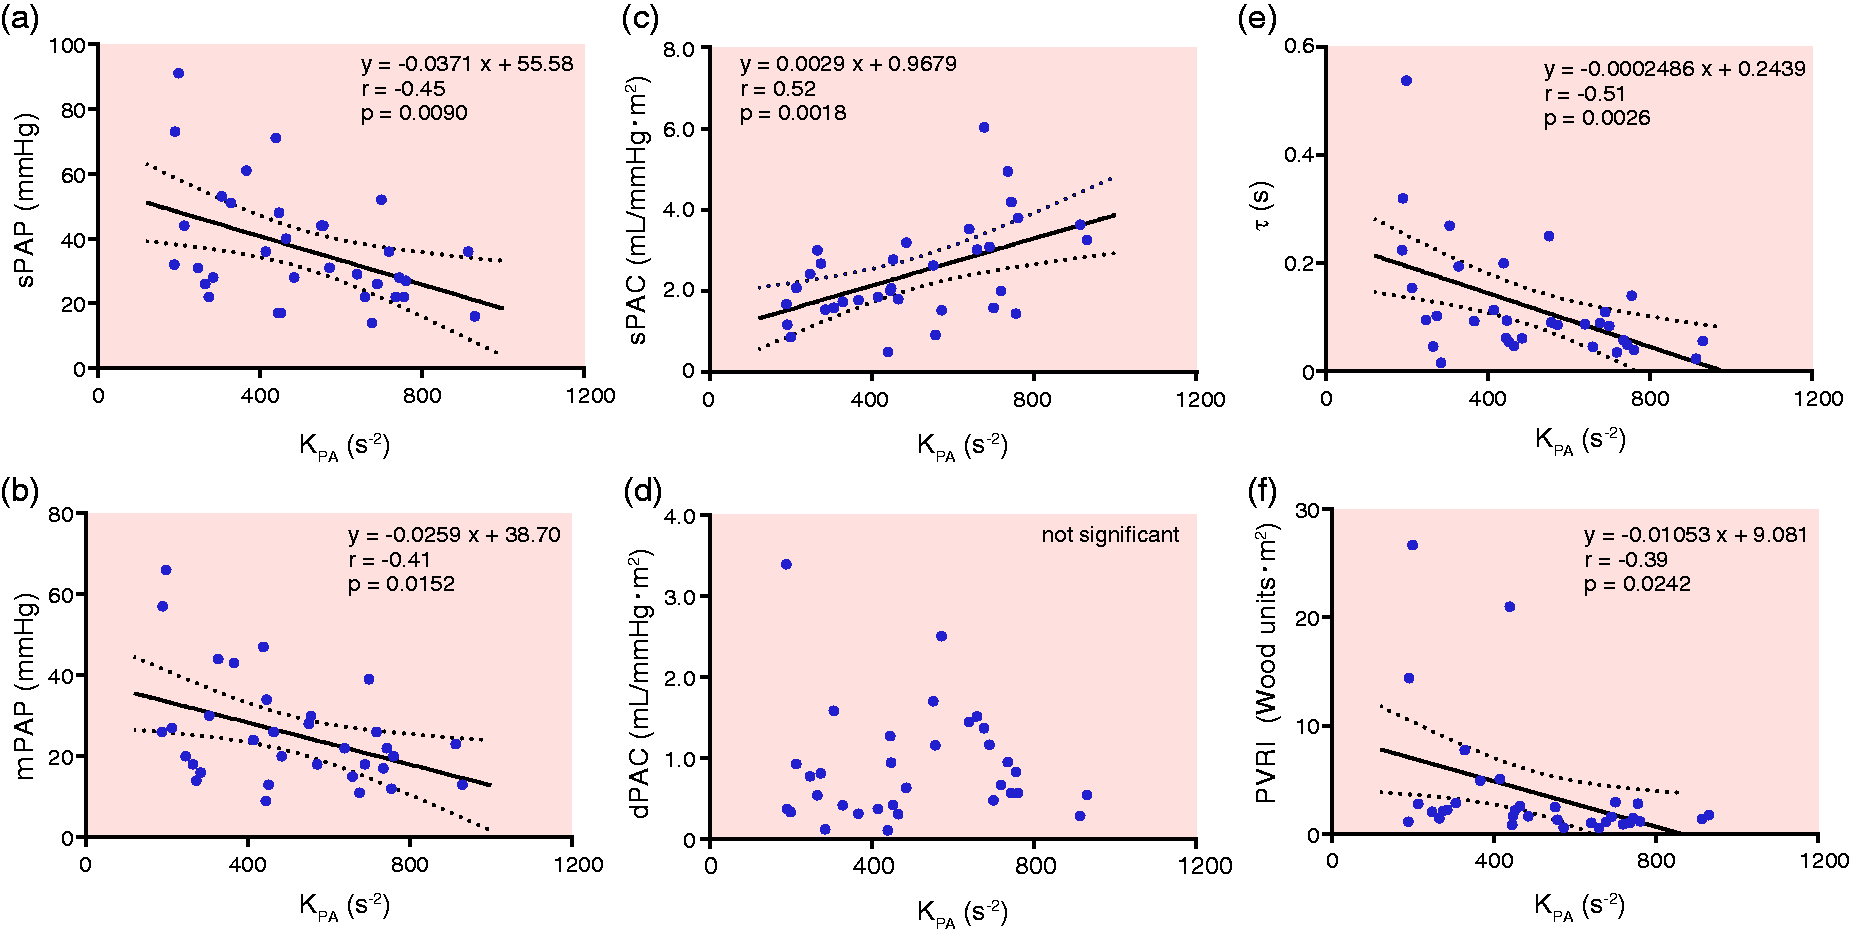
Next, we assessed the influence of increased preload on the PPP-derived compliance analog KPA (Fig. 3a and 3b). Significant changes were observed in systolic pressure in the 11 children who underwent abdominal compression (Fig. 3c). During the maneuver, no significant changes were seen in Pmax – Pmin or dP/dt_max (Fig. 3d and 3e). Although KPA was expected to alternate owing to the increased preload during abdominal compression, no definite alteration was observed. In addition, no significant difference was observed in KPA between before and during abdominal compression (Fig. 3f).
Effect of increased preload on KPA. (a) Representative recording of PAP by the increased preload during abdominal compression; (b) pulmonary PPP loops are shown. Blue loops (a) indicate the trajectory before abdominal compression, whereas red loops (b) indicate the trajectory during abdominal compression; (c) the peak pulmonary arterial pressure (Pmax) before and during abdominal compression; (d) Pmax – Pmin before and during abdominal compression; (e) the peak pulmonary arterial dP/dt (dP/dt_max) before and during abdominal compression; (f) KPA before and during abdominal compression in 11 patients. No significant difference in KPA was observed.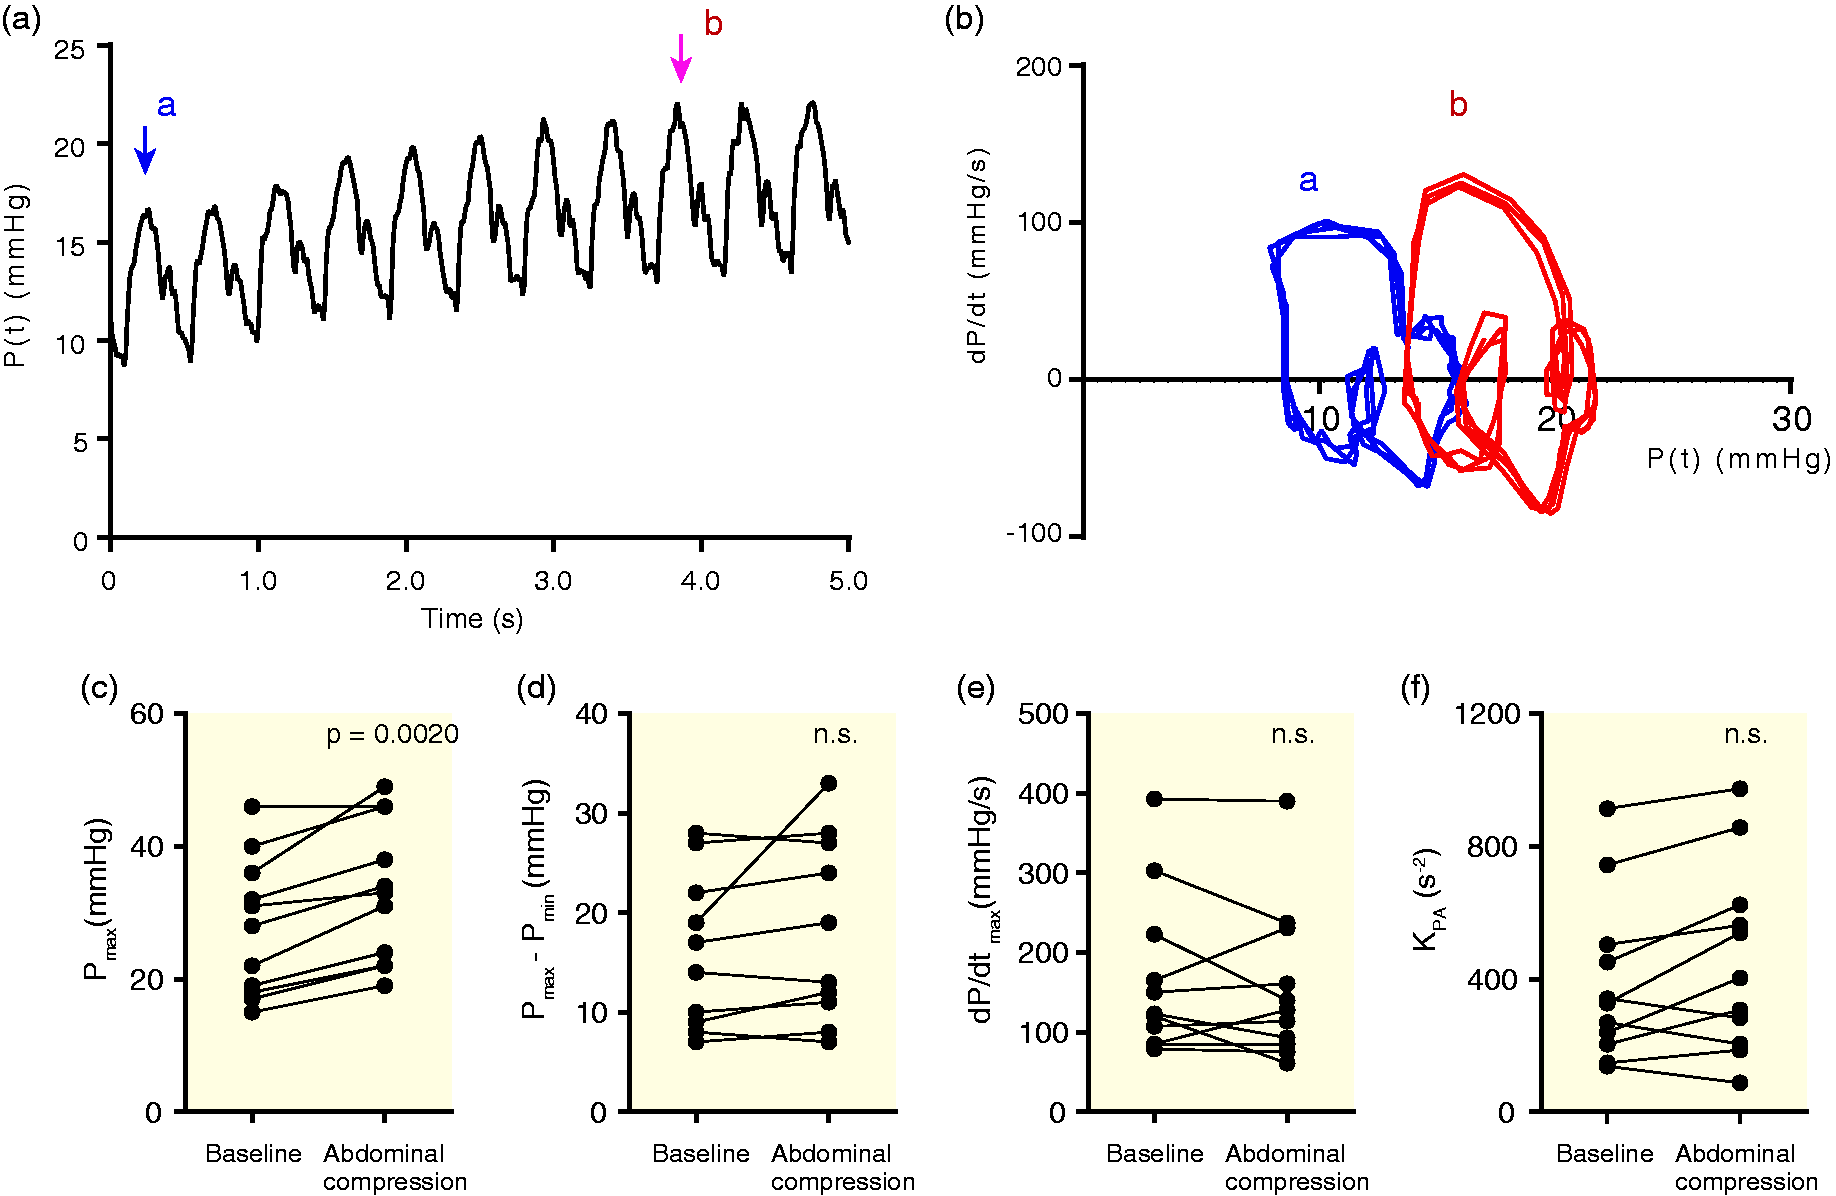
Reproducibility
Inter-observer and intra-observer reproducibility.
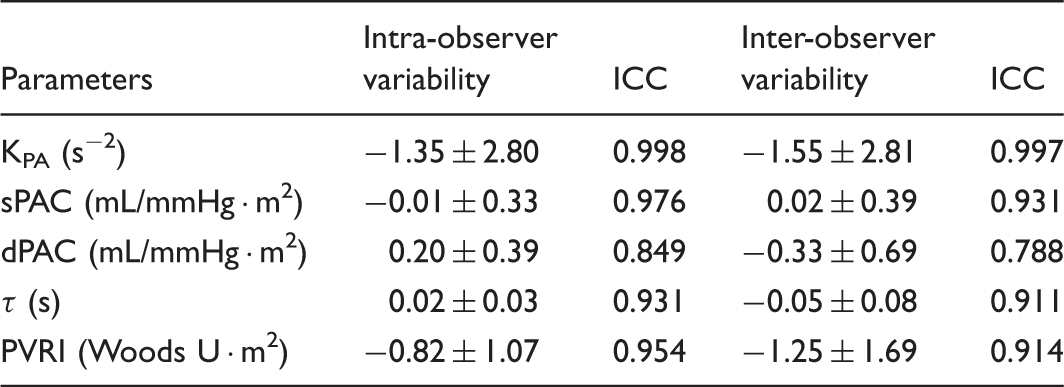
Inter-observer and intra-observer variabilities (bias ± 1.96 SD [95% limit of agreement]), and the intraclass correlation coefficient (ICC) are shown.
KPA, a pressure phase plane-derived pulmonary arterial compliance analog parameter; sPAC, systolic PA compliance; dPAC diastolic PA compliance; τ, time constant; PVRI, pulmonary vascular resistance index.
Discussion
We demonstrated that KPA, defined using PPP and calculated as Eq. 7, can be a useful compliance analogous parameter to determine PA characteristics. It is easily evaluated and highly reproducible. To our knowledge, this is the first study to demonstrate the feasibility of a PPP-derived parameter to determine PA compliance.
Although PA compliance is a major determinant of RV work 14 and has great impact on prognosis in various cardiac diseases,1–4 its estimation has remained challenging. Therefore, in the present study, we chose to assess PA compliance using the PPP. Simple harmonic oscillator kinematics have a definite spring constant, measured in units of mass per second, and can be easily derived from Hooke’s law. By applying the analog of the kinematic phase plane-derived geometric features of an ideal oscillator’s loop, we determined novel, analogous PPP-derived parameters of PA compliance.
In the present study, we found a significant correlation between KPA and sPAC calculated using stroke volume and PA pulse pressure. This result indicates that KPA can indicate PA compliance during systole. However, in terms of the relation with dPAC, no significant correlation was observed. This result might be explained by the different phases of the cardiac cycle. Vascular compliance changes significantly and non-linearly throughout the cardiac cycle. Furthermore, the dPAC is strongly influenced by the PVRI. These factors would likely affect the relationship between KPA and dPAC. sPAP and mPAP were significantly inversely correlated with KPA. These results are reasonable in a sense because PH induces the aggravation of PA compliance. Furthermore, the PVRI and the time constant (τ) both showed a significant correlation with KPA. These results do not necessarily mean that KPA is affected by PA compliance. However, together with these results, theoretical kinematic equations affirm that KPA can be a useful parameter for the assessment of PA compliance.
This study was not meant to replace the conventional parameters, but to complement them and facilitate a comparison of vascular properties. The results suggest that KPA can be an excellent analogous parameter for PA compliance.
The kinematic modeling approach for characterizing vascular physiology was introduced by Chung et al. 5 They concluded that PPP-derived left ventricular and aortic stiffness (inverse of compliance) are strongly coupled. 5 Furthermore, they anticipated that a stiffer aorta would have a higher K, because as the left ventricle ejects blood, a more compliant aorta would accommodate the volume and thereby reduce ventricular dP/dt, whereas a stiffer vessel would require an increased rate of pressure development and resist distension, thereby requiring greater ultimate pressure and dP/dt. Chung et al. 5 considered that the stiffer vascular pressure waveform resulted in a higher K obtained from Eq. 7. However, our investigation demonstrated the opposite results, that is, KPA is a compliance variable. The stiffer PA, shown by lower sPAC, higher systolic PAP, higher mPAP, and higher PVRI resulted in lower KPA (Fig. 2). We speculated that the discrepancy between Chung et al.’s anticipation and our results could be explained as follows: the equation shows the combination of PA properties and RV function. In patients with stiffer PA and higher PAP, RV contractility would become relatively poor, thereby reducing ventricular dP/dt.15,16 Therefore, a stiffer vessel would show a lower rate of pressure development, a smaller dP/dt_max, and require greater ultimate pressure elevation. These hemodynamic changes would result in lower KPA in patients with stiffer PA. The lower spring constant generates higher deformation of the spring (x), which algebraically corresponds to the physiological condition that lower PA compliance (low KPA) generates higher PAP.
The harmonic oscillator is governed by the interplay of inertial and stiffness forces.17,18 The problem regarding the assessment of vascular compliance using harmonic oscillator kinematics and Chung et al.’s theory is that the Pmax – Pmin/2 (in Eq. 6) cannot be the same as P–P∞ (P∞: asymptote) in the assessment of left ventricular kinematics,17–20 which can generate the d2P/dt2 of the inertial force determined by Newton’s law. In the case of evaluating vascular stiffness (inverse of compliance), d2P/dt 2 would be influenced by not only vascular stiffness, but also ventricular contraction. In this respect, the PAP contour is not a pure oscillatory system because it is connected to the RV. However, the upper half of PA PPP shows a nearly elliptical shape, which is indicated by the ideal harmonic oscillator. Therefore, we consider that PA characteristics associated with RV systolic performance establish the ellipse on the PPP, which can be assessed as a harmonic oscillator. According to Hooke’s Law, the lower K generates a higher x. This corresponds with the fact that lower KPA generates higher PAP with lower compliance.
To more fully characterize the novel vascular compliance parameter, we assessed the correlation with preload alteration using abdominal compression. No significant difference was seen in KPA between before and during abdominal compression, and each patient had individual alternation. This result could not indicate whether this parameter value is volume independent or not. The RV and PA behavior influenced by the increased preload would be dependent on the individual circulatory pathological condition. Otherwise, the result might indicate that KPA remains constant despite the preload increase with the minimum error, and is therefore a volume-independent parameter. Additional studies using alternate preloads are necessary to further elucidate the transient effects of volume change on KPA.
ICC and Bland–Altman analysis indicate that the KPA measurement has high reproducibility. Precise volumetric measurement is challenging, especially in the right ventricle. We therefore determined that KPA has high reproducibility and can be determined independent of volume.
Limitations
We postulated that the PPP analog for PA compliance from the kinematic phase plane complies with the harmonic oscillator, as previously reported. However, our results suggest that the PAP contour may not be a pure harmonic oscillatory system because it is connected to the RV and drains into the arteries. Therefore, damped or forced oscillator kinematics would be necessary for a more detailed analysis, and should therefore be investigated in the future.
Moreover, since the sample cohort was relatively small, further studies with larger patient populations are necessary to determine the utility of this parameter. In the present study, we demonstrated the usefulness and generalizability of the PPP-derived parameter using data from clinically heterogeneous participants. Further studies involving specific cardiac diseases and longer spans are needed. Since we did not simultaneously measure central venous pressure or volume shift during abdominal compression, we cannot guarantee that the degree of increase in preload was similar in all patients. However, we performed abdominal compression in a very similar way for each patient in accordance with the physique. PA pressure during abdominal compression were consistent and significant. Studies altering HR or load via infusion of positive inotropes or vascular constrictors/dilators may further elucidate the short-term features; these factors were not within the scope of the present study. In addition, the influence of chronic RV and PA remodeling also should be elucidated. An alteration in vascular pressure or stiffness, independent of ventricular pressure, may also assist in determining whether vascular properties lead to changes in the compliance parameter.
Traditional catheterization-based measures of aortic stiffness are calculated via effective arterial elastance (Ea). For technical reasons, we did not measure pulmonary Ea, nor did we, owing to the lack of load variation (volume) during data acquisition, make any comparisons with the compliance analog parameter; single-beat methods of calculating Ea lead to unstable or inconsistent results in terms of RV and PA. Furthermore, Ea is actually a Windkessel metric as opposed to a direct measure of arterial elastance, and is thus more dependent on arterial resistance than compliance.11,21 In a sense, there is no gold standard measure of arterial stiffness and compliance. However, it has generally been characterized in the literature as an acceptable clinical and experimental surrogate of elastance. It would therefore be desirable to elucidate the relation between them.
Conclusions
Our findings suggest the feasibility of PA compliance analog measurement using kinematic physiological theory because it is load-independent method, has high reproducibility, and can easily be used in clinical practice.
Footnotes
Conflict of interest
The author(s) declare that there is no conflict of interest.
Funding
This research received no specific grant from any funding agency in the public, commercial, or not-for-profit sectors.