
Abstract
17β-estradiol (E2) exerts complex and context-dependent effects in pulmonary hypertension. In hypoxia-induced pulmonary hypertension (HPH), E2 attenuates lung vascular remodeling through estrogen receptor (ER)-dependent effects; however, ER target genes in the hypoxic lung remain unknown. In order to identify the genome regulated by the E2-ER axis in the hypoxic lung, we performed a microarray analysis in lungs from HPH rats treated with E2 (75 mcg/kg/day) ± ER-antagonist ICI182,780 (3 mg/kg/day). Untreated HPH rats and normoxic rats served as controls. Using a false discovery rate of 10%, we identified a significantly differentially regulated genome in E2-treated versus untreated hypoxia rats. Genes most upregulated by E2 encoded matrix metalloproteinase 8, S100 calcium binding protein A8, and IgA Fc receptor; genes most downregulated by E2 encoded olfactory receptor 63, secreted frizzled-related protein 2, and thrombospondin 2. Several genes affected by E2 changed in the opposite direction after ICI182,780 co-treatment, indicating an ER-regulated genome in HPH lungs. The bone morphogenetic protein antagonist Grem1 (gremlin 1) was upregulated by hypoxia, but found to be among the most downregulated genes after E2 treatment. Gremlin 1 protein was reduced in E2-treated versus untreated hypoxic animals, and ER-blockade abolished the inhibitory effect of E2 on Grem1 mRNA and protein. In conclusion, E2 ER-dependently regulates several genes involved in proliferative and inflammatory processes during hypoxia. Gremlin 1 is a novel target of the E2-ER axis in HPH. Understanding the mechanisms of E2 gene regulation in HPH may allow for selectively harnessing beneficial transcriptional activities of E2 for therapeutic purposes.
Introduction
Pulmonary arterial hypertension (PAH) is a progressive and devastating disease characterized by muscularization, dysregulated vasoconstriction, and formation of occlusive lesions in the pulmonary arteries.1–3 These changes lead to increased right ventricular (RV) afterload and, if left untreated, RV failure and death.1–3 Despite a strong predisposition for female gender with female-to-male ratios ranging from 1.4–4:1 in modern patient registries,4–11 female patients survive longer than male patients.4,5 This phenomenon is referred to as the “estrogen paradox” of PAH. 12
This paradox has been attributed to complex and context-dependent effects of sex hormones, in particular 17β-estradiol (E2). While studies suggest E2 may contribute to PAH pathogenesis in the setting of altered serotonin or bone morphogenetic protein receptor 2 (BMPR2) signaling,13–17 we and others showed that E2 is protective during hypoxia.18–23 Specifically, we showed that E2 attenuates pulmonary artery (PA) vasomotor and proliferative responses to hypoxia.19,20,24 Since no anti-proliferative E2 effects were observed in the setting of normoxia, these data suggest that E2 exerts specific vasculoprotective effects during hypoxia. This is clinically relevant, as hypoxia is one of the most common inducers of pulmonary hypertension (PH) worldwide.25–27 A better understanding of the pulmonary vascular targets and the molecular signature of E2 in the hypoxic lung may allow for identification of novel therapeutic targets that may benefit the millions of patients with hypoxia-induced PH (HPH). In addition, even though PAH is phenotypically distinct from HPH, there is overlap in pathophysiological pathways, and findings obtained in HPH may help resolve the estrogen paradox in patients with PAH.
Our previous studies demonstrated that E2 exerts its hypoxia-specific anti-proliferative effects in an estrogen receptor (ER)-dependent manner. 20 While we identified the pro-proliferative mediator ERK1/2, the cell-cycle inhibitor p27Kip1 and the autophagy marker LC3B as targets of E2 and the ER in the hypoxic lung and in hypoxic PA endothelial cells (PAECs), 20 we hypothesized that E2 has additional targets in the hypoxic lung that have not yet been identified and that may be therapeutically targetable.
Specifically, we hypothesized that E2 in the setting of chronic hypoxia and through ER-dependent mechanisms drives a regulatory network distinct from chronic hypoxia alone, thus allowing for E2 to exert protective effects. Using microarray analyses of lung tissues from chronically hypoxic rats treated with E2 alone or with E2 plus the ER antagonist ICI 182,780 (fulvestrant), we identified a distinct set of lung target genes that were modulated by E2 and that were less robustly affected after co-treatment with ER antagonist. This ER-dependent genome includes a large list of regulators of cellular proliferation, signaling, and inflammatory responses. One of the most robustly affected targets was the hypoxia-inducible protein gremlin 1, a known bone morphogenetic protein (BMP) signaling inhibitor and mediator of PA cell proliferation. 28 Furthermore, gremlin 1 expression was transcriptionally and translationally repressed by E2 in an ER-dependent fashion. Taken together, these data suggest that E2, in an ER-dependent fashion, attenuates hypoxia-inducible pro-proliferative and pro-inflammatory signaling pathways.
Materials and methods
Animal care
All rats used in studies were approved by the Indiana University School of Medicine Institutional Animal Care and Use Committee and were adherent with the National Institutes of Health guidelines for care and use of laboratory animals under the animal welfare assurance act. Rats had ad libitum access to food and water.
Experimental model of PH
A group of four male Sprague-Dawley rats (250–300 g, Charles River, Wilmington, MA, USA) were implanted with subcutaneous osmotic pumps (Alzet, Cupertino, CA, USA) containing E2 released at a flow rate of 75 µg/kg/day for three weeks. This dose results in E2 levels equivalent to physiological concentrations in adult female Sprague-Dawley rats. 18 An additional group of four male rats were implanted with E2 osmotic pumps and concomitantly administered the non-selective ER-antagonist ICI 182,780 (ICI; Tocris, Bristol, UK) daily via subcutaneous injection (3 mg/kg/day). Following one week of recovery, E2, E2 + ICI treated rats, and four male hypoxic control rats were exposed to two weeks of hypobaric hypoxia (Patm = 362 mmHg; equivalent to 10% FiO2 at sea level) as described previously 20 (Supplemental Fig. 1). An additional four male rats were used as normoxic controls. All animals were part of a larger study in which we demonstrated that E2 ER-dependently attenuates HPH. 20 Hemodynamic, structural, and biochemical characteristics of the experimental groups were described previously. 20 Four animals from each group were randomly selected for microarray studies. Vehicle controls for E2 and ICI were tested in prior studies and found not to have any effects on cardiopulmonary parameters 20 (and were therefore not included in the current analysis).
Tissue processing
Immediately after hemodynamic assessment, animals were sacrificed via exsanguination under isoflurane anesthesia. The lung vasculature was cleared of blood by inserting a catheter into the PA and flushing it with saline. The left lung was inflated with 1% agarose, fixed for 48 h in 10% formalin, and used in subsequent immunohistochemical analysis. The right lung was snap frozen in liquid nitrogen and used for RNA isolation and western blot analysis.
RV hypertrophy
RV hypertrophy was determined by measuring the weights of the RV and left ventricle plus septum (LV + S) and calculating the Fulton index (RV/[LV + S]) as described previously. 20
RNA isolation and microarray analysis
RNA was isolated from lung homogenates using the TRIzol Plus RNA isolation kit (Ambion, Carlsbad, CA, USA) and further purified for microarray analysis using RNeasy clean up columns (RNeasy mini kit, Qiagen, Germantown, MD, USA). Quality of the total RNA was assessed by Agilent Bioanalyzer. The RNA integrity number (RIN) for all samples was ≥9. Individual rat lung RNA samples (n = 4 per group) were labeled using the Ambion WT expression kit (Ambion, Carlsbad, CA, USA) and Affymetrix GeneChip WT terminal labeling kits (Affymetrix, Santa Clara, CA, USA) using 100 ng of total RNA for each sample. Each sample was hybridized individually to Affymetrix Rat Gene 1.0 ST arrays followed by data analysis. Chips were examined for defects and none were found.
CEL files were imported into Partek Genomics Suite (Partek, Inc., St. Louis, MO, USA). RMA (robust multi-array average) signals were generated for the core probe sets using the RMA background correction, quantile normalization, and summarization by Median Polish. 29 Summarized signals for each probe set were log2 transformed. These log-transformed signals were used for principal component analysis, hierarchical clustering, and signal histograms to determine if there were any outlier arrays, and no outliers were detected. Untransformed RMA signals were used for fold change calculations. Data were analyzed using a one-way ANOVA followed by contrasts. Fold changes were calculated using the untransformed RMA signals. Probe sets with log2 expression levels <4.0 are very close to background. Probe sets with average expression levels <4.0 for all treatment groups were removed before the false discovery rate (FDR) was calculated using the Storey method. 30 Ingenuity pathways analysis (Qiagen, Germantown, MD, USA) was used to identify differentially expressed gene clusters, biological pathways, and networks. FDR was set at 10%. The microarray data were deposited in the NCBI Gene Expression Omnibus (GEO) database (GEO accession number GSE85618).
Quantitative real-time reverse transcription polymerase chain reaction
Total RNA from 10–30 mg snap-frozen lung tissue was extracted using the RNeasy Fibrous Tissue kit (Qiagen, Germantown, MD, USA) and quantified with a NanoDrop 2000 Spectrophotometer (Thermo Fisher Scientific, Waltham, MA, USA). To generate cDNA for real-time reverse transcription polymerase chain reaction (RT-PCR) analysis, 1 µg total RNA was reverse transcribed using iScript cDNA synthesis kit (Bio-Rad, Hercules, CA, USA). Real-time RT-PCRs were performed using the Applied Biosystems 7500 Real-time PCR system (Applied Biosystems, Thermo Fisher Scientific, Foster City, CA, USA). TaqMan gene expression assay primers that crossed exon boundaries were selected to avoid contamination of genomic DNA (Supplemental Table 1). Changes in mRNA expression were determined by the comparative CT (2–ΔΔCT) method. 31 Hypoxanthine phosphoribosyltransferase 1 (Hprt1) was used as endogenous control 32 and data were expressed as fold change to normoxic controls.
Western blotting
Lung tissue was homogenized using an Omni international tissue grinder (Thermo Fisher Scientific, Waltham, MA, USA) in ice-cold RIPA lysis buffer (Pierce-Thermo Fisher Scientific, Waltham, MA, USA) containing proteinase inhibitor cocktail (EMD-Millipore-Sigma Aldrich, St. Louis, MO, USA) and PhosStop inhibitor cocktails (Roche, Pleasanton, CA, USA). After homogenization, lysate was sonicated for ten 1-s pulses at 100% power and then centrifuged. The supernatant was saved and used as whole lung lysate. Protein concentration was measured using BCA Protein Assay (Pierce-ThermoFisher Scientific, Waltham, MA, USA). Rabbit polyclonal anti-Gremlin (LifeSpan Biosciences, Seattle, WA, USA), anti-phospho-Smad 1/5/8 (Cell Signaling, Danvers, MA, USA), anti-total Smad1 (Invitrogen-ThermoFisher Scientific, Carlsbad, CA, USA), and anti-BMP2 (Abcam, Cambridge, MA, USA) primary antibodies were used at a dilution of 1:1000 and mouse monoclonal anti-BMPR2 (BD Biosciences, San Jose, CA, USA) and anti-Vinculin (CalBiochem-EMD Millipore, Temecula, CA, USA) were used at a dilution of 1:1000 and 1:5000, respectively, all in 5% BSA (EMD-Millipore-Sigma Aldrich, St. Louis, MO, USA) in TBST (25 mM Tris, 1 M NaCl, 1% Tween 20). Rabbit-HRP (Cell Signaling, Danvers, MA, USA) and Mouse-HRP (KPL, Gaithersburg, MD, USA) secondary antibodies were diluted 1:2000 in 5% non-fat dry milk in TBST. Western blotting was performed in the lungs of the 16 animals used for microarray studies with validation of results in lungs from an additional 16 animals (n = 4/group) from Lahm et al. 20
Immunohistochemistry
Immunoperoxidase staining for gremlin 1 was performed on formalin-fixed, paraffin-embedded lung sections. Sections were heated in a vegetable steamer for 25 min in citrate antigen retrieval buffer (10 mM Sodium Citrate, 0.05% Tween-20, pH 6.0). Goat polyclonal anti-Gremlin (R&D Systems, Minneapolis, MN, USA) was used at a dilution of 1:100 in Dako Antibody diluent (Dako-Agilent Technologies, Carpinteria, CA, USA) and detected with ABC amplification using Universal Vectastain ABC kit (Vector Laboratories, Burlingame, CA, USA). Analysis was limited to PAs < 200 µm in diameter. Forty arteries were analyzed per animal. PAECs were semi-quantitatively assessed for gremlin staining intensity (0 = no staining, 1 = weak staining, 2 = moderate staining, 3 = strong staining, 4 = extremely strong staining) by two blinded investigators.
Statistical analysis
Results were expressed as means ± SEM. Statistical analyses were performed using one-way ANOVA with multiple comparisons between groups with post-hoc Tukey’s comparison test correction for individual comparisons using Graphpad Prism 5 software version 5.04. Significance was accepted if P < 0.05.
Results
E2 attenuates HPH in an ER-dependent fashion
The effects of E2 on endpoints of hypoxic pulmonary hypertension were characterized previously.
20
Briefly, E2-attenuated hypoxia-induced increases in RV systolic pressure, RV hypertrophy, and pulmonary vascular remodeling.
20
These effects were abolished after co-treatment with ER antagonist. Specific RV hypertrophy data for the 16 animals used in the present study are shown in Fig. 1. As shown before, E2-attenuated hypoxia-induced increases in RV hypertrophy, and this effect was blocked by co-treatment with ICI.
E2 decreases hypoxia-induced RV hypertrophy. Effects of E2 or ER antagonist ICI 182,780 on RV mass expressed as Fulton’s index (RV weight divided by left ventricle + septum weight; RV/[LV + S], all in grams). n = 4 per group. *P < 0.05 vs. normoxia control, #P < 0.05 vs. hypoxia, $P < 0.05 vs. hypoxia + E2 + ICI. One-way ANOVA with Tukey’s post-hoc correction. Data expressed as means ± SEM.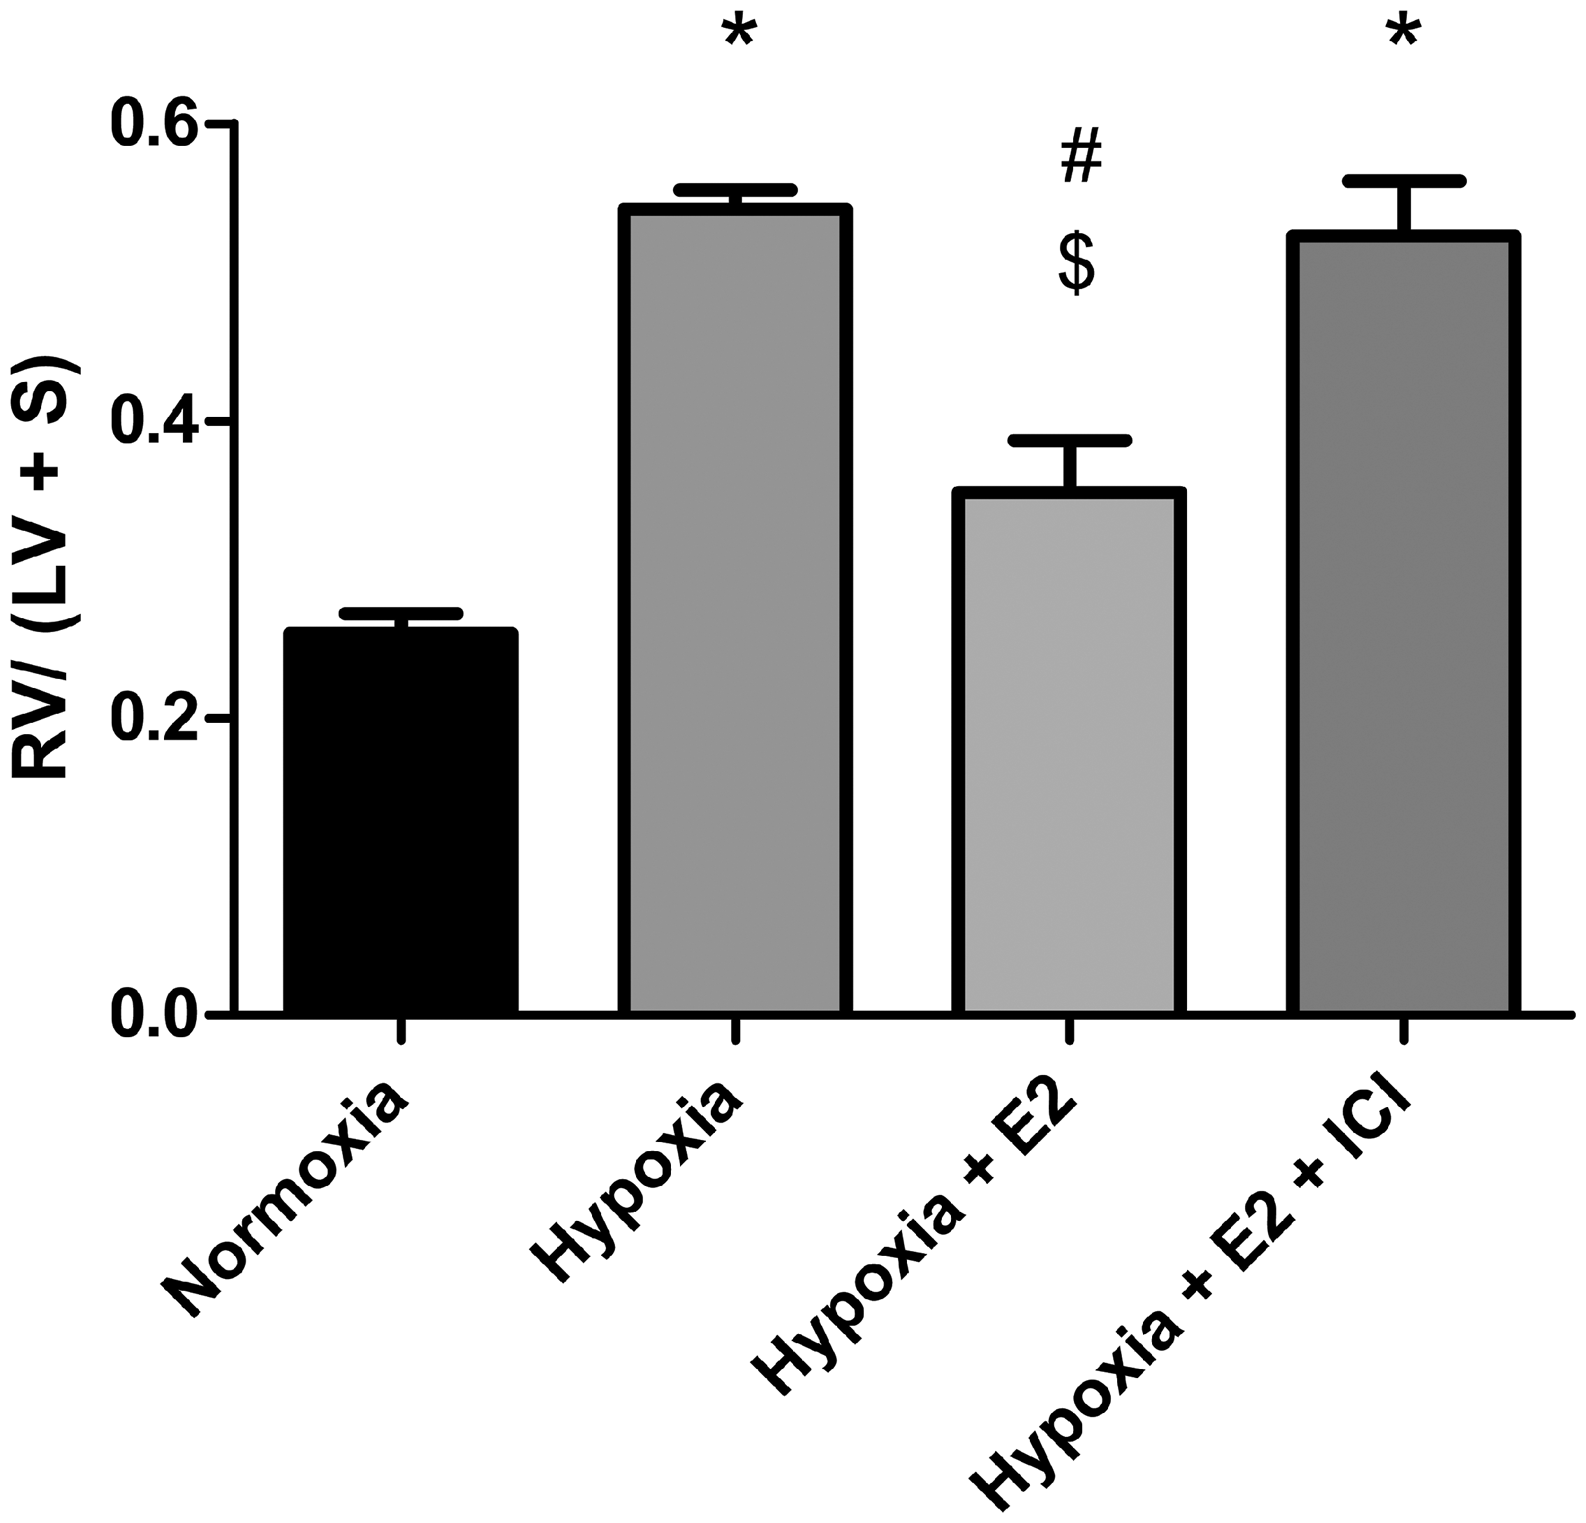
E2 regulates a distinct set of ER-dependent genes in HPH to induce a pattern that is similar to normoxia
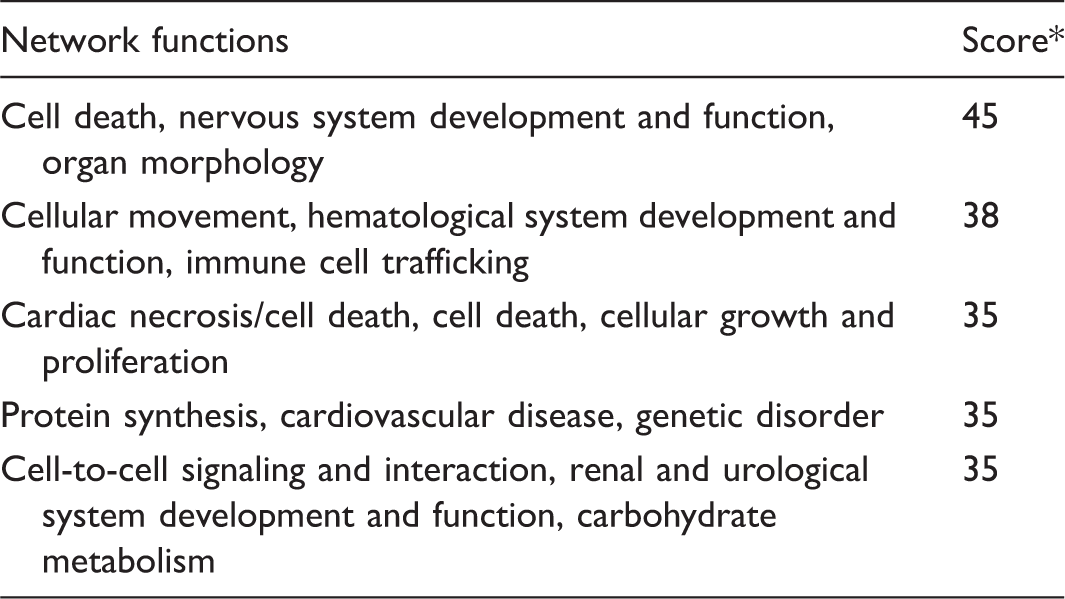
Using microarray analysis with an FDR cutoff of 10%, we identified 2889 genes that were differentially regulated across all four groups. Additionally, 2238 genes were differentially expressed in hypoxic animals compared with normoxic controls (Supplemental Table 2). This is in contrast to 1449 genes that were differentially expressed in hypoxia + E2 animals compared with normoxia. Interestingly, 203 genes were differentially expressed in hypoxia + E2 rat lungs compared with hypoxia alone and 142 genes were differentially expressed between hypoxia + E2 versus hypoxia + E2 + ICI (Supplemental Table 2). Heat map analysis of the top 100 genes that were the most differentially regulated across all groups revealed that the hypoxia + E2 group exhibited less pronounced hypoxia-induced gene upregulation than the hypoxia or hypoxia + E2 + ICI groups, resulting in a distinct expression pattern regulated by E2 that was in part similar to the pattern seen in normoxia controls (Fig. 2). Specific genes identified in that group are listed in Fig. 3. While several genes did not reach the threshold of a 1.5-fold change, four genes (thrombospondin 2, Thbs2; carboxypeptidase X (M14 family) member 2, Cpxm2; Ly6/Plaur domain containing 1, Lypd1; Gremlin1, Grem1) were decreased by E2 beyond that threshold. Using Ingenuity network analysis, the genes most affected by E2 were identified to regulate cell movement, immune cell trafficking, cell death and proliferation, protein synthesis, cell-to-cell signaling and interaction, and carbohydrate metabolism (Table 1).
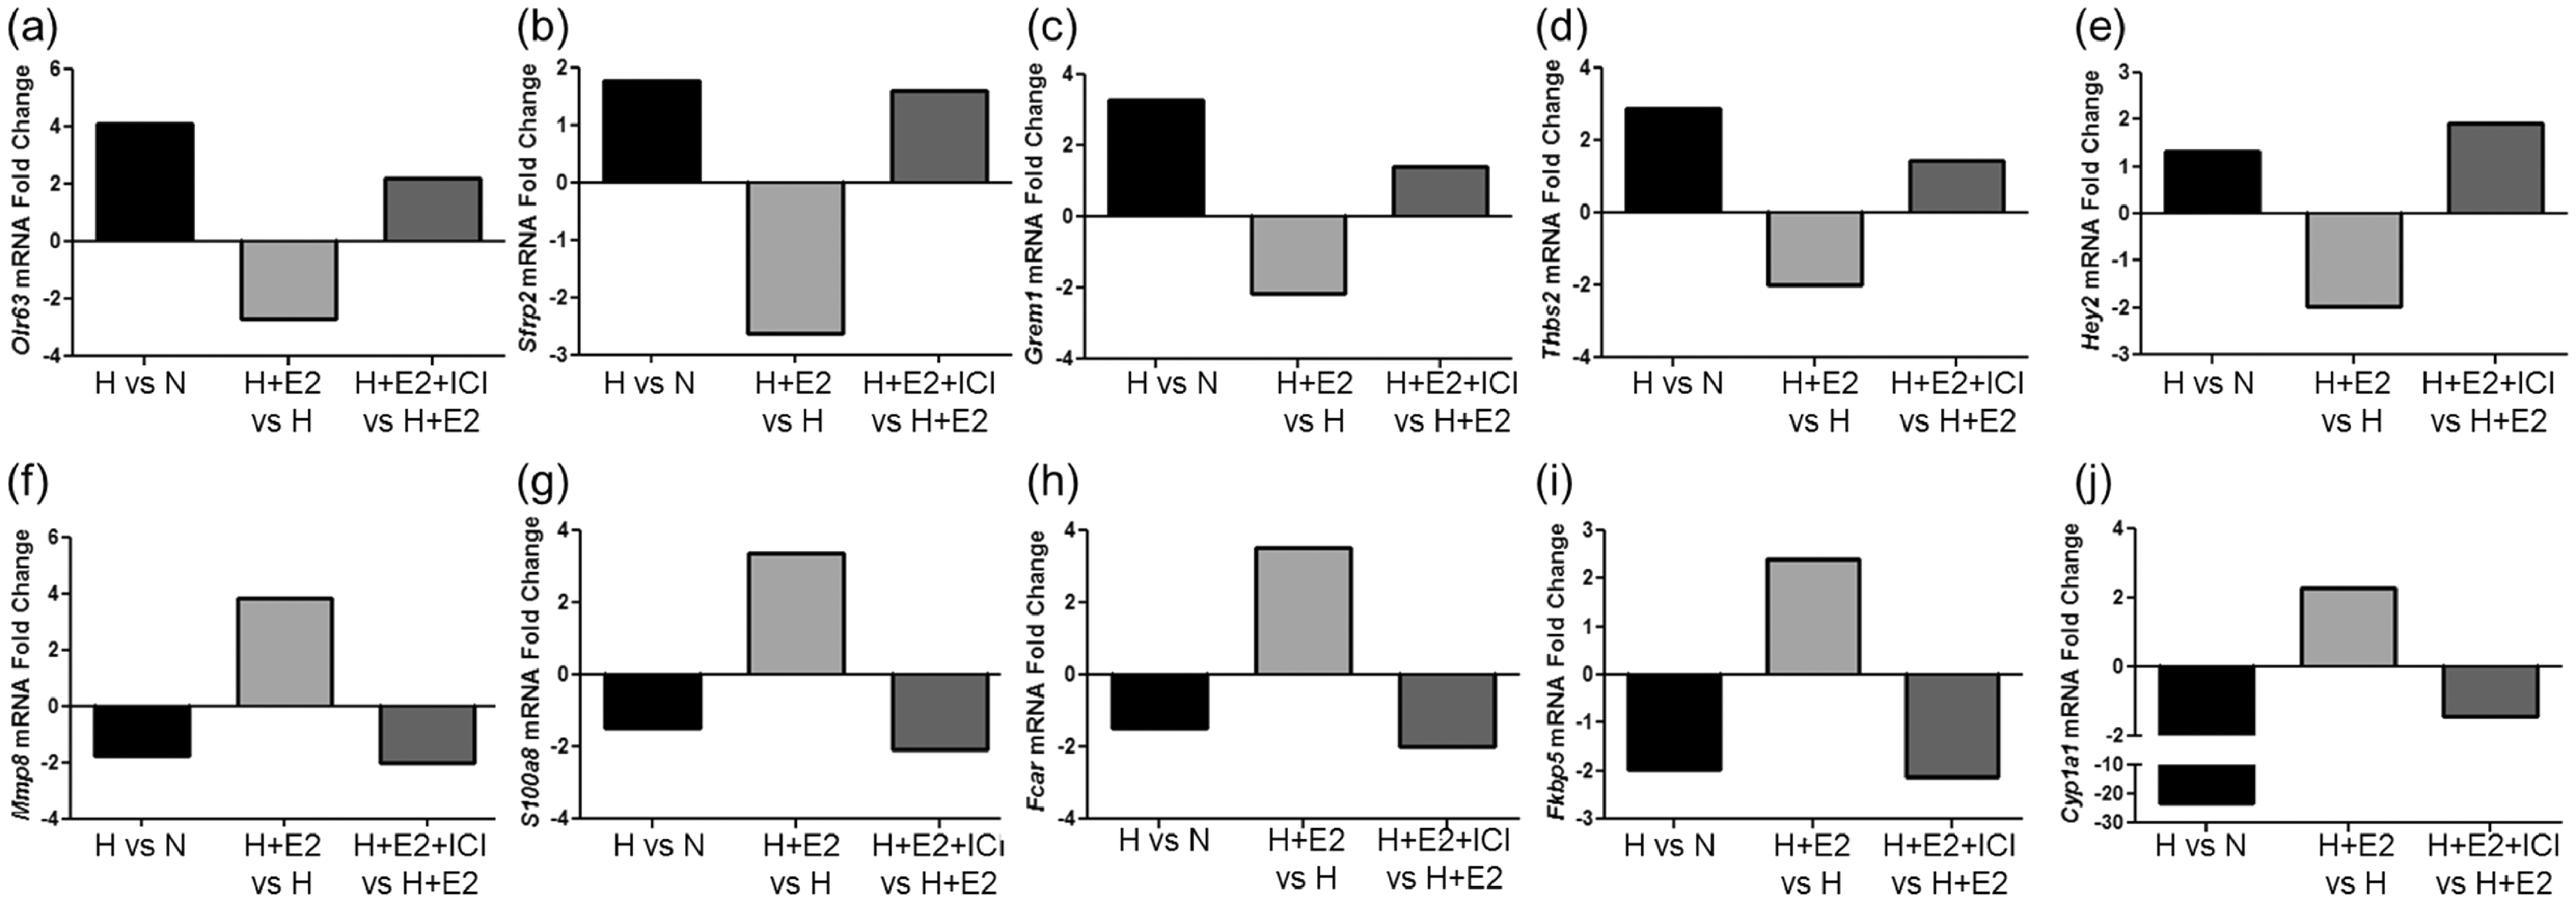
Heat map representing 100 most differentially expressed genes between experimental groups. Each row represents an animal sample and each column represents a gene. Red represents upregulated genes, blue represents downregulated genes. Hierarchal clustering analysis indicates hypoxia and hypoxia + E2 + ICI exhibit the most similarities, while hypoxia + E2 exhibits the closest similarity to normoxic controls. Note that a subset of genes in the hypoxia + E2 group demonstrated an expression pattern similar to that in normoxia controls (black box), whereas no such pattern was noted in hypoxia controls or hypoxic animals treated with E2 and ER antagonist ICI 182,780. Nkd2, naked cuticle homolog 2 (Drosophila); Thbs2, thrombospondin 2; Cpxm2, carboxypeptidase X (M14 family), member 2; Olfml2b, olfactomedin-like 2B; Lypd1, Ly6/Plaur domain containing 1; Uck2, uridine-cytidine kinase 2; Mustn1, musculoskeletal, embryonic nuclear protein 1; Inhba, inhibin beta-A; Rab4a, RAB4A, member RAS oncogene family; Fbln7, fibulin 7; Grem1, gremlin 1; Ccl21, chemokine (C-C motif) ligand 21; Fblim1, filamin binding LIM protein 1; Dpys15, dihydropyrimidinase-like 5; Robo4, roundabout homolog 4. E2 treatment attenuates hypoxia-induced changes in gene expression patterns in an estrogen receptor-dependent manner. Several genes were identified that after E2 treatment changed in an opposite direction than with hypoxia alone, and in which the effect of E2 was attenuated after ICI 182,780 co-treatment. (a–e) Genes upregulated in hypoxia (H) vs. normoxia (N) and in hypoxia + E2 + ICI 182,780 (H + E2 + ICI) vs. hypoxia + E2 (H + E2), respectively, and downregulated in hypoxia + E2 vs. hypoxia. (a) Olr63, olfactory receptor 63; (b) Sfrp2, secreted frizzled-related protein 2; (c) Grem1, gremlin 1; (d) Thbs2, thrombospondin 2; (e) Hey2, hairy/enhancer-of-split related with YRPW motif 2. (f–j) Genes downregulated in hypoxia vs. normoxia and in hypoxia + E2 + ICI vs. hypoxia + E2, respectively, and upregulated in hypoxia + E2 vs. hypoxia. (f) Mmp8, matrix metallopeptidase 8; (g) S100a8, S100 calcium binding protein A8; (h) Fcar, IgA Fc receptor; (i) Fk5bp, FK506 binding protein 5; (j) Cyp1a1, cytochrome P450, family 1, subfamily a, polypeptide 1. Genes were considered differentially regulated if fold change was >1.5, with a group FDR < 0.1, as determined by one-way ANOVA. Top associated network functions affected in E2-treated hypoxic animals (vs. untreated hypoxia controls). Score determined by number of molecules, cellular, and disease processes predicted to be affected by differentially regulated genes in hypoxia + E2 vs. hypoxia alone as determined by Ingenuity software.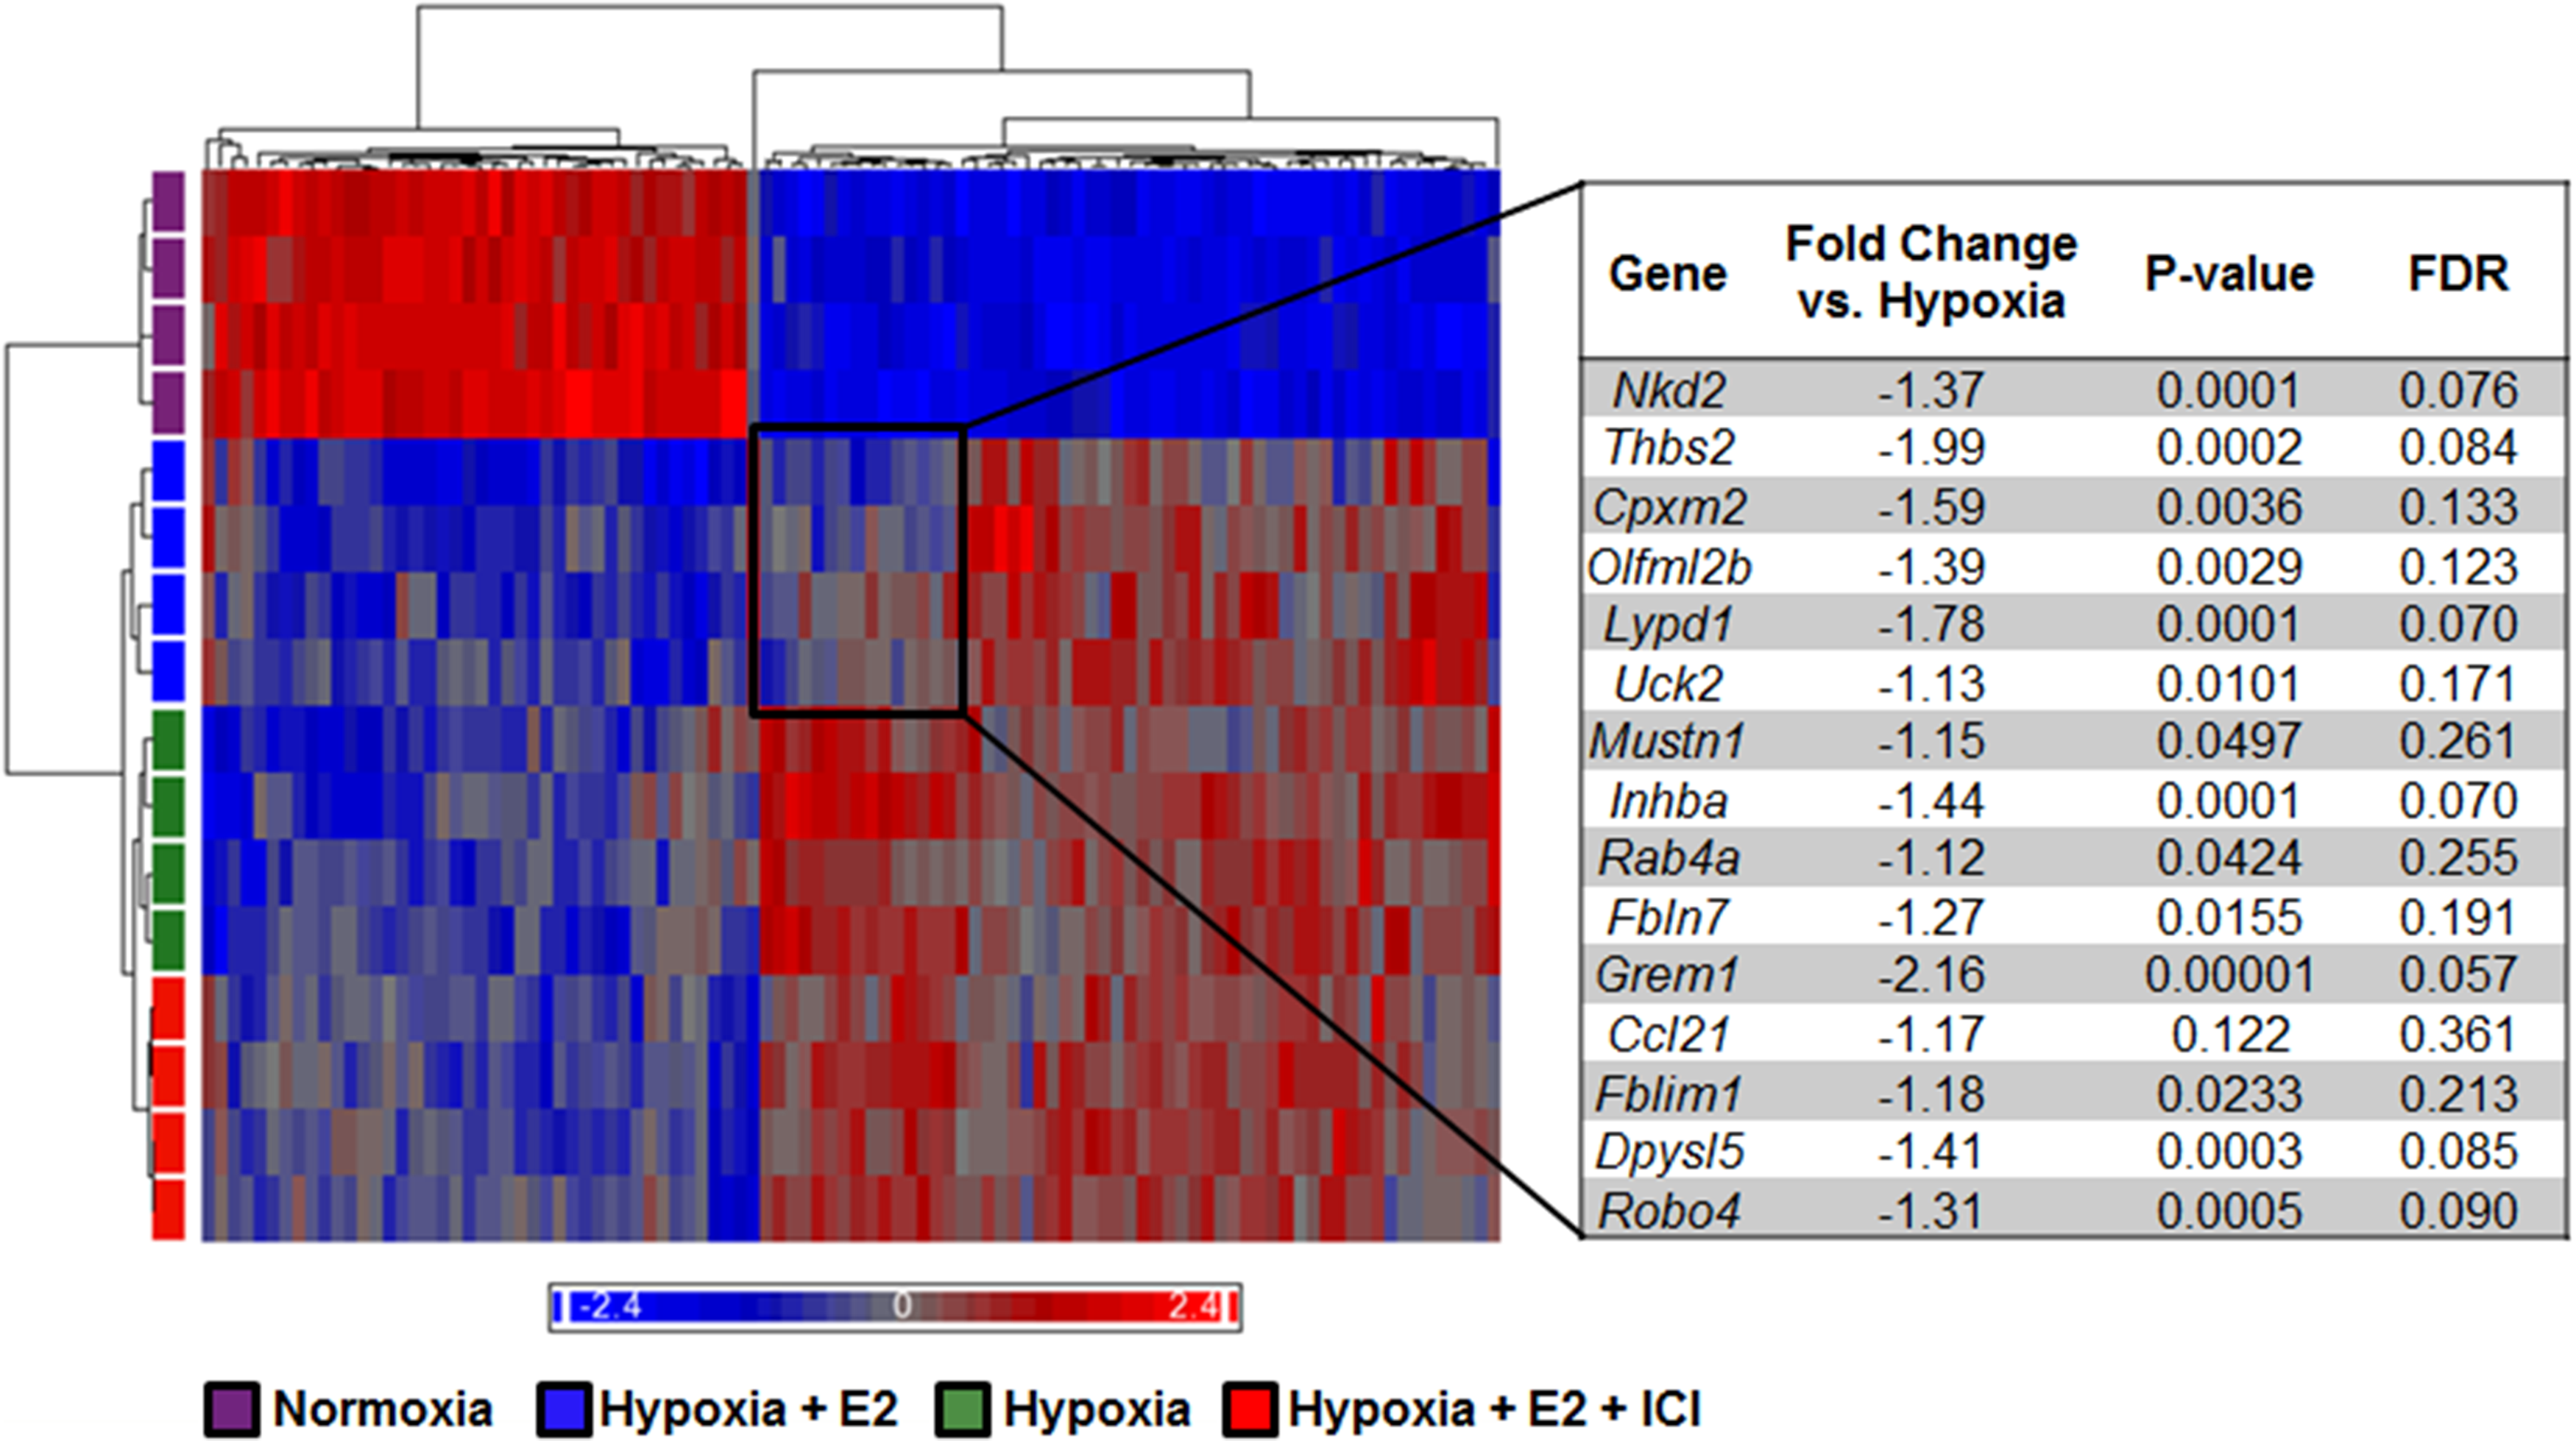
Identification of E2 target genes
List of genes most regulated during hypoxia by E2.
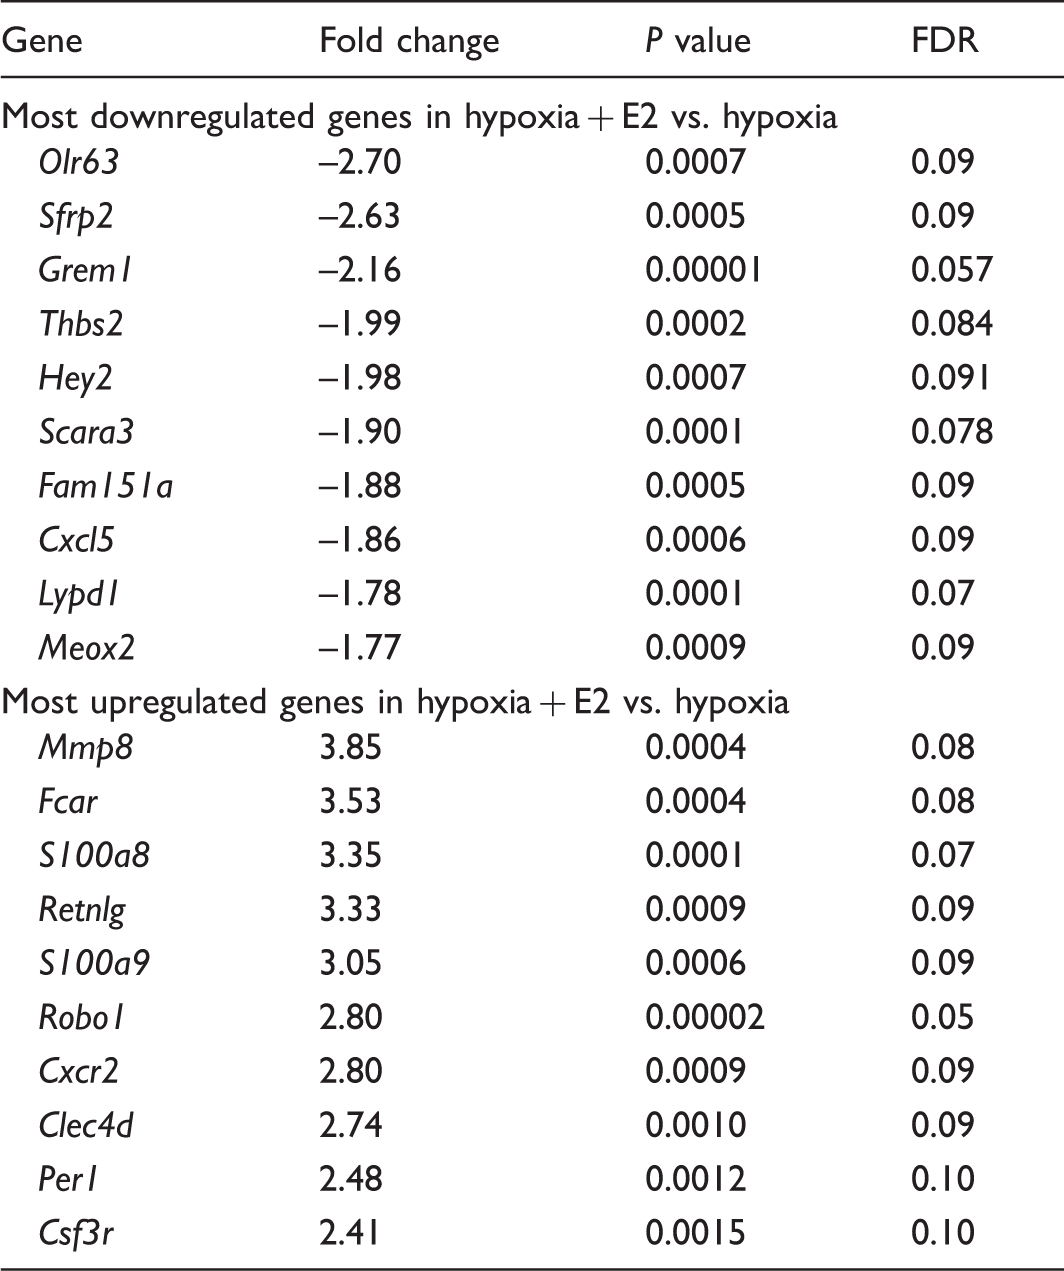
Hypoxia + E2 vs. hypoxia genes were considered significantly downregulated if the difference was greater than –1.5 fold change, P < 0.05, and FDR < 0.1 and upregulated if difference was greater than 1.5 fold change, P < 0.05, and FDR < 0.1.
Olr63, olfactory receptor 63; Sfrp2, secreted frizzled-related protein 2; Grem1, Gremlin 1; Thbs2, Thrombospondin 2; Hey2, hairy/enhancer-of-split related with YRPW motif 2; Scara3, scavenger receptor class A, member 3; Fam151a, family with sequence similarity 151, member A; Cxcl5, chemokine (C-X-C motif) ligand 5; Lypd, Ly6/Plaur domain containing 1; Meox2, mesenchyme homeobox 2; Mmp8, matrix metalloproteinase 8; Fcar, IgA Fc receptor; S100a8, S100 calcium binding protein A8; Retnlg, resistin-like gamma; S100a9, S100 calcium binding protein A9; Robo1, roundabout guidance receptor 1; Cxcr2, chemokine (C-X-C motif) receptor 2; Clecd4, C-type lectin domain family 4, member D; Per1, period homolog 1; Csf3r, colony stimulating factor 3 receptor (granulocyte).
In contrast to just three downregulated genes with a fold change >2 and 23 genes with a fold change >1.5, we identified 23 upregulated genes in hypoxia + E2 versus hypoxia animals with a fold change >2, and 70 genes with a fold change >1.5. Among the most upregulated genes (Table 2), we identified matrix metalloproteinase 8, Mmp8 (3.85-fold change versus hypoxia, Fig. 3f), S100 calcium binding protein A8, S100a8 (3.35-fold change versus hypoxia, Fig. 3g), IgA Fc receptor, Fcar (3.53-fold change versus hypoxia, Fig. 3h), FK506 binding protein 5, Fkbp5 (2.39-fold change versus hypoxia, Fig. 3i), and cytochrome P450, family 1, subfamily a, polypeptide 1, Cyp1a1 (2.28-fold change versus hypoxia, Fig. 3j) as well as resistin-like gamma, Retnlg (3.33-fold change versus hypoxia), S100 calcium binding protein A9, S100a9 (3.05-fold change versus hypoxia), roundabout 1, Robo1 (2.80-fold change versus hypoxia), chemokine (C-X-C motif) receptor 2, Cxcr2 (2.80-fold change versus hypoxia), C-type lectin domain family 4, member D, Clec4d (2.74-fold change versus hypoxia), period 1, Per1 (2.48-fold change versus hypoxia), and colony stimulating factor 3 receptor (granulocyte), Csf3r (2.41-fold change versus hypoxia). Interestingly, these genes play diverse roles in processes involved in HPH development such as cell movement,41,42 antigen presentation, 43 inflammation,44–46 angiogenesis, 47 chemokine signaling, 48 cellular growth, 49 and estrogen metabolism, 50 suggesting that E2 may exert its effects in HPH in part by targeting these processes.
Importantly, E2’s effects on several of these genes (Olr63, Srfp2, Grem1, Thbs2, Mmp8, S100a8, Fkbp5, and Cyp1a1) were abolished after co-treatment with ICI, suggesting that E2 regulates its target genome at least in part via an ER-dependent mechanism. These ER-regulated genes are depicted in Fig. 3.
Lastly, we evaluated the effect of hypoxia, hypoxia + E2, or hypoxia + E2 + ICI on gene expression of the two ERs, Esr1 (encoding ERα) and Esr2 (encoding ERβ). Microarray analysis revealed that neither Esr1 nor Esr2 expression were significantly affected by any experimental group in our study compared with normoxic controls (Supplemental Table 3).
Quantitative real-timeRT-PCR validation of E2 target genes
We next validated our microarray findings by quantitative real-time RT-PCR. We found that Olr63, Sfrp2, Grem1, Thsp2, and Hey2 were significantly downregulated in E2 treated versus untreated hypoxic lungs (Fig. 4a–e). The repression of Olr63 and Hey2 by E2 was blocked after inhibition of estrogen receptors by ICI. ICI tended to upregulate Sfrp2, Grem1, and Thbs2, but these effects were less robust and not statistically different versus E2. Additionally, we found Mmp8, Fcar, S100a8, and Fkbp5 to be significantly upregulated in hypoxia + E2 animal lungs compared with hypoxia alone, while E2-mediated upregulation of these genes was blunted after ICI treatment (Fig. 4f–i). Although not significant, E2 tended to increase Cyp1a1 compared with hypoxia alone (Fig. 4h). Taken together, these findings corroborate our key microarray findings.
Quantitative real-time RT-PCR microarray gene validation. Genes identified in the microarray as differentially regulated by hypoxia + E2 vs. hypoxia were validated using quantitative real-time RT-PCR. (a–e) Genes downregulated in hypoxia + E2 vs. hypoxia. (a) Olr63, olfactory receptor 63; (b) Sfrp2, secreted frizzled-related protein 2; (c) Grem1, gremlin 1; (d) Thbs2, thrombospondin 2; (e) Hey2, hairy/enhancer-of-split related with YRPW motif 2. (f–j) Genes upregulated in hypoxia + E2 vs. hypoxia. (f) Mmp8, matrix metallopeptidase 8; (g) S100a8, S100 calcium binding protein A8; (h) Fcar, IgA Fc receptor; (i) Fk5bp, FK506 binding protein 5; (j) Cyp1a1, cytochrome P450, family 1, subfamily a, polypeptide 1. n = 5 per group. *P < 0.05 vs. normoxia control, #P < 0.05 vs. hypoxia, $P < 0.05 vs. hypoxia + E2 + ICI. One-way ANOVA with Tukey’s post-hoc correction. Data expressed as means ± SEM.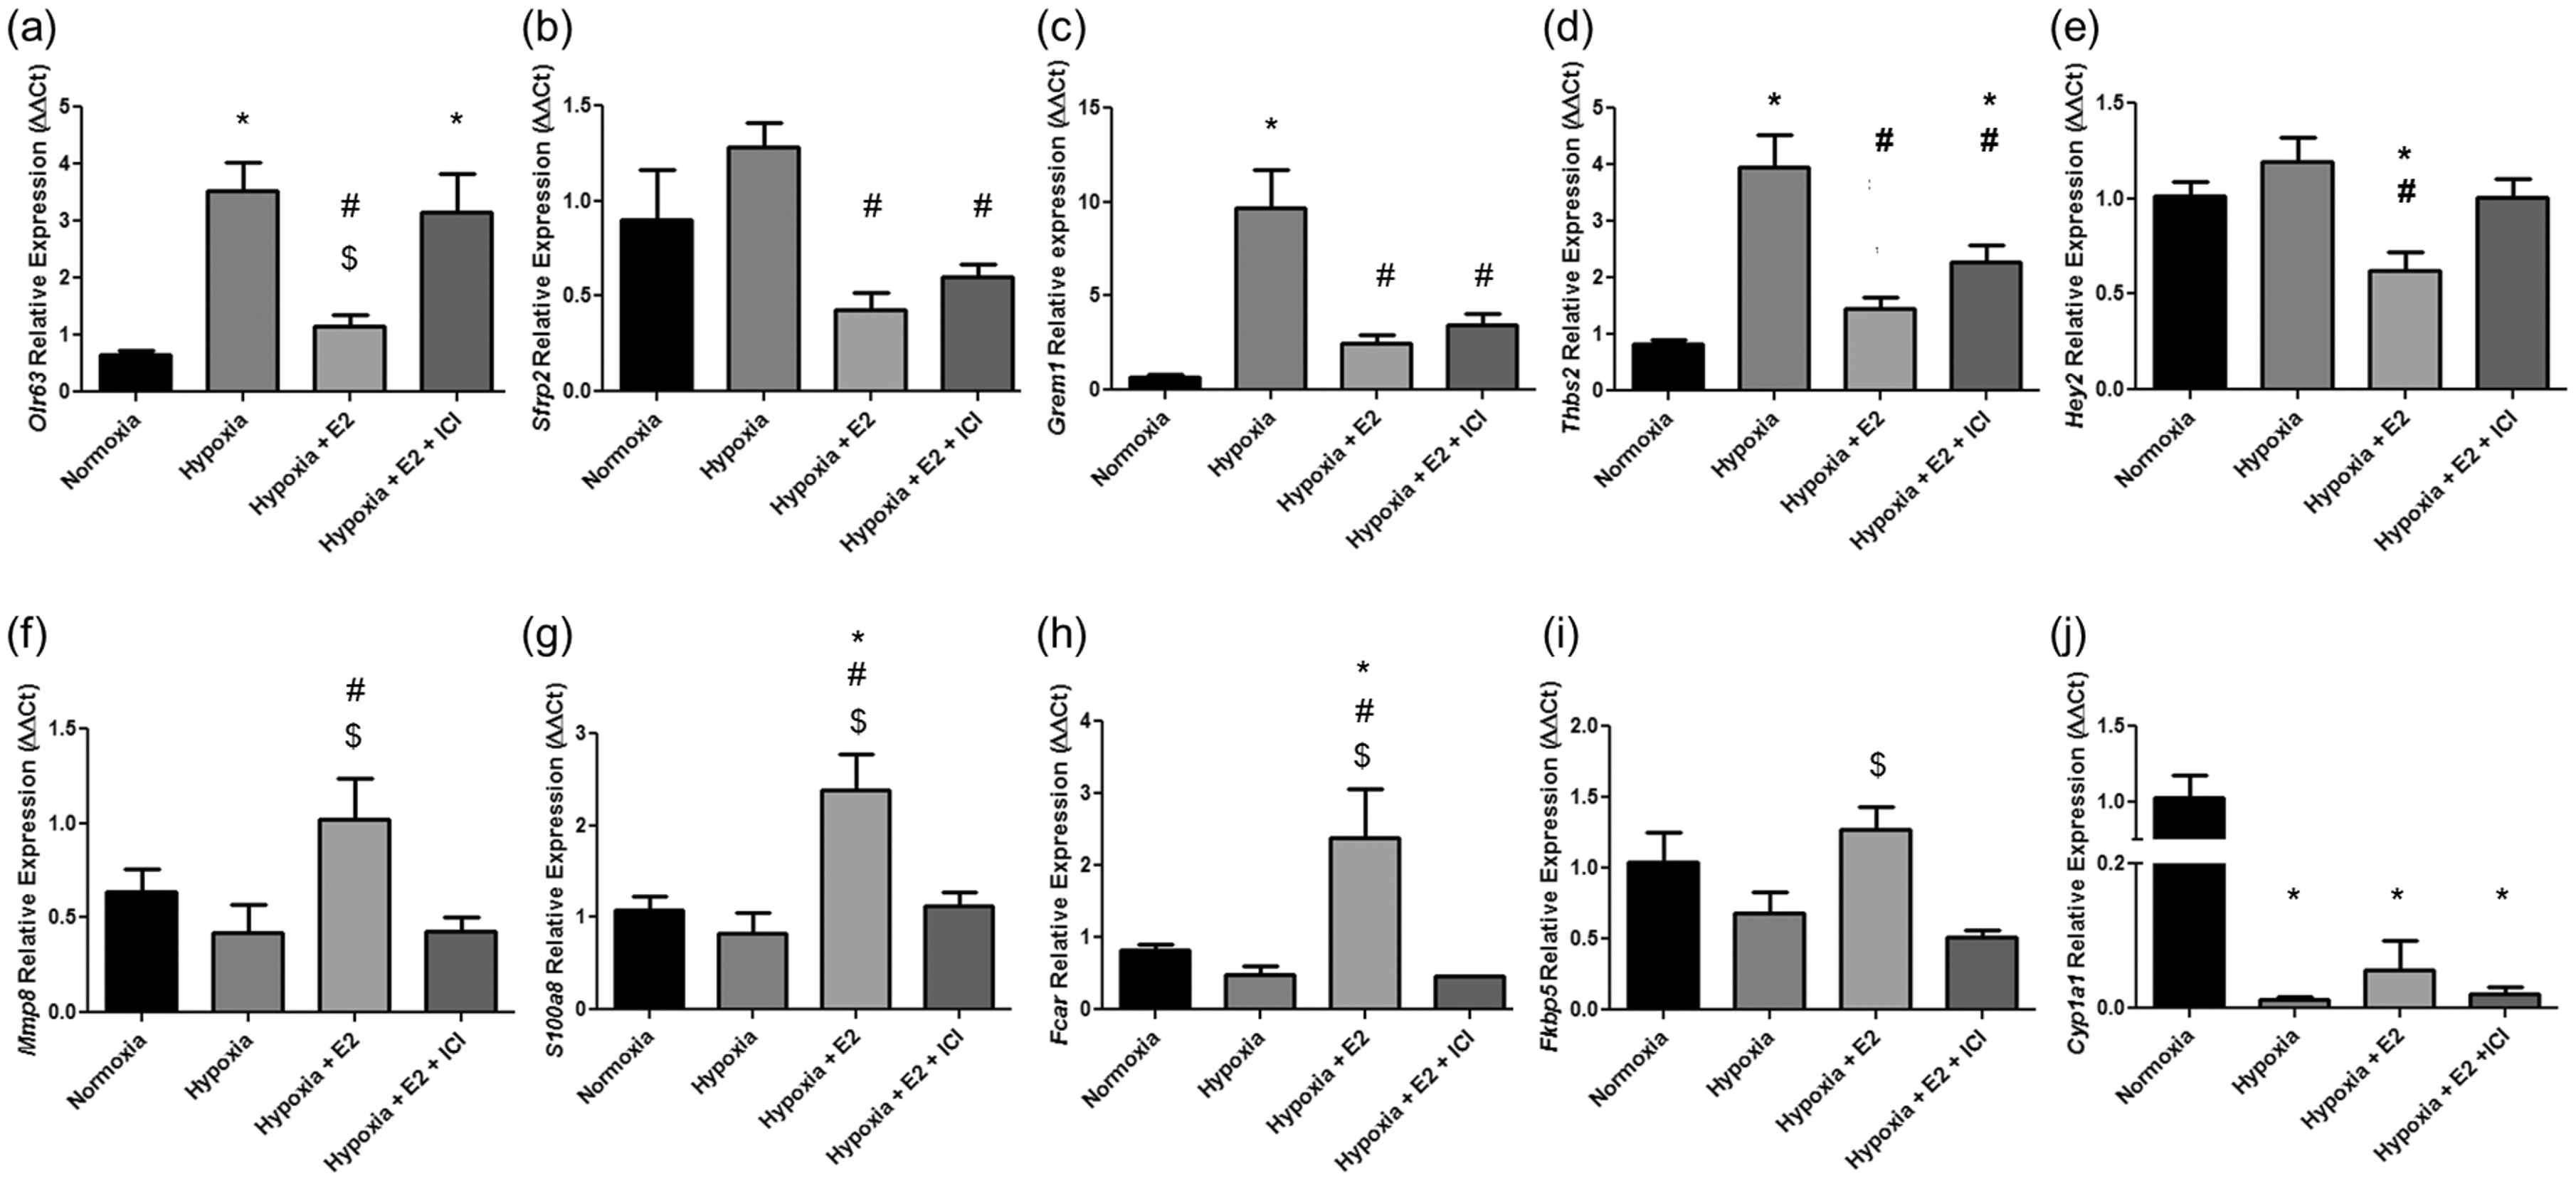
E2 decreases gremlin 1 and phosho-Smad 1/5/8 protein in HPH rats
Given that Grem1 was among the most downregulated genes in E2-treated animals, and given the well-established role of gremlin 1 as an inhibitor of BMP signaling and mediator of PAH development,28,51 we further investigated E2’s effects on this peptide. Ingenuity network analysis in hypoxia + E2 versus hypoxia animals revealed an extensive network of genes associated with gremlin 1 (Fig. 5). Interestingly, several known modulators of PAH development (e.g. Bmp2, Smad 1/5/8) were included in this network. The finding that the gremlin 1 target Bmp2 tended to be upregulated by E2 (Fig. 5 and Supplemental Fig. 2a; 1.42-fold change versus hypoxia, P value = 0.004, FDR = 0.13) and was significantly upregulated versus normoxia by RT-PCR (Supplemental Fig. 2b) was of particular interest, suggesting that the gremlin-BMP2 axis may be a potentially relevant target of E2 in HPH rats. To investigate this further, lung gremlin 1 protein expression was evaluated by immunohistochemistry and western blot. Interestingly, gremlin 1 was primarily localized to the pulmonary vasculature (Fig. 6a). Following expression of its gene, gremlin 1 protein was decreased in hypoxia + E2 treated rats versus hypoxia alone (Fig. 6a and b), whereas ICI co-treatment attenuated this effect. Analysis of whole lung tissues by western blot confirmed this finding (Fig. 6c and d), indicating that gremlin 1 indeed is a target of E2 and the ER in HPH.
Network of genes associated with gremlin 1 in hypoxia + E2 vs. hypoxia. Ingenuity network analysis in hypoxic animals treated with E2 (vs. untreated hypoxic animals) revealed an extensive network of genes associated with gremlin 1 that includes several known modulators of PAH development (e.g. Bmp2, Smad 1/5/8). Green indicates downregulation, red indicates upregulation. Color intensity is proportional to fold change. Values under each gene represent P value, FDR, and fold change vs. hypoxia. Relationships between molecules are represented as follows: single lines = binding; line with bar at the end = inhibition; line with filled arrowhead = activation; line with bar and filled arrowhead = activation and inhibition; line with circular head = result of action; line with closed arrowhead = translocation; arrow = reaction; arrow with diamond = enzyme catalyzed reaction; bold line = direct interaction; dotted line = indirect interaction. Grem1, gremlin 1; Col8A1; collagen 8A1; KLF9, Kruppel-like factor 9; Gfra 1, GDNF Family Receptor Alpha 1; Cyp17, Cytochrome P450 17; PMP22, peripheral myelin protein 22; Clec11a, C-Type Lectin Domain Family 11, Member A; Kdm6b, Lysine (K)-Specific Demethylase 6B; PPm1b, Protein Phosphatase, Mg2+/Mn2+ Dependent, 1B; Odh22, octano1 dehydrogenase; Rps6ka5, ribosomal protein S6 kinase A5; Maged1, Melanoma Antigen Family D1; Znf638, Zinc Finger Protein 638; Plscr4, Phospholipid Scramblase 4; Efemp2, EGF Containing Fibulin-Like Extracellular Matrix Protein 2; Bmp2, Bone morphogenetic protein 2; Rps6ka, ribosomal protein S6 kinase A; Ciap, Calf Intestinal Alkaline Phosphatase; Htra2, HtrA Serine Peptidase 2; Znf423, Zinc Finger Protein 423; Ebf1, Early B-Cell Factor 1; Postn, Periostin, Osteoblast Specific Factor; Soat1, Sterol O-Acyltransferase 1; Aldh1a3, Aldehyde Dehydrogenase 1 Family, Member A3; Nfix, Nuclear Factor I/X (CCAAT-Binding Transcription Factor; Pir, Pirin (Iron-Binding Nuclear Protein); NFkb, NF-kappaB; Snl1, SWI-independent3; Senp2, Sentrin-specific protease 2; Plk2, Polo-Like Kinase 2; Il17rb, Interleukin-17 receptor B; Hif3a, Hypoxia inducible factor 3 alpha subunit. Treatment with E2 ER-dependently decreases gremlin 1 protein in hypoxic lungs. Lungs from normoxic control animals, untreated hypoxic animals, and hypoxic animals treated with E2 with or without concomitant ICI 182,780 treatment were analyzed for gremlin 1 expression. (a) Representative immunohistochemistry stains demonstrate that gremlin 1 is localized to the pulmonary vasculature (arrows) and that E2 treatment is associated with a decrease in gremlin 1 expression. No such decrease was noted in hypoxic animals treated with E2 in the presence of estrogen receptor antagonist ICI 182,780. 20× magnification, scale bar = 100 µm. (b) Quantification of gremlin 1 stain in the pulmonary vasculature. (c) Western blot analysis and (d–f) densitometry of gremlin 1 and its downstream targets p-Smad1/5/8 and Id1 in lung homogenates. (b) n = 4/group, (d–f) n = 8/group (including the 16 animals used in microarray studies plus 16 additional animals from McMurtry et al.
22
used for validation of results). *P < 0.05 vs. normoxia control, #P < 0.05 vs. hypoxia, $P < 0.05 vs. hypoxia + E2 + ICI. One-way ANOVA with Tukey’s post-hoc correction. Data expressed as means ± SEM.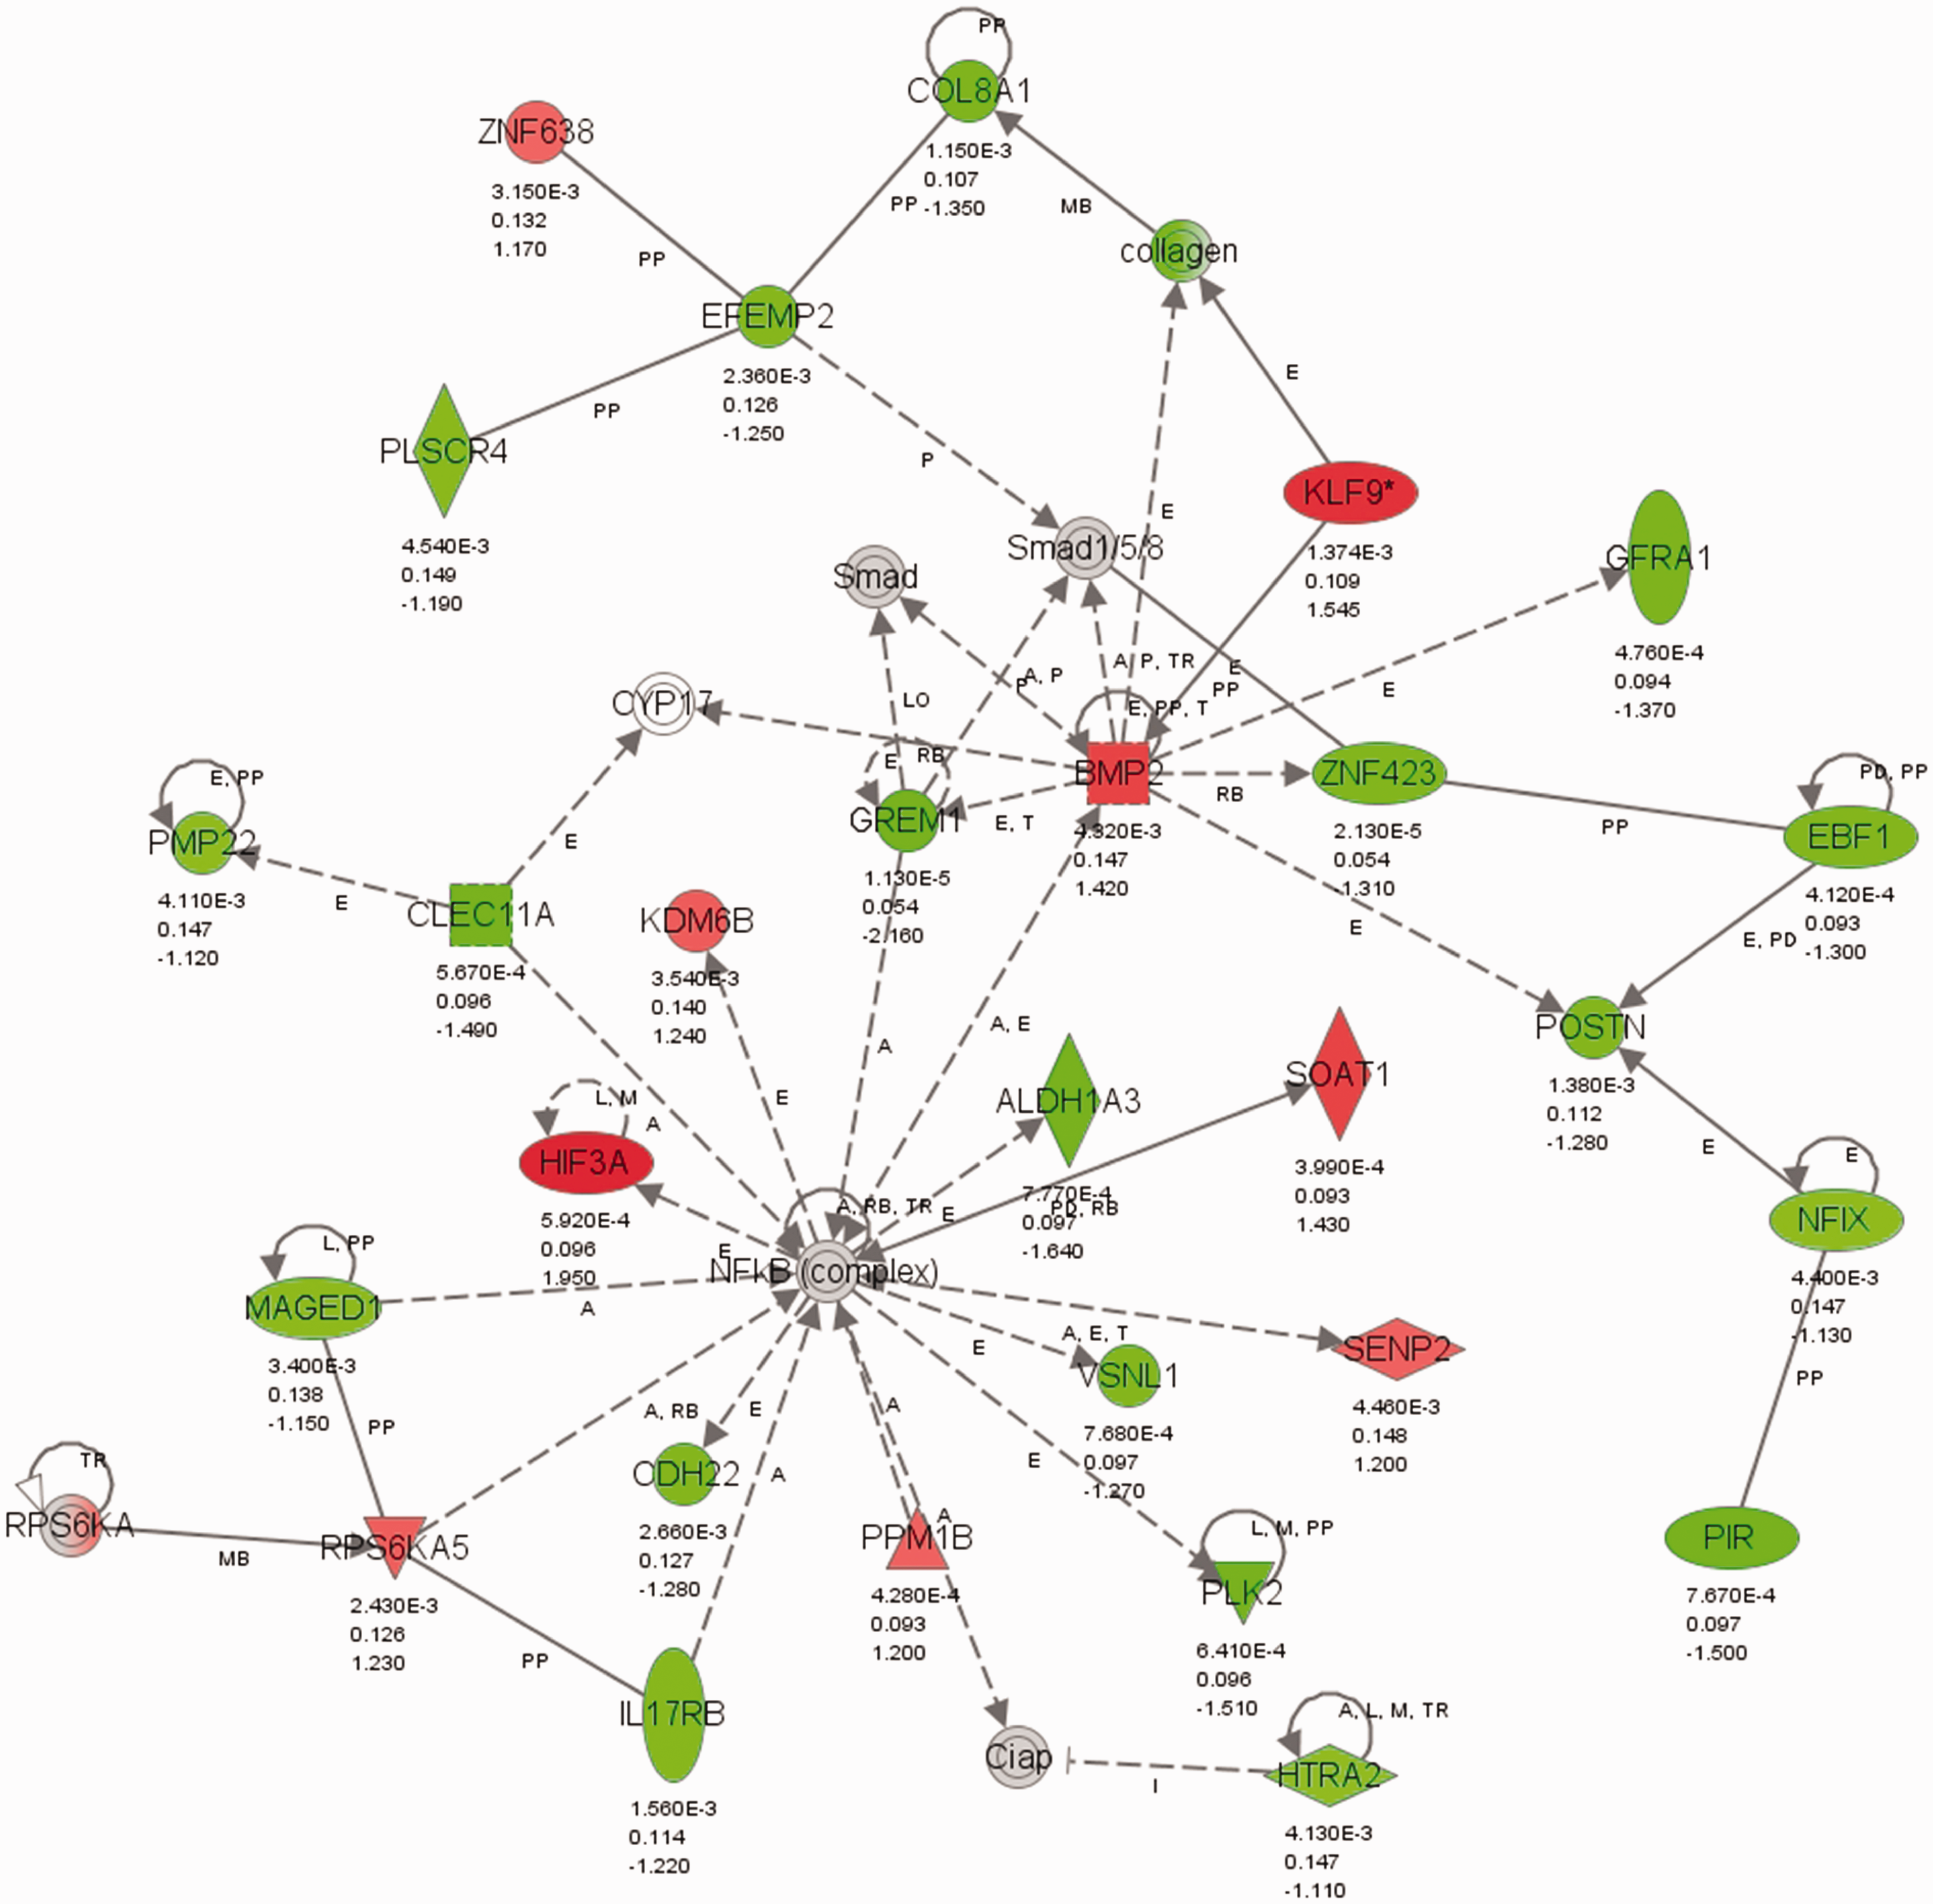
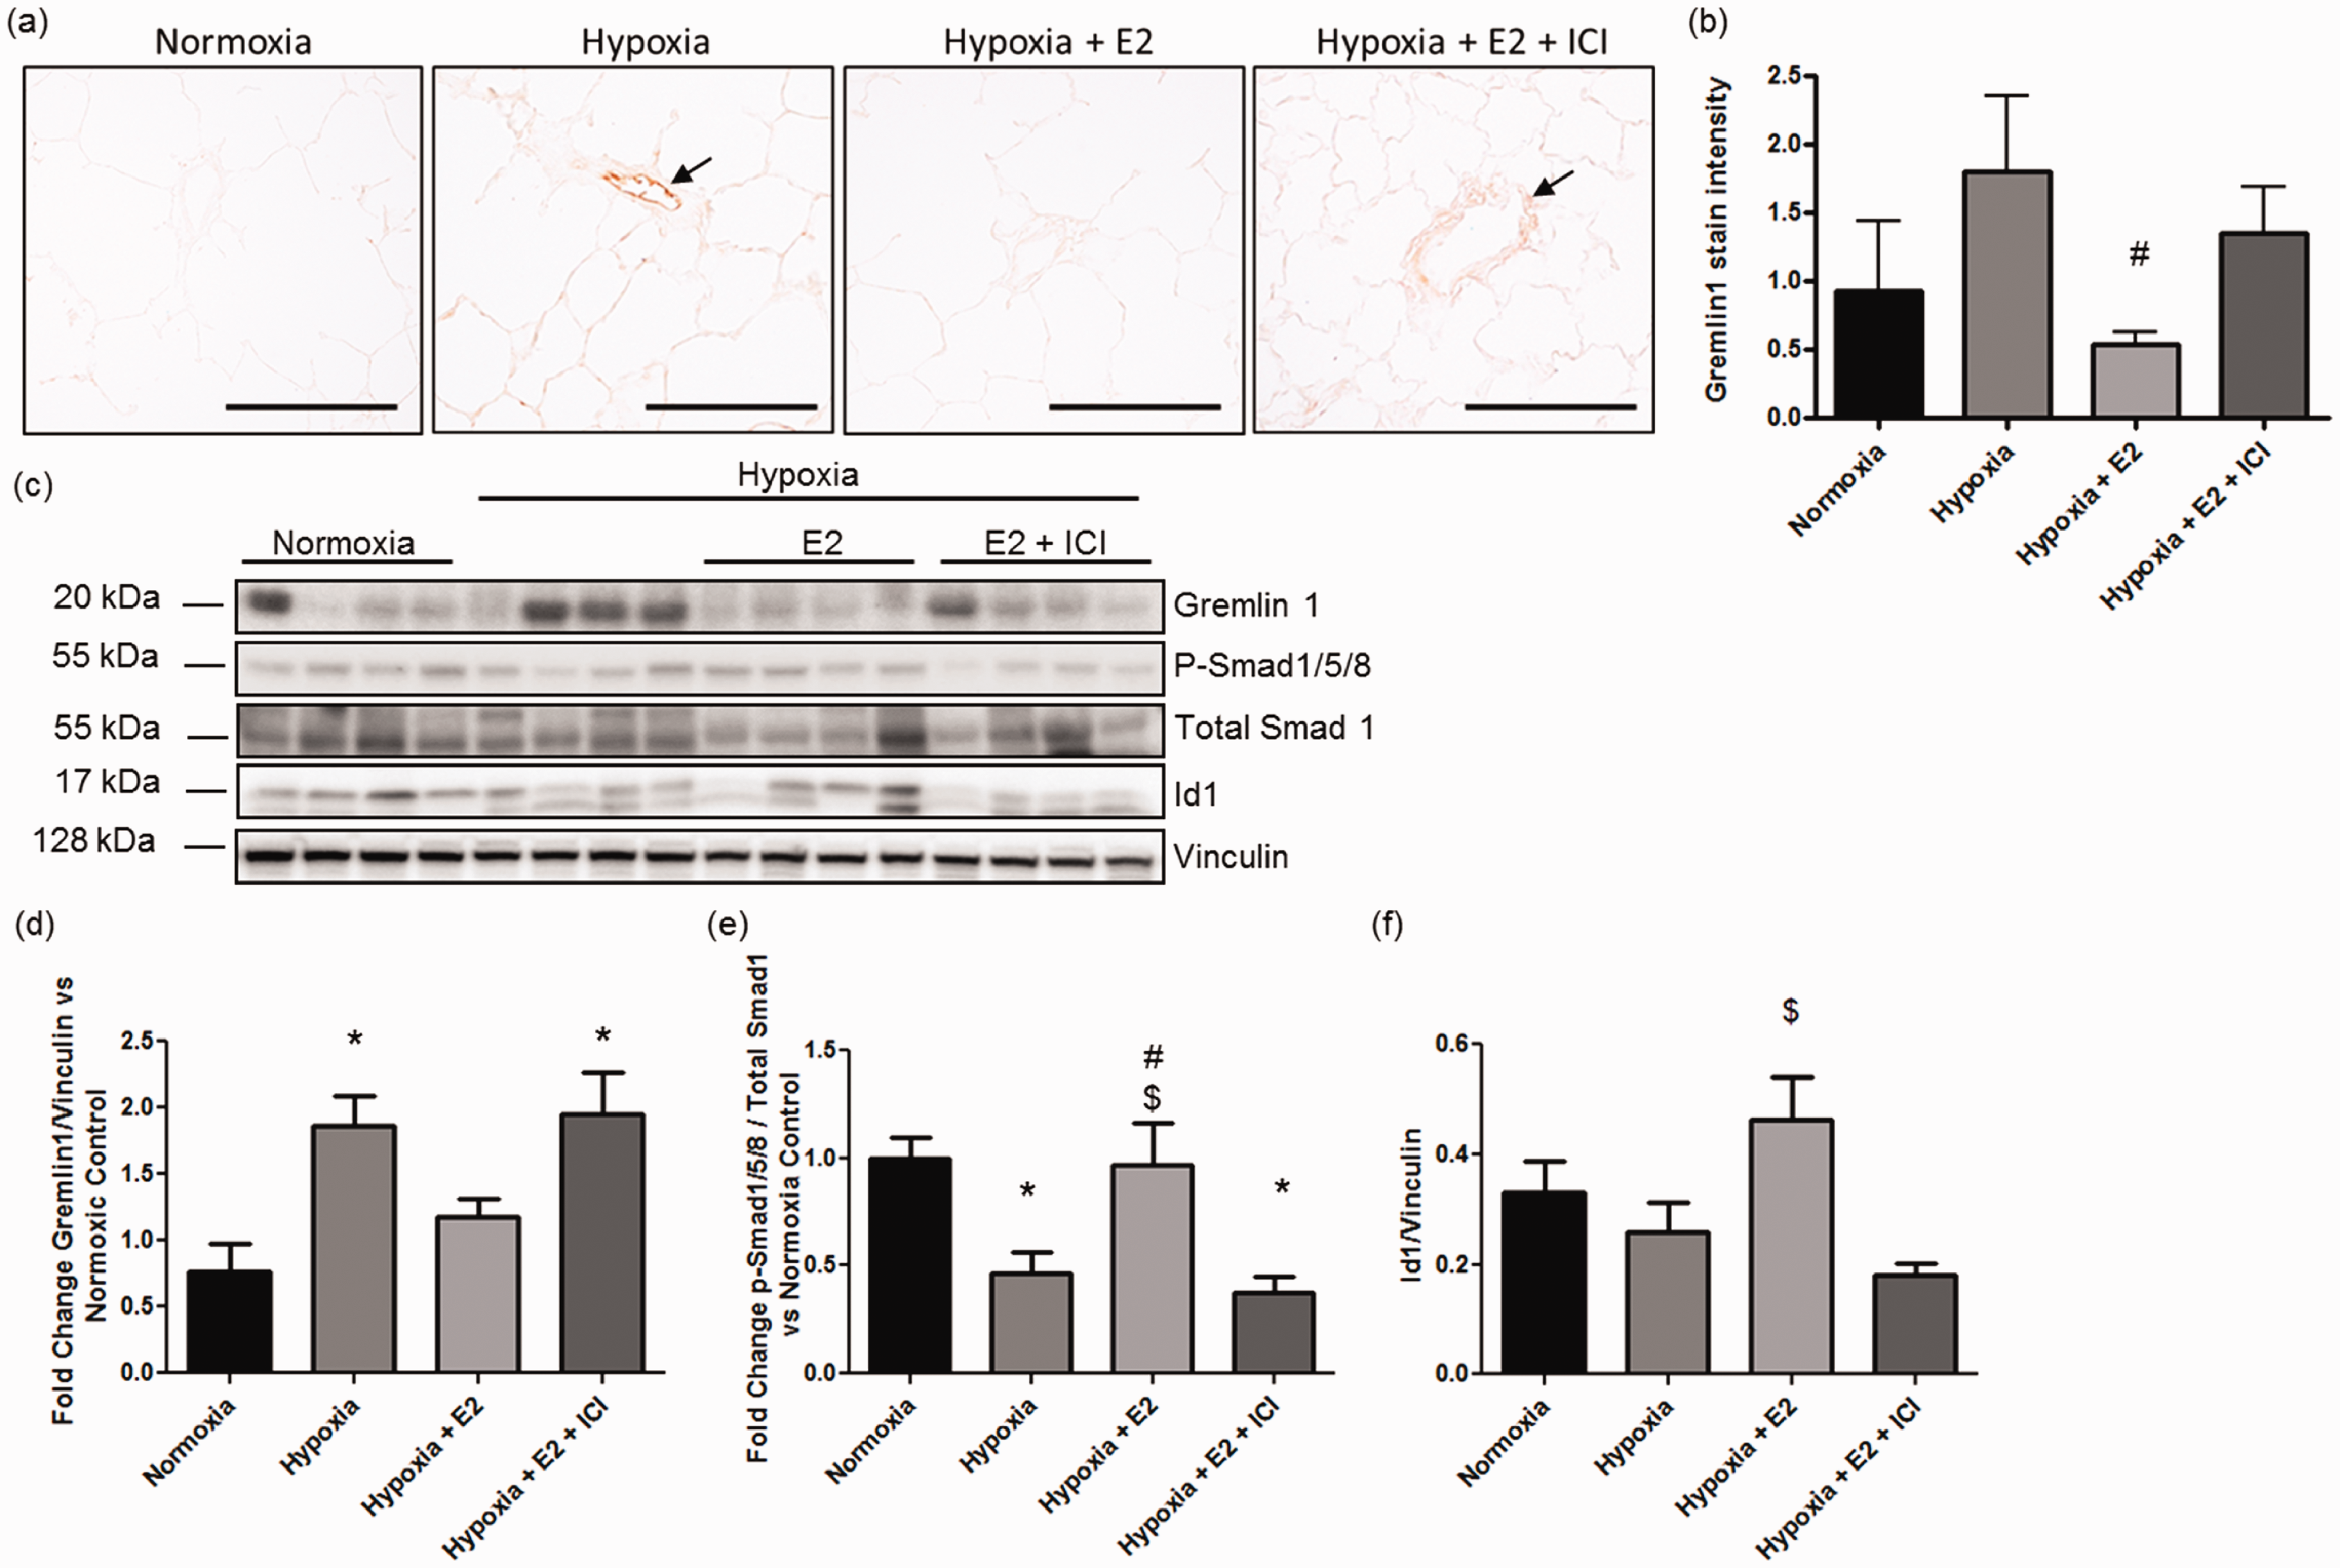
We next evaluated expression of BMP2’s downstream targets phospho-Smad 1/5/8 and Id1. E2 ER-dependently attenuated hypoxia-induced decreases in Smad 1/5/8 phosphorylation (Fig. 6c and e), suggesting that ER signaling may be necessary to maintain lung phospho-Smad 1/5/8 levels. Similarly, Id1 tended to be increased by E2 in hypoxic animals (P = 0.07) and was significantly decreased after ICI co-treatment (Fig. 6c and f). While the BMP2 receptor Bmpr2 was not significantly affected by E2 in our microarray (Supplemental Fig. 2a), real-time RT-PCR analysis identified Bmpr2 RNA to be significantly decreased by hypoxia (Supplemental Fig. 2c), with a trend for increase after E2 treatment. BMP2 and BMPR2 protein expression were not significantly affected by hypoxia or E2 (Supplemental Fig. 2d–f). Taken together, these data suggest an ER-mediated decrease in gremlin 1 expression and BMP downstream signaling in chronically hypoxic rat lungs.
Discussion
We report a novel and distinct regulatory network mediated by E2 under hypoxic conditions that is different from hypoxia alone. The regulatory pattern mediated by E2 was reversed by treatment with ICI, indicating that these genes are under the transcriptional regulation of the ER. The ER-dependent E2 target genome encodes proteins that range in function from modulators of BMP signaling (Grem1), steroid metabolism (Cyp1a1), immune response (Fcar, Thbs2), calcium signaling (Fkbp5, S100a8), cytoskeletal function (Olr63), extracellular matrix composition (Mmp8), Notch signaling (Hey2), and Wnt signaling (Sfrp2; summarized in Supplemental Fig. 3).
Several of these genes could play a role in HPH development. For instance, we identified gremlin 1 as a novel target of E2 in the pulmonary vasculature. Gremlin1 is an inhibitor of BMP 2, 4, and 7 (all of which are highly expressed in the pulmonary vasculature 35 ) and is increased in PAH patients.52–54 Increased gremlin 1 expression downregulates BMP-mediated signaling and increases PA smooth muscle cell proliferation and PA remodeling. 28 Here we show for the first time that gremlin 1 is downregulated by E2 under hypoxic conditions by an ER-dependent mechanism. Our studies were not designed to determine if E2 directly or indirectly regulates gremlin 1 expression, but given the presence of a putative estrogen response element in the Grem1 promoter (as reported by SABiosciences’ proprietary DECODE database (http://www.sabiosciences.com/chipqpcrsearch.php?app=TFBS), future studies will investigate if estrogen directly regulates gremlin 1.
Changes in Smad 1/5/8 phosphorylation and Id1 expression were reciprocal to changes in gremlin 1 abundance. This suggests that the changes in gremlin 1 had a functional relevance on BMP signaling and that gremlin 1 may be a clinically relevant target of E2 in HPH. Interestingly, a second BMP inhibitor, Bambi, had a similar expression pattern to gremlin 1 (–1.5 fold change hypoxia + E2 versus hypoxia), although the FDR was above the 0.1 cutoff.
In addition to Grem1, its target Bmp2 tended to be upregulated in lungs of hypoxic animals treated with E2. While RT-PCR cemented this finding, western blotting results did not recapitulate this pattern. Similarly, RT-PCR and western blotting findings differed for BMPR2. This discrepancy is not surprising, since BMPR2, similar to other cell surface receptors, is internalized and degraded upon ligand binding.55–58 This observation would also explain why BMPR2 protein was not increased by E2. Increased phospho-Smad1/5/8 and target Id1 expression, on the other hand, provides evidence that BMP signaling is indeed affected by E2.
Besides Grem1, E2 affected expression of several other genes that may be of relevance to HPH and PAH pathogenesis. For example, Cyp1a1, an enzyme which facilitates the oxidation of E2 into 2-hydroxy- and 4-hydroxy-metabolites,12,59,60 was the most downregulated gene in hypoxia versus normoxia (–23-fold change versus normoxic controls). Conversely, hypoxia + E2 animals exhibited a 2.28-fold increase in Cyp1a1 gene expression compared with hypoxic animals. The less reduced expression of Cyp1a1 suggests that in E2-treated animals there may be an increased conversion of E2 to its less harmful estrogen hydroxy- and methoxy-metabolites as opposed to its more harmful metabolite 16α-hydroxyestrone, which is not generated through Cyp1a1. 61 Since E2’s hydroxy-metabolites exert their effects without activating the ER,61,62 this may also explain why not all of E2’s target genes were affected by ER blockade.
S100a8 and S100a9 (3.35- and 3.05-fold increase in hypoxia + E2 versus hypoxia) are known modulators of inflammatory and proliferative responses. 45 While little is known about their role in PAH, a recent study in chronically hypoxic mice identified S100a9 as one of the most upregulated genes during re-exposure to room air (when the pulmonary vascular remodeling process regresses), 63 suggesting a potential role as a mediator of reverse pulmonary remodeling. The E2-related increase in S100a9 and its dimerization partner S100a8 could therefore be interpreted as a potential mechanism implicated in mediating E2’s beneficial effects on hypoxia-induced PA remodeling.
Another interesting target of E2 is Hey2 (–1.98 fold change versus hypoxia). Hey2 is a downstream target of Notch signaling shown to suppress p27Kip1, a known cell cycle inhibitor.64,65 Interestingly, our previous findings demonstrate that E2 increases p27Kip1, thus suppressing proliferative processes within the pulmonary vasculature. 20 It is conceivable that this occurs, at least in part, via Hey2 suppression.
Taken together, these findings suggest that E2 targets several genes that are established or potential modifiers of vascular homeostasis and HPH and/or PAH development (Supplemental Fig. 4). However, the role of E2 in the pulmonary vasculature is complex, and while E2 has been shown to be vasculoprotective in hypoxia by inducing vasodilation, decreasing remodeling of small pulmonary vessels, and decreasing PAEC proliferation, it has also been implicated in PAH development in the setting of BMPR2 mutations or abnormalities in serotonin signaling, thus suggesting context-specific effects (reviewed in 12). Even in the setting of hypoxia, we noticed changes in gene patterns that would be considered unfavorable in individuals with PH. For example, E2 increased expression of Cxcr2, a gene encoding a chemokine receptor involved in PH pathogenesis. 66 These data suggest that a better understanding of E2’s effects in HPH and PAH may allow for dissecting beneficial and detrimental effects in various contexts, thus allowing for targeted and context-dependent manipulation of E2 and ER signaling.
Our studies were performed in male animals and therefore do not provide information on the E2-dependent genome in hypoxic females. Since studies in female animals are confounded by changes in E2 levels due to the estrous cycle, such studies would be more difficult to perform and require a large number of animals. Given this limitation, these studies are beyond the scope of the current manuscript, but will be the focus of future investigations. In addition, our studies do not allow for detection of changes occurring early in the remodeling process (e.g. within the first few days), which would require time courses and thus a large number of animals. Finally, the HPH model does not necessarily recapitulate features of PAH. However, chronic hypoxia is a major driver of WHO group 3 PH and thus of importance to a large patient population. 26 Additionally, several aspects of HPH (e.g. inflammation, growth factor activation, media hypertrophy 25 ) are also applicable to PAH. Despite these limitations, our studies provide several important findings and are a critical first step in identifying novel targets of E2 and the ER in HPH, thus providing the rationale and basis for future mechanistic evaluations focused on developing novel therapeutic strategies for HPH.
In summary, we provide the first evidence of an ER-dependent, E2-specific lung genome in HPH. E2’s target genes include genes involved in regulating proliferative processes, angiogenesis, ECM composition, immune responses, as well as calcium, Notch/Wnt and BMP signaling, suggesting that E2’s protective effects in HPH may encompass modulation of these pathways. A better understanding of the effects of hypoxia and E2 on these processes may help solve the “estrogen paradox” in PAH and allow for identification of novel molecular targets in HPH as well as PAH.
Footnotes
Acknowledgments
The microarray studies were carried out using the facilities of the Center for Medical Genomics at Indiana University School of Medicine. The Center for Medical Genomics is supported in part by the Indiana Genomics Initiative at Indiana University (INGEN®, which is supported in part by the Lilly Endowment, Inc.). The authors thank Dr. Irina Petrache for her assistance in interpreting the microarray data.
Conflict of interest
The author(s) declare that there is no conflict of interest.
Funding
This work was supported by an Indiana Clinical and Translational Sciences Institute Core Pilot Grant (TL), VA Merit 1I01BX002042-01A2 (TL), and NIH 5TL1TR001107-02 (ALF).
References
Supplementary Material
Please find the following supplemental material available below.
For Open Access articles published under a Creative Commons License, all supplemental material carries the same license as the article it is associated with.
For non-Open Access articles published, all supplemental material carries a non-exclusive license, and permission requests for re-use of supplemental material or any part of supplemental material shall be sent directly to the copyright owner as specified in the copyright notice associated with the article.